 Chartists are often faced with a choice: wait for the breakout or anticipate using a mean-reversion setup. The Metals & Mining SPDR (XME) broke out of a bullish consolidation this week and the breakout signals a continuation of its long-term uptrend. Chartists keying off the mean-reversion setup could have anticipated the breakout and gotten the early jump. Let's investigate.
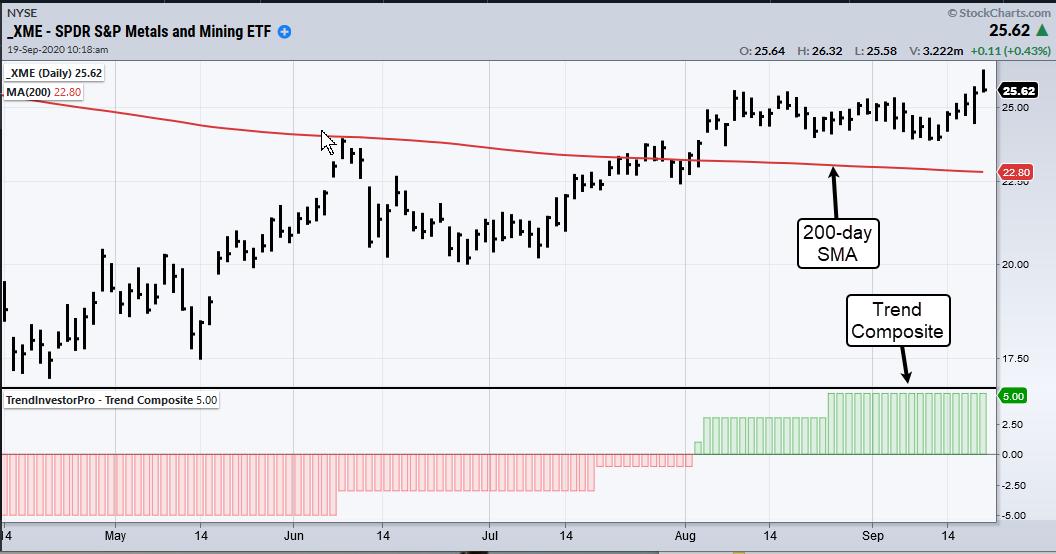
First and foremost, the long-term trend is up for XME. Price is above the 200-day SMA and the TIP Trend Composite has been net bullish since early August. This indicator aggregates five trend-following indicators and turns positive when three of the five are on active bullish signals. It is currently at +5, which means all five indicators are on active bullish signals. You can learn more about this indicator here.
After breaking above the 200-day SMA with a move from 20 to 25 (25%), XME took a rest and consolidated with a falling flag from early August to mid September. This is a bullish continuation pattern and this week's breakout signals a continuation of the bigger uptrend. A 25% advance from the flag lows would project a move to around 30.
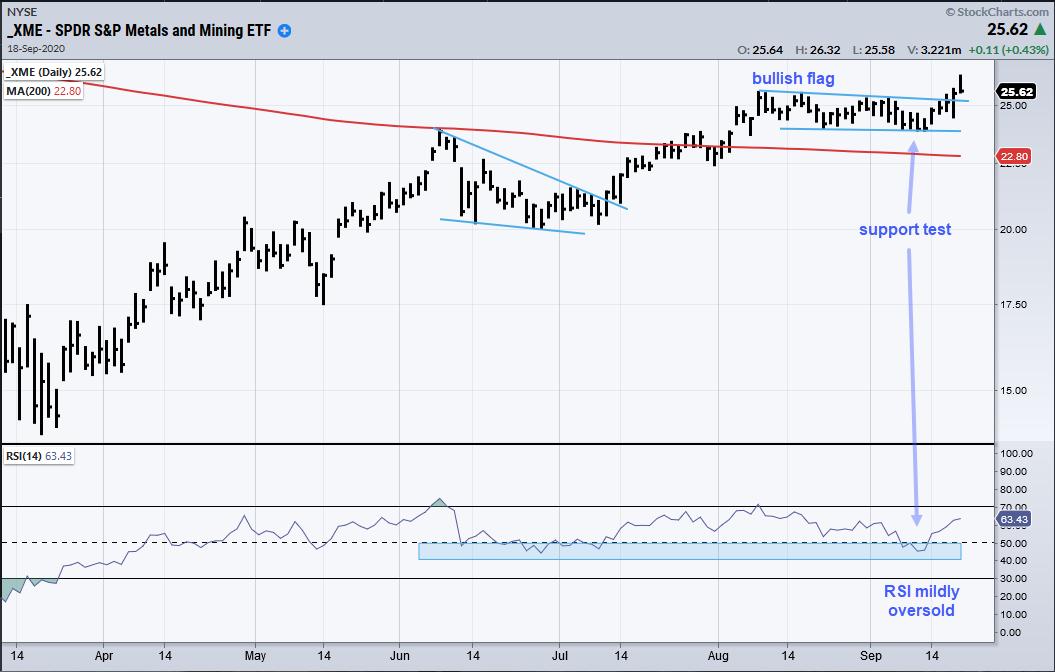
Just before the flag breakout, XME produced a mean-reversion setup as the ETF tested the mid August lows and RSI dipped into the 40-50 zone (blue shading). The test of the lows amounted to a support test and an area to watch for a bounce. The RSI dip into the 40-50 zone denotes a mild oversold condition that can give way to a mean-reversion bounce. The combination of a support test and mild oversold condition alerted mean-reversion traders to be on alert for an upturn and breakout. A similar setup occurred in late June and early July when XME formed a falling wedge.
At this point I would consider the flag breakout bullish and valid as long as the flag lows hold (24). As far as the long-term trend is concerned, I would consider it up as long as XME holds the 200-day and the Trend-Composite remains positive.
The TIP Indicator Edge Plug-In for StockCharts ACP contains ten indicators to help you navigate the charts. In addition to the trend indicators, there is also a Momentum Composite and two volatility indicators. See this article for complete explanations and chart examples.
Looking for more analysis and setups for ETFs? Check out TrendInvestorPro.com. Each week we group and rank ETFs according to their trends, chart patterns and trading setups. This report also includes an ETF ChartBook with over 50 annotated charts and notes. Click here to take your analysis to the next level
-------------------------------------
Choose a Strategy, Develop a Plan and Follow a Process
Arthur Hill, CMT
Chief Technical Strategist, TrendInvestorPro.com
Author, Define the Trend and Trade the Trend
Want to stay up to date with Arthur's latest market insights?
– Follow @ArthurHill on Twitter
– Subscribe to Art's Charts
