The charts continue to roast the bears. It's been an aggressive run; they are hanging on, but it seems they are getting knocked off every perch. The Nasdaq even joined the party on Wednesday, finishing up on a down day for the Dow and $SPX.
But the question on everybody's mind is - will it last?
Below are a couple of charts that I like to use to help me with where we are. The top panel of the chart is the log chart of the $SPX.
The second panel is the Bullish Percent Index for the $SPX. As long as the indicator is above the red lines, it is very bullish. Above one of the red lines is strong, but needs to be watched. If it goes below the red lines, that typically means the market is heading into or currently in a correction. One of the things to like about the indicator is that when it keeps pushing above the top line, that shows that lots of stocks are on a buy signal. Since the COVID low, this has been thrusting to very high levels, suggesting lots of involvement in the bull market. Notice the bear markets typically can't get up to these strong levels if we look back in 2003 or 2008. Throughout all of 2018, not many stocks were participating when the trade tariff dispute was underway.
The lower panel is actually one of the best ones to visually demonstrate the strength of the bull market clearly. Notice how the bull markets of 2003, 2009, 2011, 2013 and 2020 all hit this level. Even in 2007, it reached up there, but the stock market never topped until 6 months after this high level.
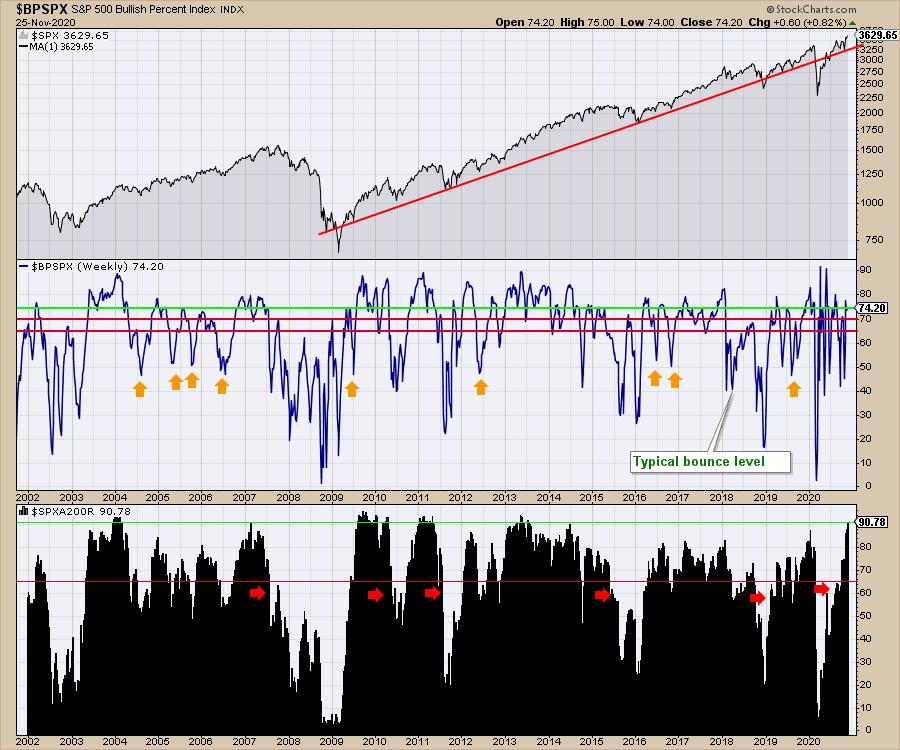
Without a doubt, both indicators are demonstrating the traits of a big bull market. I would suggest that, unless we get a hiccup in the vaccines, the market is looking past the near-term slowdowns.
Good trading,
Greg Schnell, CMT, MFTA.
Good trading,
Greg Schnell, CMT, MFTA
Senior Technical Analyst, StockCharts.com
Author, Stock Charts For Dummies
Want to stay on top of the market's latest intermarket signals?
– Follow @SchnellInvestor on Twitter
– Connect with Greg on LinkedIn
– Subscribe to The Canadian Technician
– Email at info@gregschnell.com
