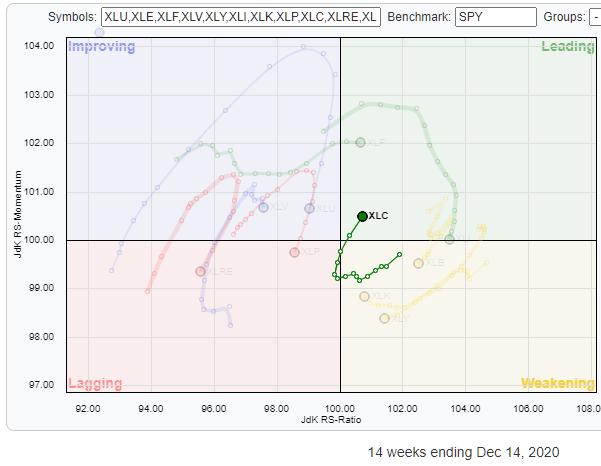
Over the last weeks, the Communication Services sector continued to improve and recently moved back into the leading quadrant after rotating through weakening and, very briefly, through lagging. This rotation, especially the increase in RRG-Velocity (the distances between the week-to-week observations), make XLC an interesting sector to keep your eyes on.
The small RRG on the right shows that rotation over the last 14 weeks. Click on the image to blow it up and get the link to the live chart.
Of course, you could just get a position in XLC and get broad exposure to the sector as a whole, but for some people that may not be enough.
Zoom in on Individual Communication Services Stocks
To get a more detailed view of what is going on inside the Communication Services sector, we can open up the Relative Rotation Graph showing the rotations for all individual stocks in the sector against XLC as the benchmark.
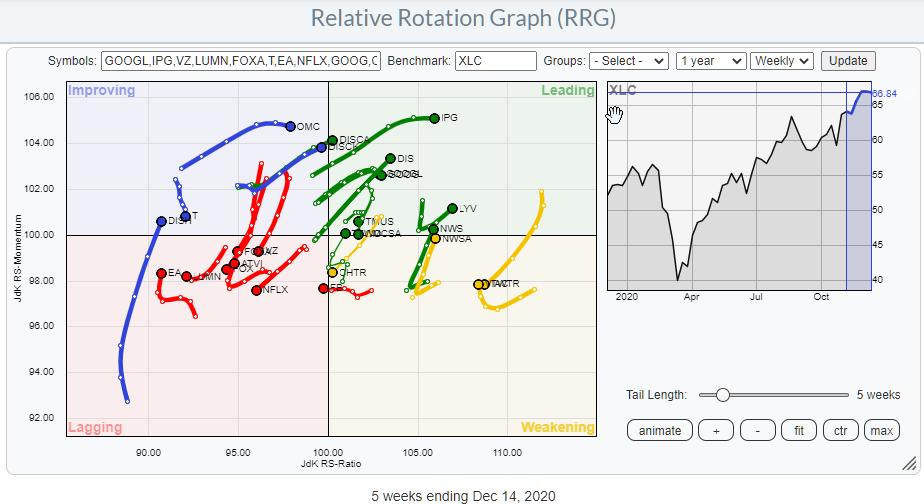
Going over the positions and the directions (RRG-Heading) of these tails shows there are a few stocks that are in the top-ten of holdings for XLC that are inside the lagging quadrant or rapidly heading in that direction.
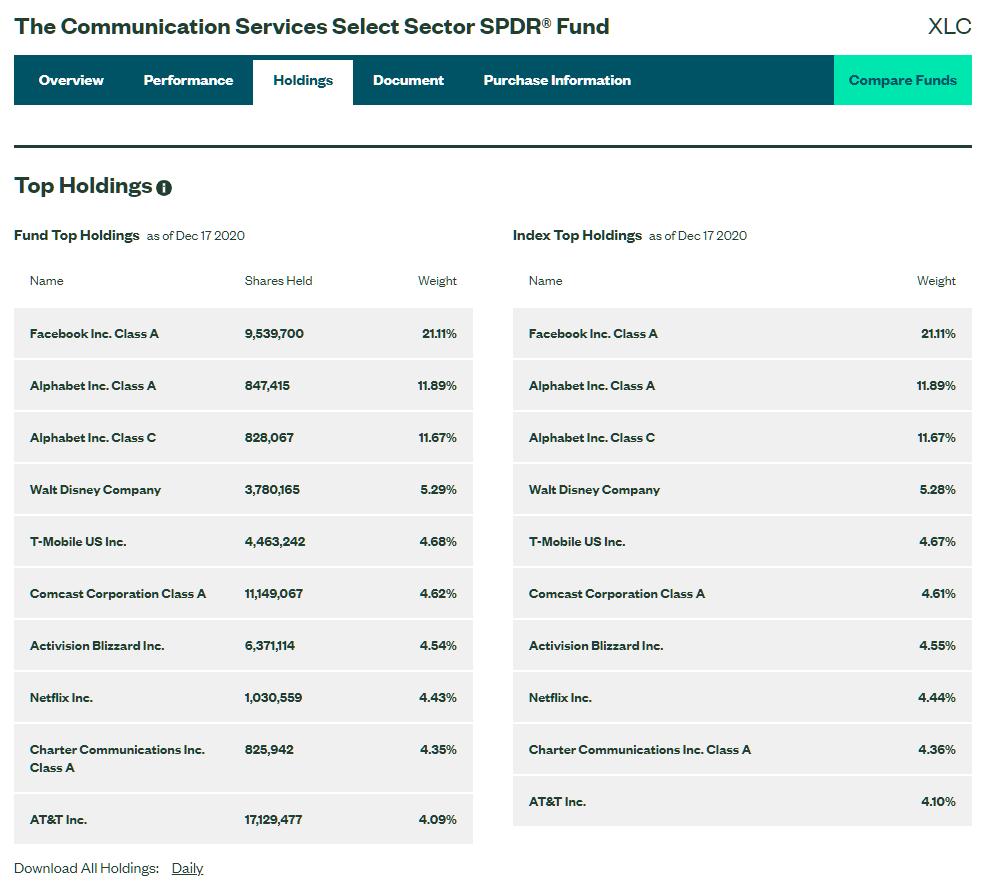
The information on holdings for these ETFs is publicly available on the State Street website.
The RRG below zooms in on the tails for these top-ten names inside Communication Services.
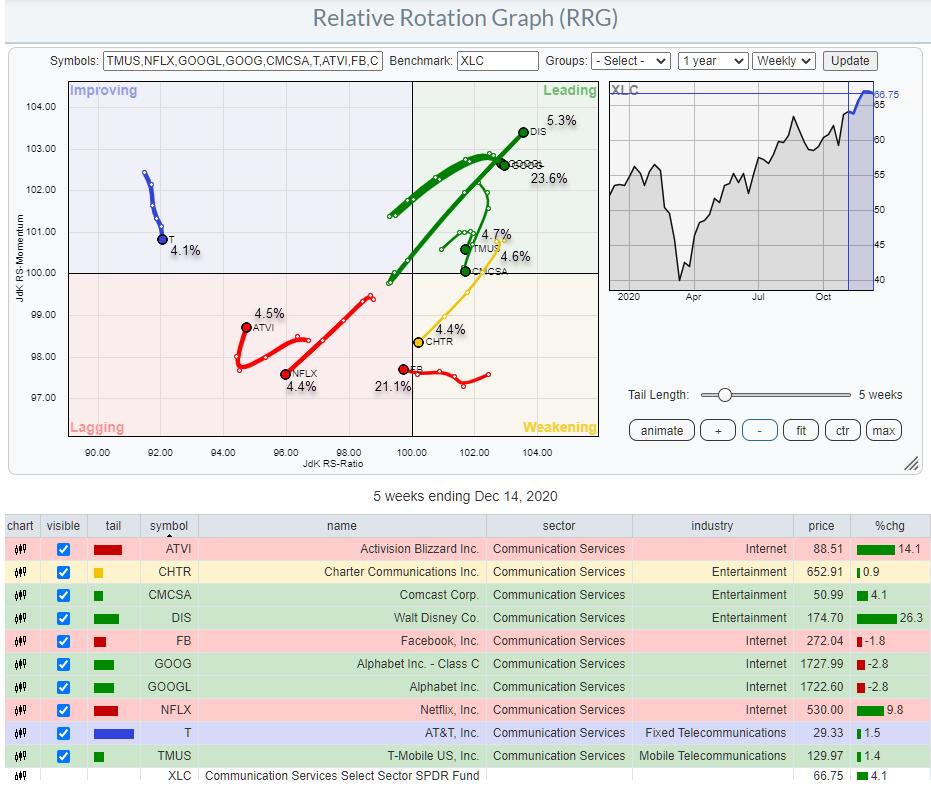
Roughly adding up the percentages, we have about 38% inside the leading quadrant + 4.5% of ATVI just turning around to a 0-90 degree heading while breaking to new highs. And then there is 34% inside lagging or close to crossing over (T, and CHTR).
We Like XLC But Not FB
Now, since StockCharts.com recently partnered with Tradier Brokerage to offer flat fee options trading (and commission free equities trading), it makes sense to bring in some ideas to use options to fine tune portfolios and/or positions. In this particular case, it could be interesting to (partly) get rid of the exposure to Communication Services stocks that are negatively affecting the performance for the sector. The most important one here obviously being FB, and to a lesser degree CHTR, NFLX, and T.
Options offer us the possibility to fine tune allocations. The base assumption is that we want to have positive, long, exposure to the Communication Services sector by buying the XLC ETF. But we are not happy with the exposure to FB.
When you own an ETF like XLC, you can calculate your exposure to each individual stock in that ETF. FB makes up a little over 20% of that ETF. This means that, in every share of XLC, 20% is FB.
One way of "removing" the exposure to FB inside XLC could be to sell short an equivalent of 20% of your total XLC holding in FB. That would be a DELTA-1 solution. This completely hedges the exposure to FB within XLC.
With XLC at $66.75 and FB at $272.00, that means for every $1360 (20.4 shares) in XLC, you can sell 1 share of FB.
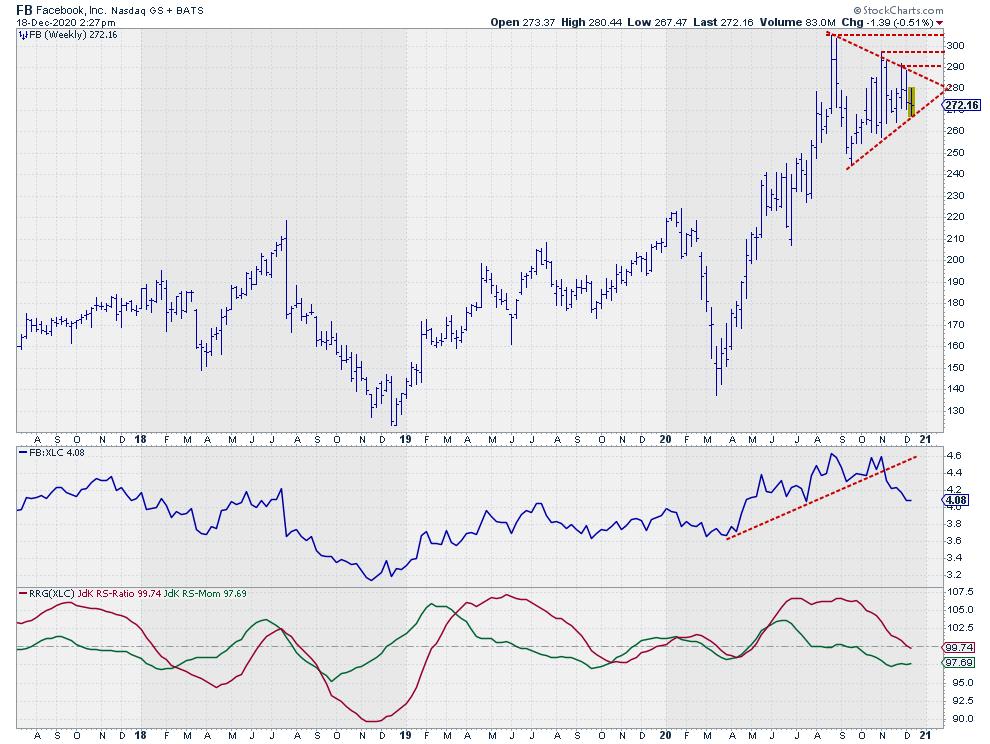
A look at the chart for FB shows that the price is currently caught inside a symmetrical triangle, while relative strength has clearly broken rising support and is now moving lower, pushing both RRG-Lines below 100 and the tail into the lagging quadrant on the RRG.
With this sort of weakness in relative strength vs. the sector, an upward break from the triangle will have a hard time rallying strongly while facing a few previous highs as resistance levels on the way.
Selling Calls To Remove Exposure
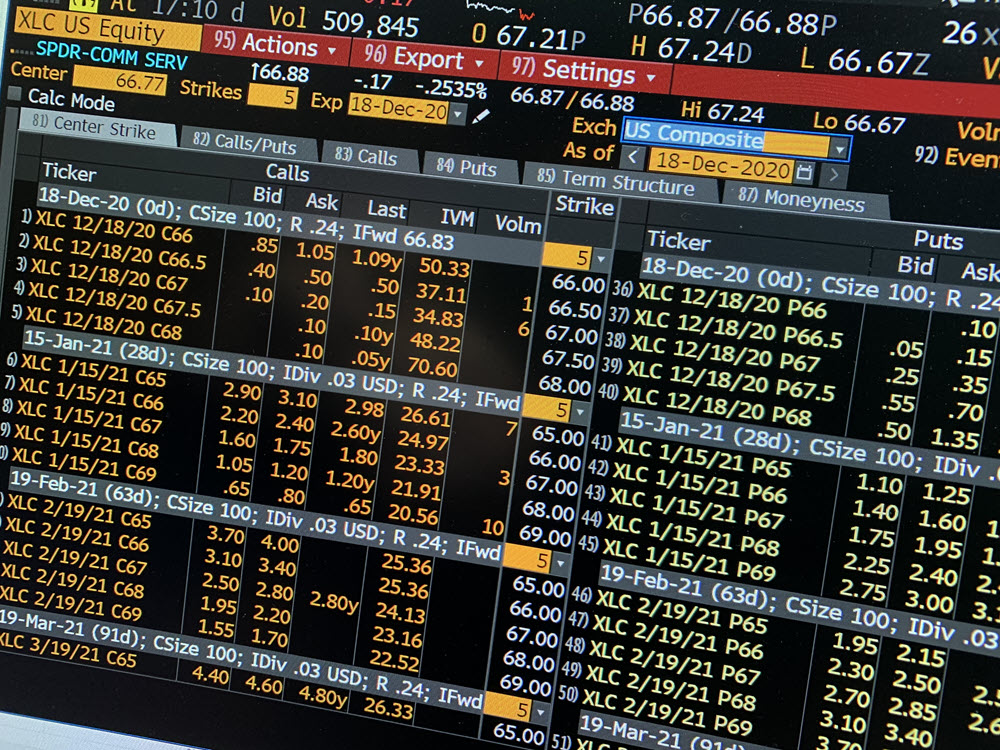
An options strategy to consider to (partly) remove exposure to FB could be to SELL CALL options with a STRIKE price (far) below current levels, i.e. a deep in-the-money call. So, in this case for example, a strike price of $250.
A FEB21 CALL 250 currently trades around $ 26.70, with the stock at $ 273.00. As 1 option represents 100 shares, you would need a position of roughly 2000 XLC ($136.000 equivalent) to sell 1 CALL option on FB. This would generate $26.70 (*100) in proceeds from the sale.
What this essentially means is that you are selling FB at $276.70 (strike + premium). When FB rises, the position will not benefit and will be the equivalent of XLC without FB, so you'd be lagging the performance of XLC.
When FB remains the same or goes down, the option position will start to "work". At this moment, the intrinsic value of that option is $273.00 - $250.00 = $23 and, thus, there is currently $3.70 of time value.
If FB does not move and our option expires on 1/15/21 with FB at $273, we need to close and buy back that option at $23 and we have gained $3.70.
If FB declines and at expiration trades at, say, $260, the position needs to be closed at a cost of $10, so profit will be the $3.70 + $13 = $16.70.
With a price for FB on expiration at or below $250, this call will expire worthless and generate max profit of $26.70.
As we also still hold the XLC ETF, the gains on the sold FB CALL option will partly off-set any potential decline in XLC or when XLC manages to rise into January, add to the profit of the combined position.
Of course when the option expires, the XLC position remains and you can start all over again.
As the price of FB is very high in $ terms, it requires quite a big position in the ETF to make such a strategy work and, therefore, may not be viable for smaller portfolios. Also, as XLC will not be accepted as collateral for "naked" calls, you will need to deposit margin to be able to sell these calls without protection.
What I wanted to do is show how options can help to create more tailored and granular exposure than a straightforward ETF position. Let me know what you think!!
My regular blog is the RRG Charts blog. If you would like to receive a notification when a new article is published there, simply "Subscribe" with your email address.
Julius de Kempenaer
Senior Technical Analyst, StockCharts.com
Creator, Relative Rotation Graphs
Founder, RRG Research
Host of: Sector Spotlight
Please find my handles for social media channels under the Bio below.
Feedback, comments or questions are welcome at Juliusdk@stockcharts.com. I cannot promise to respond to each and every message, but I will certainly read them and, where reasonably possible, use the feedback and comments or answer questions.
To discuss RRG with me on S.C.A.N., tag me using the handle Julius_RRG.
RRG, Relative Rotation Graphs, JdK RS-Ratio, and JdK RS-Momentum are registered trademarks of RRG Research.
