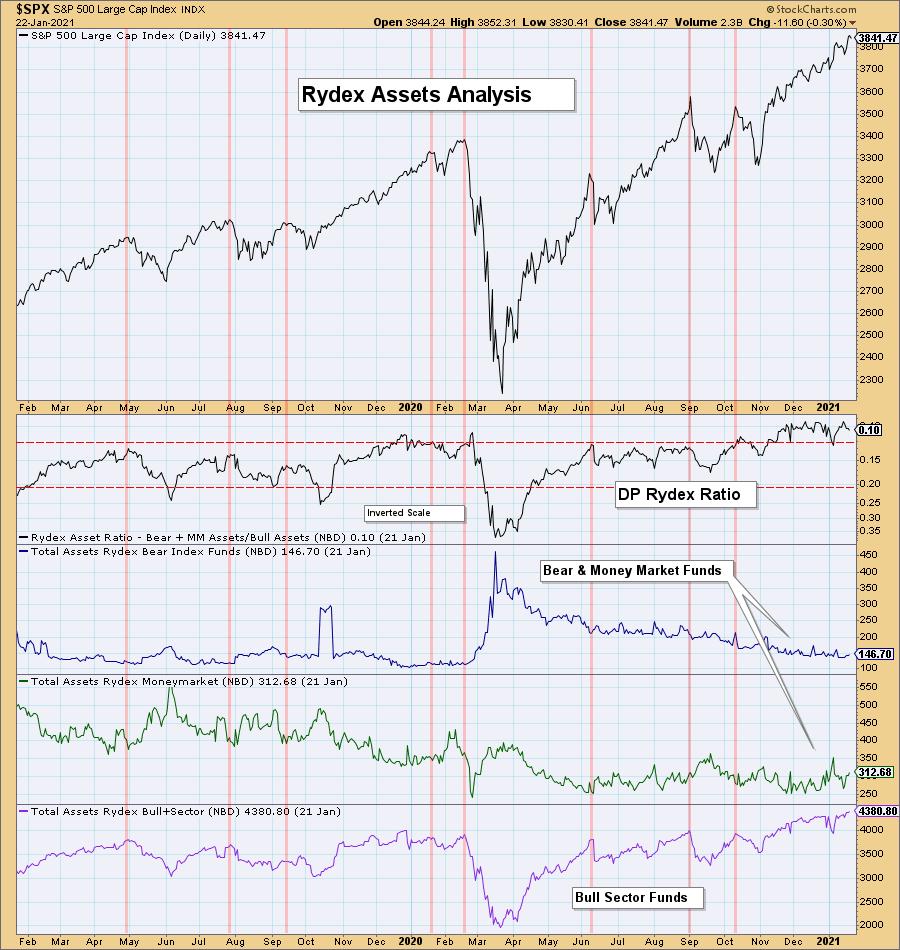
I believe it is time to revisit the Rydex Ratio sentiment chart. A few DecisionPoint.com subscribers have noticed how overbought it has become; I wrote about it in last week's DP Weekly Wrap for subscribers of the DP Alert. Thursday night (1/14), after the latest asset counts were in, the Ratio finished with the lowest reading recorded, at 0.09. We invert the scale to arrange overbought readings on the top. A very low reading means participants are VERY bullish. Euphorically bullish investors lead to downside reversals.
On the chart below, we've annotated cardinal price tops. You'll note that at these tops, the Rydex Ratio was always overbought.
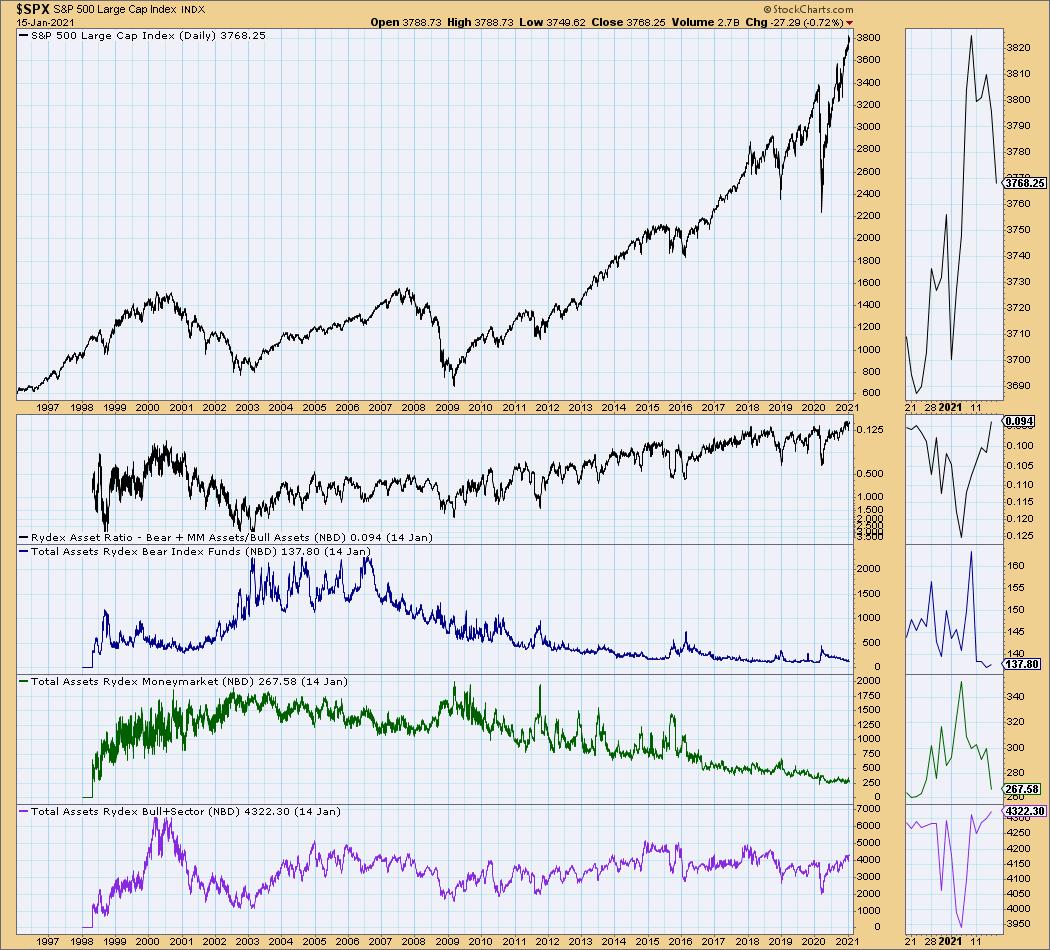
The long-term chart shows you that, indeed, these are the lowest readings we've ever recorded for the Rydex Ratio.
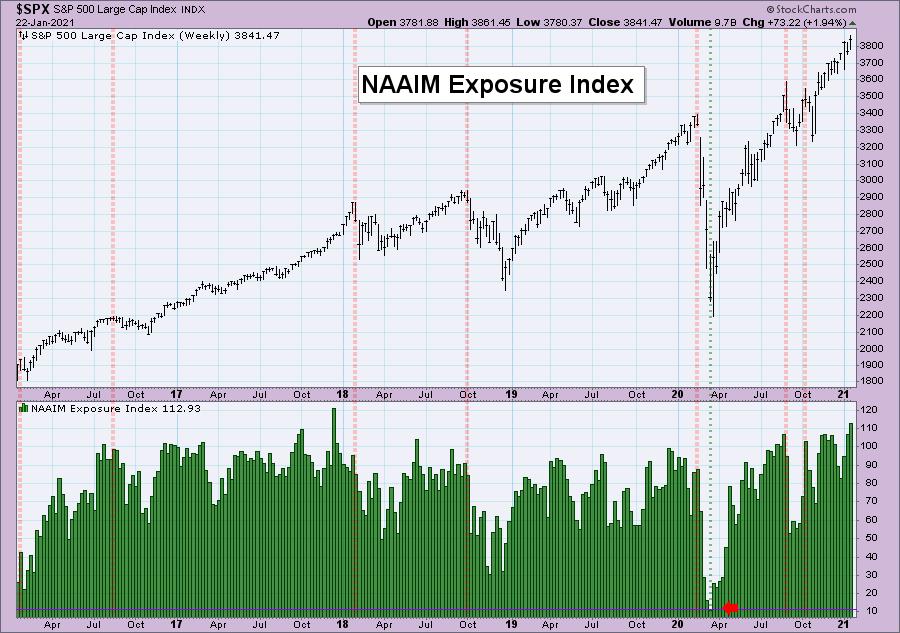
But wait! There's more! Tom McClellan wrote an article last night about the National Association of Active Investment Managers (NAAIM) Exposure Index that is a must read. We had thought that this new reading was the highest exposure reading ever, but it turns out our 2017 data wasn't quite right, so we did see a higher reading back then.
I still think seeing the second highest exposure reading is big news and goes hand in hand with what we are seeing on the Rydex Ratio. I've annotated cardinal market tops to give you perspective on how this sentiment works. Typically, right before major market tops, we see very high exposure readings. You will also note that, after the highest reading ever in 2017, it took a few weeks before the top was in. That could be the case right now, given the strong bullish bias in the market. I also annotated one of the lowest exposure readings ever and you'll note that came right before the bear market bottom.
I have a special announcement regarding sentiment! Mark Young, CMT at WallStreetSentiment.com will be joining me in the free DP Trading Room on February 1st. He will talk to us about highly bullish sentiment and also analyze your symbol requests with me. I hold the free trading room each Monday at noon ET. It's recurring, so you only have to register once to have access every Monday. I demonstrate how I trade using 5-minute candlestick charts and we review stocks that are in the news, as well as your symbol requests, as time permits.

It's Free!
 Mark Young, CMT of WallStreetSentiment.com will be joining me in the free trading room on February 1st! He has all the latest sentiment data and will give his opinion on your symbol requests too!
"Investor sentiment is one of the most powerful forces in the stock market. It can make the difference between selling out at a market low and buying there." -- Mark Young, CMT
***Click here to register for this recurring free DecisionPoint Trading Room on Mondays at Noon ET!***
We didn't hold a 1/18 Trading Room, but did you miss the 1/11 trading room? Here is a link to the recording -- access code: ?H++t+d5
For best results, copy and paste the access code to avoid typos.
I would like to also say that DP Diamonds Report subscribers got the intel early on Home Builders last Tuesday. Our "diamonds in the rough" from Tuesday had an average gain of 14.7%, with the big winner up over 27.5%! If you'd like to try us out for a free week, subscribe to the Bundle of both the Diamonds Report and DP Alert and use the coupon code: dptrialcw
You'll get access to all of our reports since January of last year. You can look at prior Diamonds and review our stance on the market in the DP Alert. We're proud of what we provide and definitely want you to see it. Additionally, I've had many Diamond subscribers tell me that trading a Diamond or two paid for their subscription for the year. A product that can pay for itself is worth a look.
Check out the latest episode of StockCharts TV's Chartwise Women! Mary Ellen and I examine what's driving the rotation into new sectors and how you can take advantage. We also delve into the top industries within these leading sectors as well as individual stocks.
Technical Analysis is a windsock, not a crystal ball.
Have a great weekend!
Happy Charting!
- Erin
erin@decisionpoint.com
Helpful DecisionPoint Links:
DecisionPoint Shared ChartList and DecisionPoint Chart Gallery
Price Momentum Oscillator (PMO)
Swenlin Trading Oscillators (STO-B and STO-V)
For more links, go to DecisionPoint.com!
