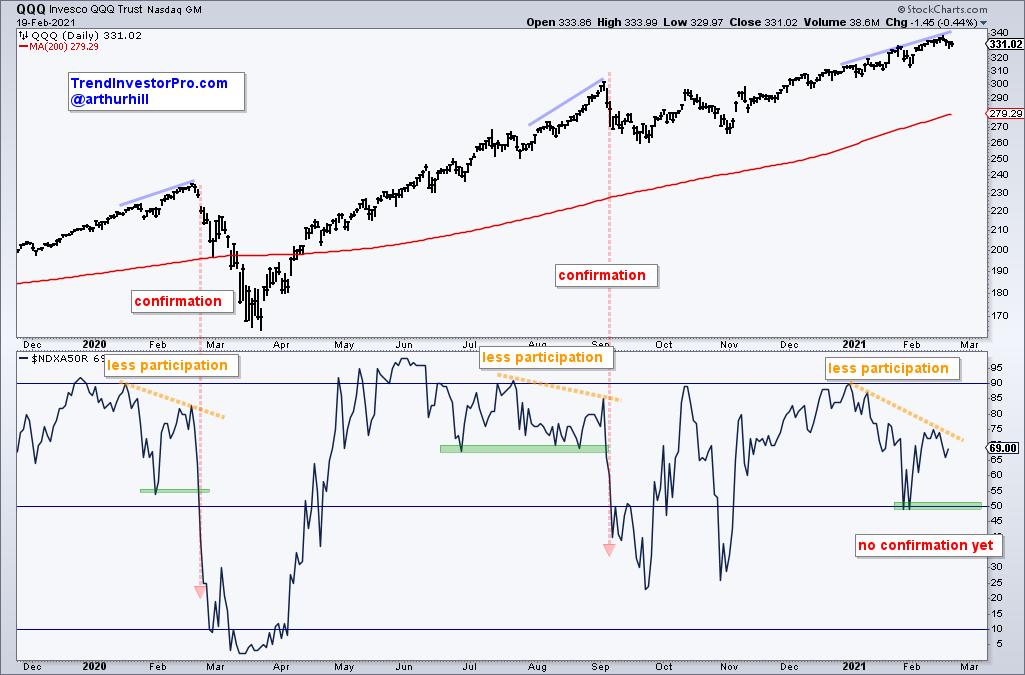
The Nasdaq 100 has been on a tear the last few months with a move to new highs, but a medium-term breadth indicator is not keeping pace here in February. This indicator is simply flashing the yellow caution sign right now and we have yet to see an actual signal that would point to a correction. Here's what to look for.
The chart below shows QQQ in the top window and the percentage of Nasdaq 100 stocks above their 50-day SMA in the lower window. The blue lines show QQQ moving higher, while the yellow dashed lines show participation narrowing in February 2020, early September 2020 and now. This indicator hit 90% in early January and has yet to exceed 75% here in February. Fewer stocks made it back above their 50-day SMAs and this shows some deterioration under the surface.

The trouble starts when the indicator moves from less upside participation to more downside participation (less than 50% of stocks above their 50-day SMAs). The red lines show when the indicator fell below the prior low and below 50% in February 2020 and September 2020. The first signal preceded the March crash and the second preceded the September-October consolidation (corrective period).
Currently, the indicator is flashing a caution signal because fewer stocks are above their 50-day SMAs. The green zone around 50 is the level to watch going forward. A break below the late January lows (~50%) would signal that the majority of stocks broke their 50-day SMAs and this could usher in a corrective period for QQQ.
TrendInvestorPro.com tracks trend signals and mean-reversion setups for a core group of ETFs and adds broad market timing to stay on the right side of the big trend. Click here to subscribe and get immediate access to our ETF Trends, Patterns & Setups report, Broad Market Timing Strategies and Weekend Video.
----------------------------------
Choose a Strategy, Develop a Plan and Follow a Process
Arthur Hill, CMT
Chief Technical Strategist, TrendInvestorPro.com
Author, Define the Trend and Trade the Trend
Want to stay up to date with Arthur's latest market insights?
– Follow @ArthurHill on Twitter
– Subscribe to Art's Charts
