
One of the main characteristics of a Relative Rotation Graph is the "tail," which shows us the sector's trajectory through recent history.
Tails illustrate how the security ended up in the position where it currently is, helping us to view current rotations and create a big picture/high-level overview of how all elements in the universe are behaving against the benchmark and each other. But that tail in itself holds a lot more information that we can use when analyzing/interpreting a Relative Rotation Graph.
Control and Animation
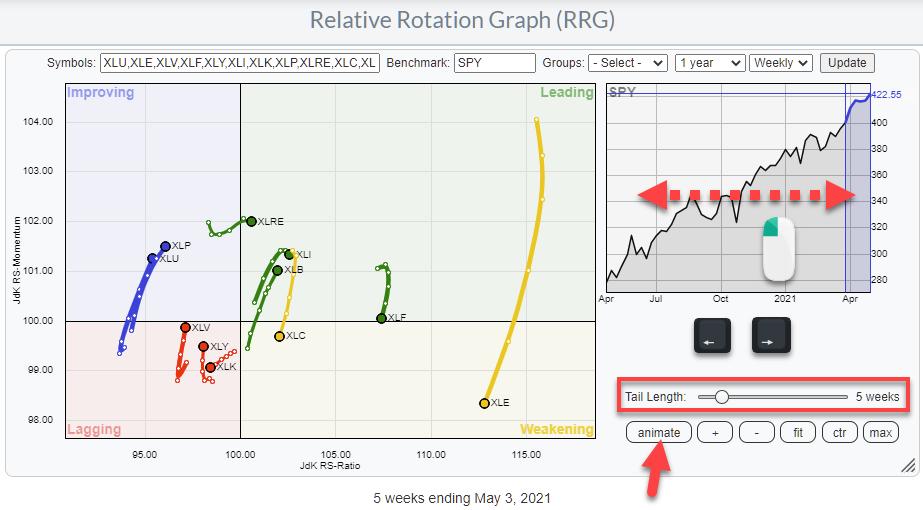
The observations on the canvas of the RRG are the result of plotting the JdK RS-Ratio values on the horizontal axis and the JdK RS-Momentum values on the vertical axis for every security for several historical observations, then "connecting" the dots per sector.
The "Tail length" setting determines the number of historical observations. In the chart above, it is at five weeks. Changing the tail length by dragging the slider only makes more or fewer data points visible; it does not impact the position of those data points. It is NOT a variable, a lookback period, a parameter, etc.
Setting the tail length is purely cosmetic. When you have only a few securities on the RRG, you can use longer tail lengths, as there is enough room for them to be visible. When the RRG is crowded, it is usually better to have shorter tail lengths. I am always trying to find a balance between the number of securities on the graph and the tail length to keep things readable.
The good news is that we can animate the history of the tail so we can still observe longer-term rotations even when we have a crowded RRG. There are three ways you can animate the rotations on the RRG.
- Clicking the animate button, which toggles between animate and pause so you can stop and go again.
- Clicking and holding the left mouse button, then dragging the shaded area in the benchmark chart.
- Using the arrow keys on your keyboard to step through history.
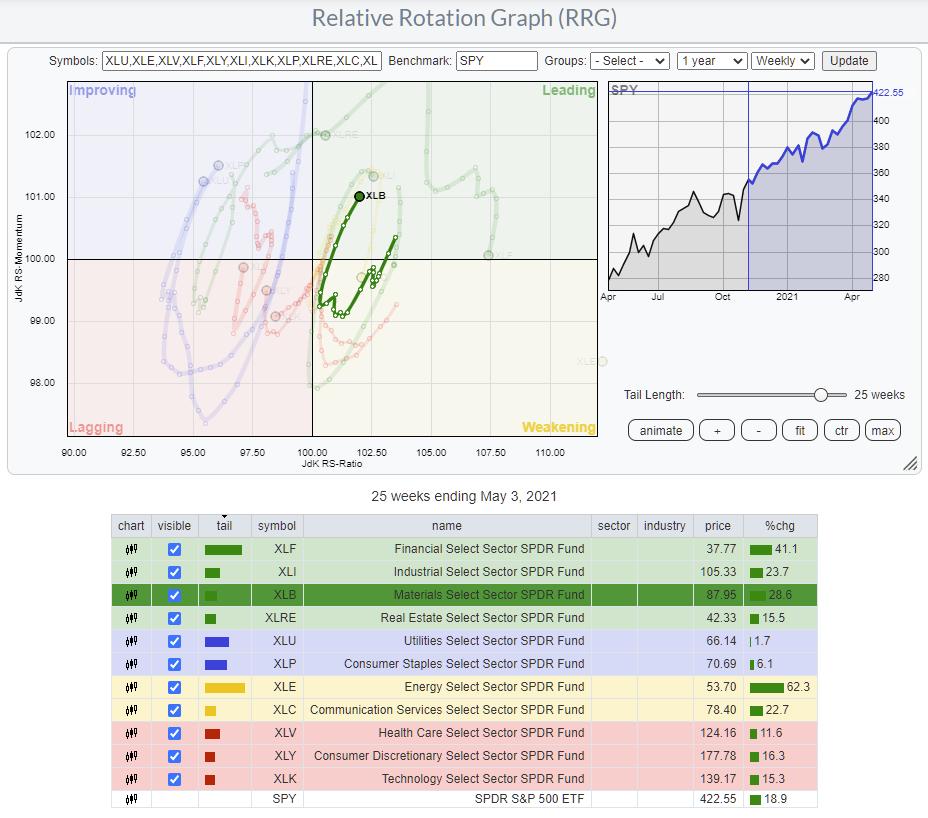
Another handy feature is the possibility of "highlighting" a tail on the RRG.
When you click on a line in the table below the graph, that security will be highlighted while all others are dimmed. This makes the selected security stand out clearly and allows you to study the rotation better.
As you can see, this also allows us to use longer tail lengths without the chart becoming unreadable.
Thickness
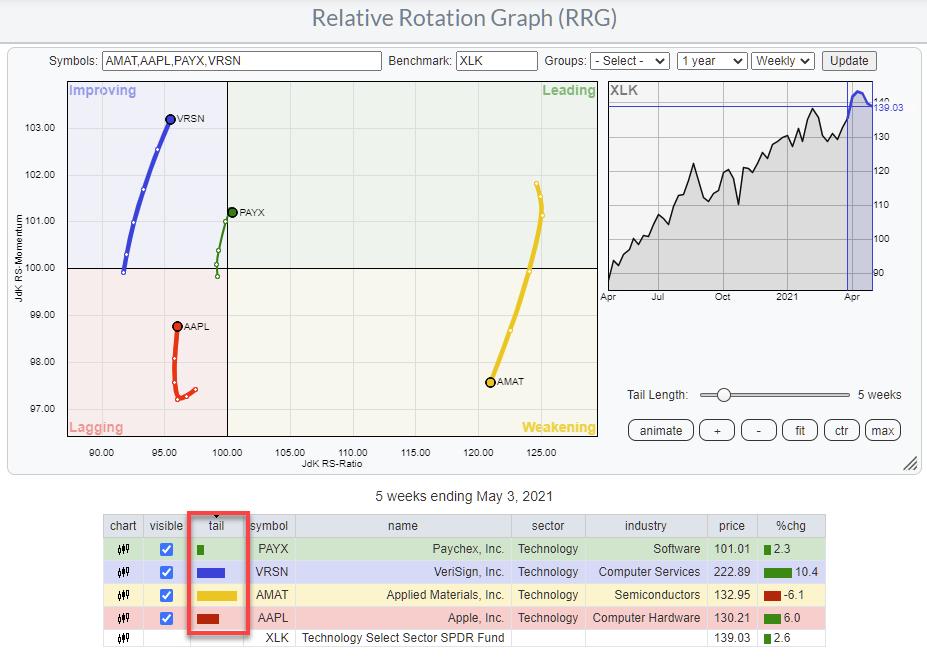
If you watch closely, you may have noticed that the thickness of the tails is not always the same. The further away from the benchmark a tail, or better the last observation on a tail, is, the thicker the tail will be drawn.
In the example above, AMAT, inside the weakening quadrant, is furthest from the center and has the thickest tail. Also, note the bar length in the tail column in the table. The second furthest away is VRSN inside the improving quadrant, then AAPL inside lagging. PAYX, inside the leading quadrant, is closest to the benchmark and has the thinnest tail.
In general, securities that are moving or have moved far away from the benchmark have higher odds of turning around, mean-reverting, and therefore offer bigger opportunities to capture alpha vs. the benchmark.
Tail Length - RRG Velocity
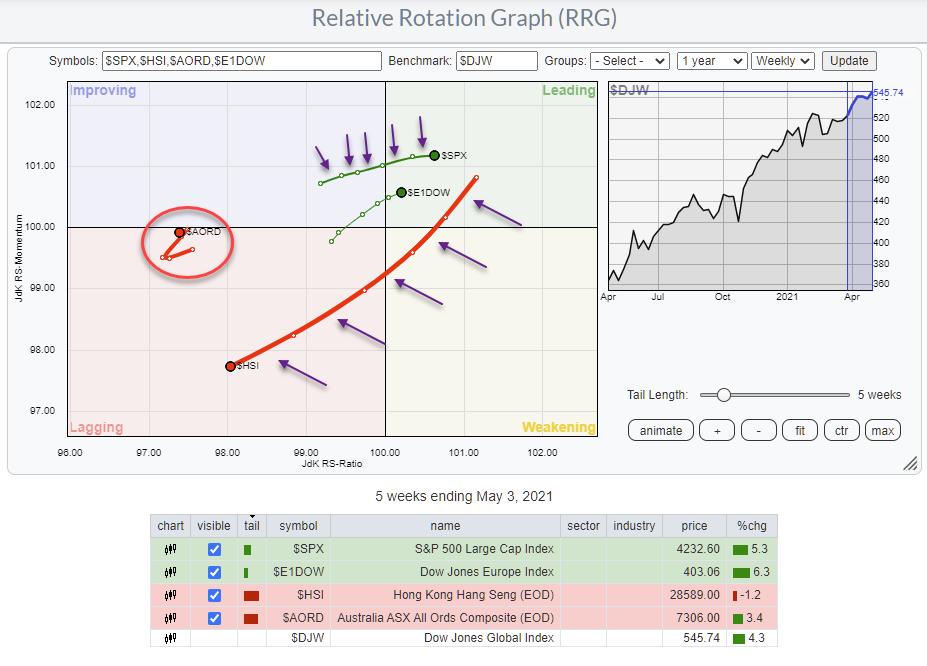
Another important source of information is the "length of the tail on the graph." Not the number of historical observations that are shown as discussed above, but the actual length of the tail on the graph.
On the RRG above, the tail-length setting is at four weeks. So all four stock market indexes show four weeks of the historical rotation. But we can immediately see that the length of the tail for $HSI is much longer than the tail for $AORD.
The (in this case) five-week tail shows five weekly segments (six data points). The distance between two observations is called the RRG-Velocity. The sum of RRG-Velocity values over several periods gives the length of the tail on the graph. A long tail signals a strong move; it shows that there is momentum or power behind the move. A short tail, on the other hand, signals a stable trend.
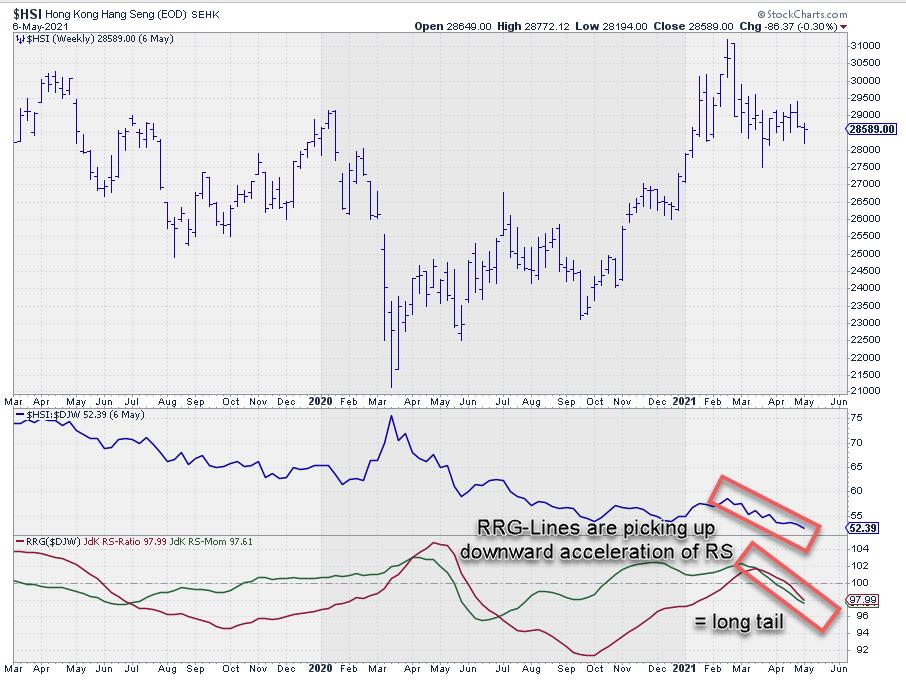

Also, increasing RRG-Velocity -- the sections between observations getting longer -- signals an acceleration of a move/rotation, while decreasing RRG-Velocity signals a slow-down of a rotation.
RRG Heading
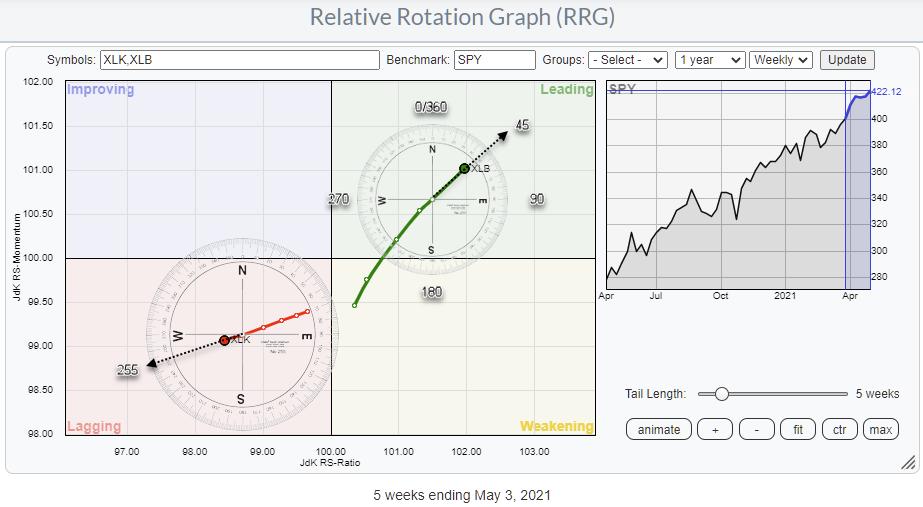
Finally, there is RRG-Heading. This RRG-Heading is a quantification of the direction in which the tail is traveling. The Heading is measured from the previous observation to the current observation using a compass.
On the RRG above, you see two tails; XLB inside the leading quadrant and XLK inside the lagging quadrant. On the XLB tail, I have positioned the compass with its center on the previous observation. Drawing an imaginary line from the center of the compass through the last observation of the tail gives the heading at the intersection with the compass. In this case, it is near 45 degrees. On the XLK tail, the Heading is around 255 degrees.
We have learned that an RRG-heading between 0-90 degrees, in general, is positive and leads to further strength, while headings between 180-270 degrees are a sign of weakness and generally lead to more weakness in the periods ahead. This is conceptually also easy to understand. A heading between 0-90 degrees means that the security is gaining on both axes, while the opposite is true when the heading is between 180-270.
The fact that tails can turn and start moving at or turning into another heading in any of the four quadrants is one of the unique features of Relative Rotation Graphs, which highlights turnaround situations in a very early stage which are very hard or impossible to detect on a regular chart.
If you would like a more visual and animated explanation, please check out the 4/20/21 episode of Sector Spotlight, in which I discuss "The Tale of the Tails."
The Tale of the Tails
#Please Stay Safe, --Julius
My regular blog is the RRG Charts blog. If you would like to receive a notification when a new article is published, "Subscribe" with your email address.
Julius de Kempenaer
Senior Technical Analyst, StockCharts.com
Creator, Relative Rotation Graphs
Founder, RRG Research
Host of: Sector Spotlight
Please find my handles for social media channels under the Bio below.
Feedback, comments or questions are welcome at Juliusdk@stockcharts.com. I cannot promise to respond to each and every message, but I will certainly read them and, where reasonably possible, use the feedback and comments or answer questions.
To discuss RRG with me on S.C.A.N., tag me using the handle Julius_RRG.
RRG, Relative Rotation Graphs, JdK RS-Ratio, and JdK RS-Momentum are registered trademarks of RRG Research.
