In John Murphy's classic text Technical Analysis of the Financial Markets, he explains that one of the three basic assumptions of technical analysis is that prices move in trends. For anyone that has looked at charts for any amount of time, this seems like an obvious truism. The real question is how measure these trends, how we follow them and how we anticipate when the trends are nearing exhaustion.
When I teach technical analysis, I start with Charles Dow's basic definition of trend. Are the highs getting higher? Are the lows getting lower? Just answering those two basic questions on any particular chart will often keep you on the right side of things.
We can also take this trend analysis to the next level, perhaps using moving averages. I often use the 50-day moving average as a simple trend gauge. Is the price above or below this smoothing mechanism? Are the moving averages sloping up or down? Where is price relative to the 50-day moving average?
Let's apply this analysis to the FAANG stocks, starting with the NYSE Fang Plug Index.
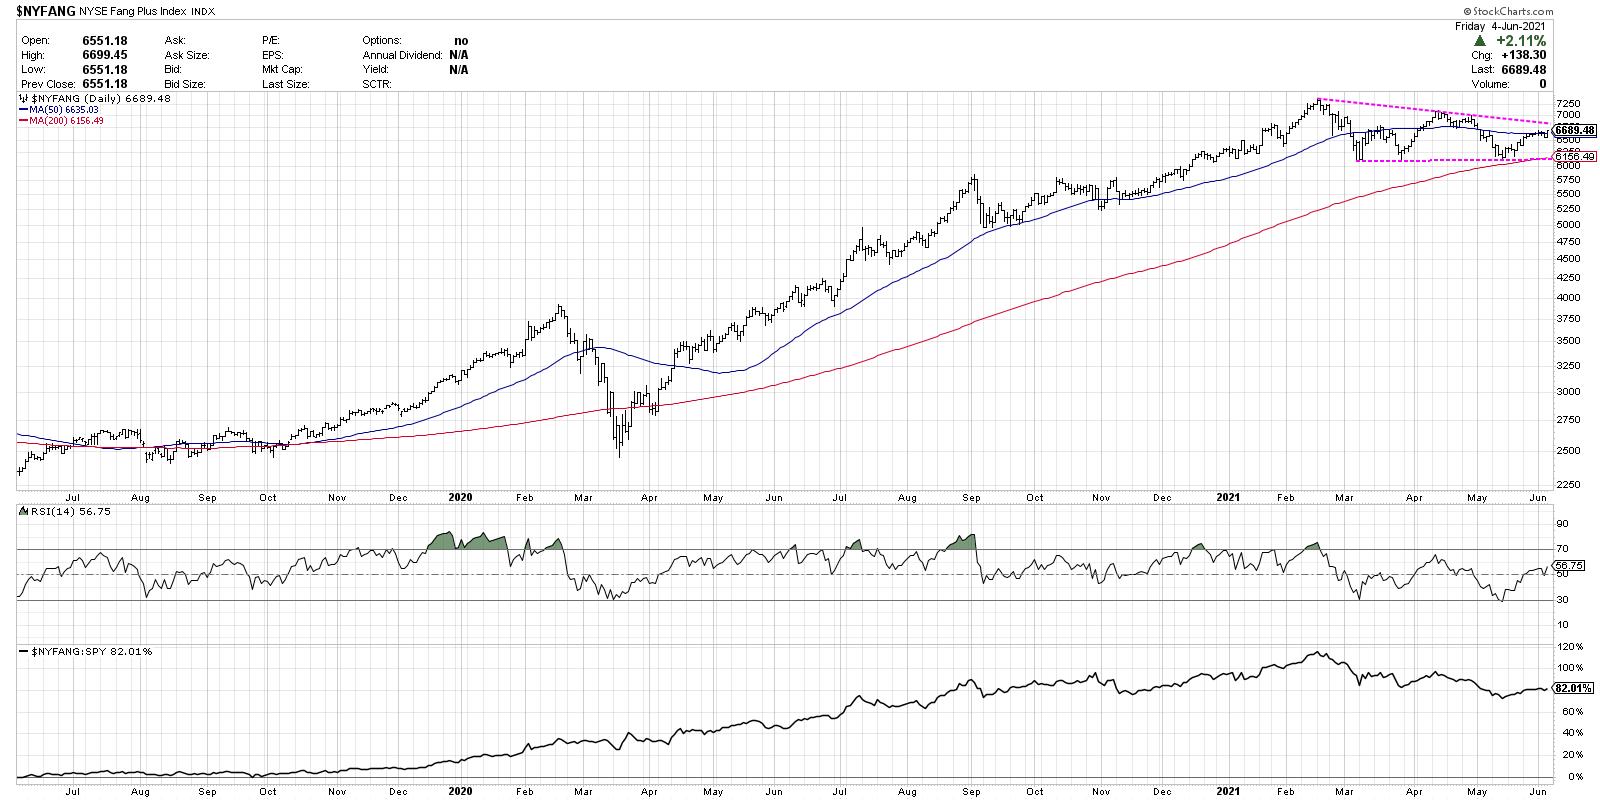
This index is comprised of not just the FAANG stocks (FB, AMZN, AAPL, NFLX and GOOG) but also other "FAANG-like" stocks such as TWTR and TSLA. One look at the chart shows you that this is not in an uptrend, nor in a downtrend, but in the third direction: sideways.
You see, we often group stocks together and create acronyms when they are trading in a similar fashion. So the FANG names were grouped together when mega cap technology, communications and consumer names were all moving higher. Now, we have names like Facebook breaking out to new all-time highs while Tesla is on breakdown watch. Microsoft is back above its 50-day moving average while Amazon has been rangebound for about eight months.
Long story short, the FAANG stocks are no longer trading in unison, but rather are diverging into the "haves" and the "have nots." Therefore, I propose a new group of stocks that 1) are in uptrends according to Charles Dow's classic definition and 2) are trading above their 50-day moving averages.
Presenting the FAME stocks: Facebook (FB), Alphabet (GOOG), Microsoft (MSFT) and eBay (EBAY).
These four stocks represent the same sectors of the FAANG names, but we have basically swapped underperforming members of that group for stronger performers such as MSFT and EBAY.
Let's review the four charts.
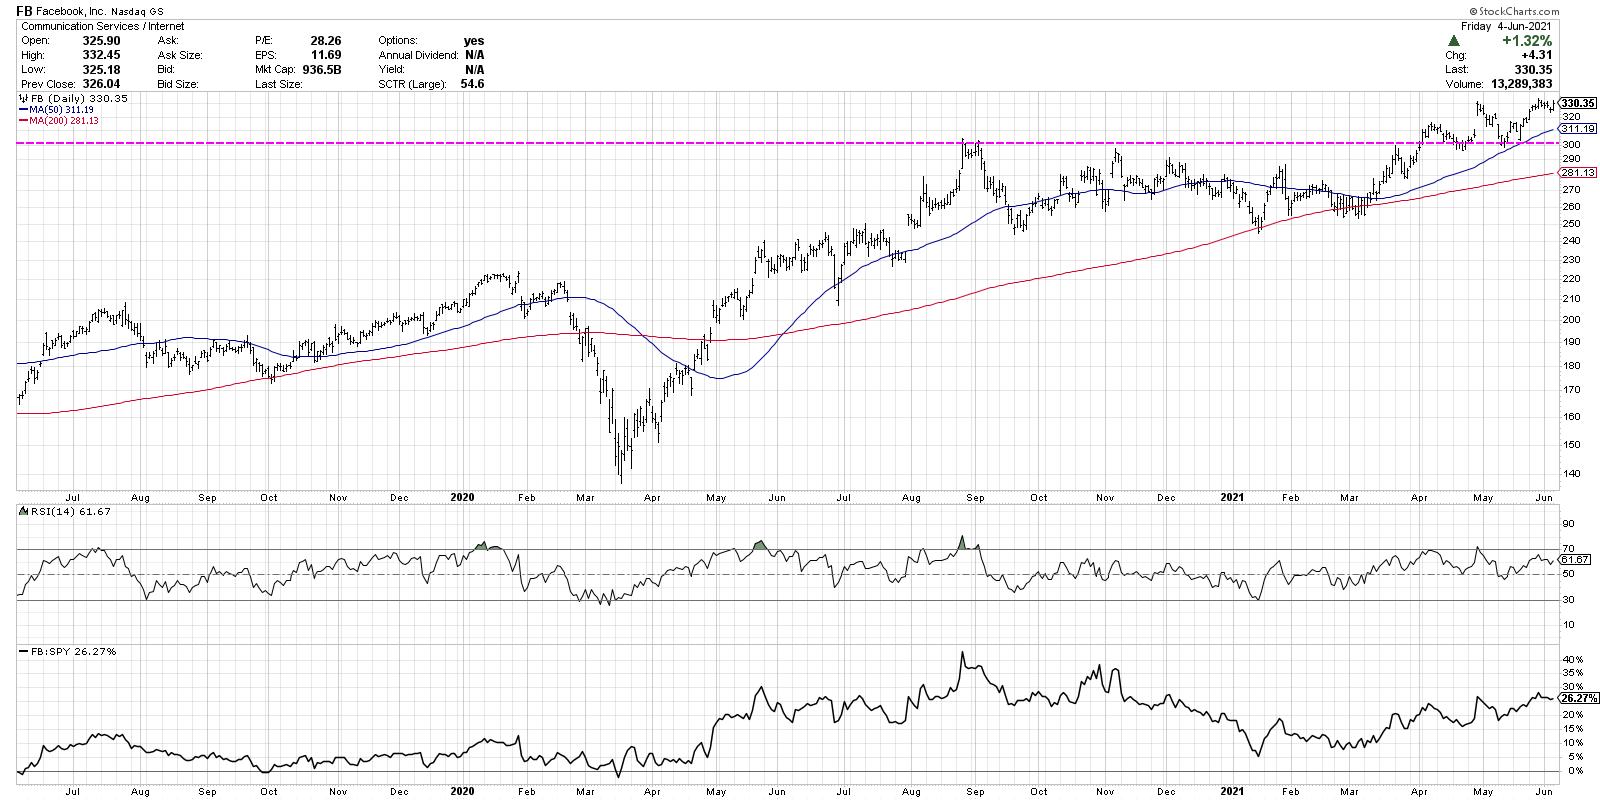
Facebook has arguably the best chart of the bunch, having broken out of a nine-month base in early April followed by a successful retest of support. The stock made new all-time highs again this week, with clear support at the $300 level.
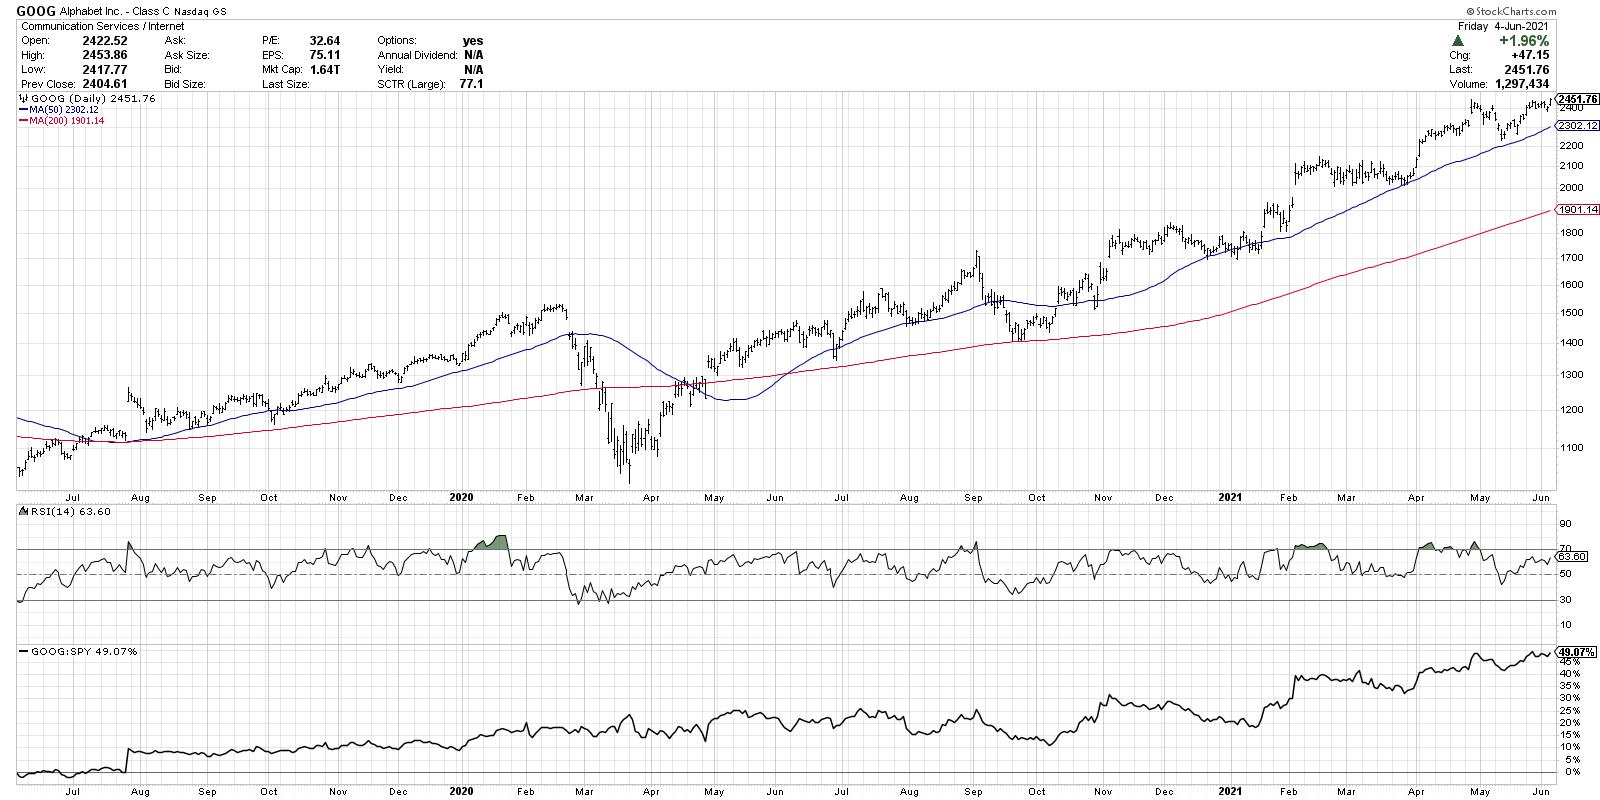
Alphabet has been in a consistent uptrend and provides perhaps the best illustration of the value of the 50-day moving average. Look how often the price has pulled back during the uptrend, right to the 50-day for a "buy on the dips" opportunity.
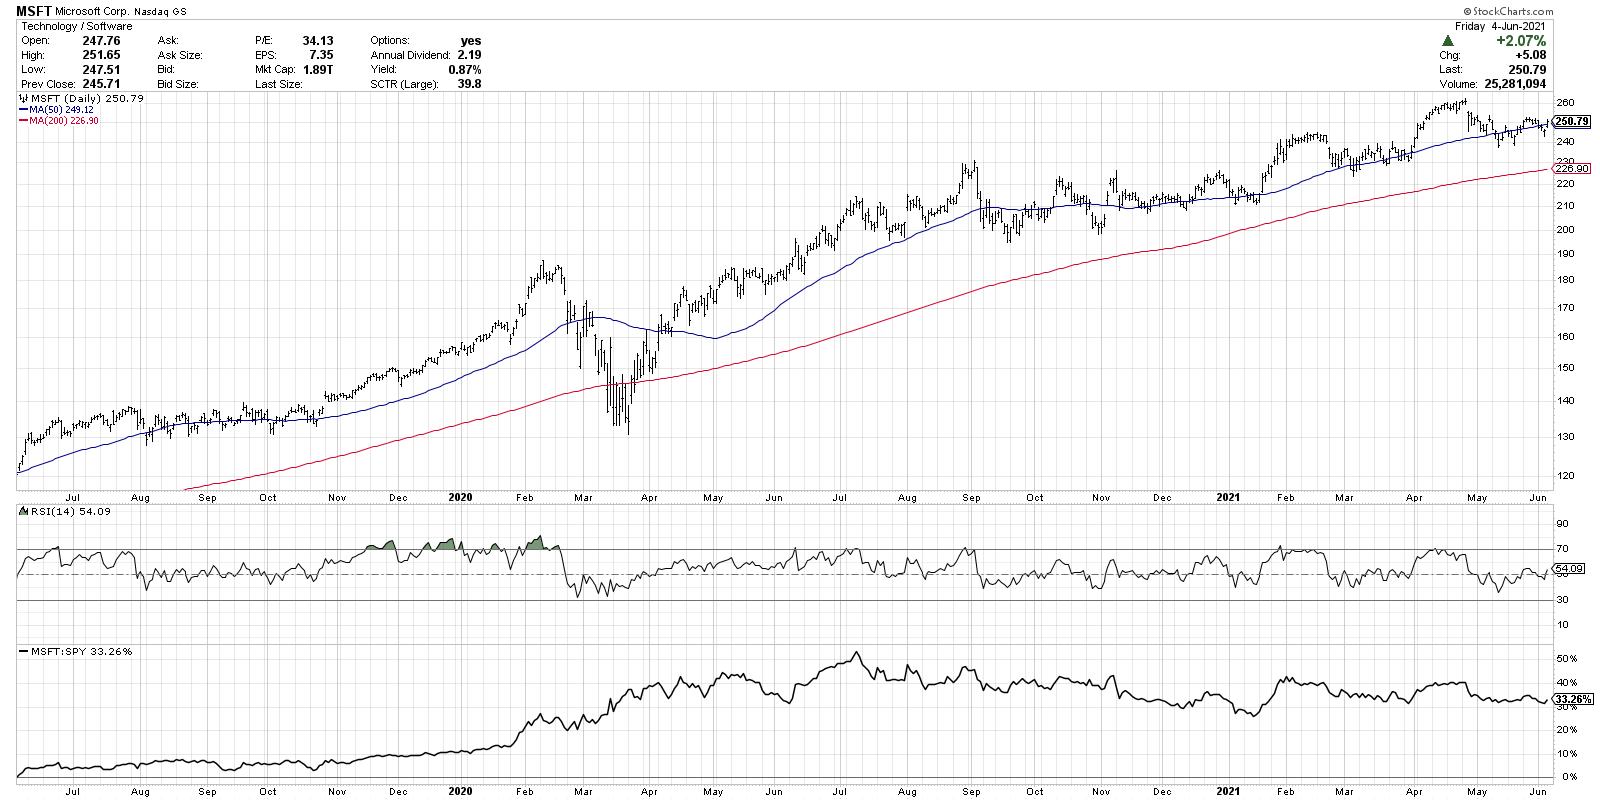
Microsoft is perhaps the most challenged of the four, as it has pulled back from all-time highs reached in mid-April. However, I think this is another example of the 50-day moving average as a gauge of risk, especially since the breakout in January.
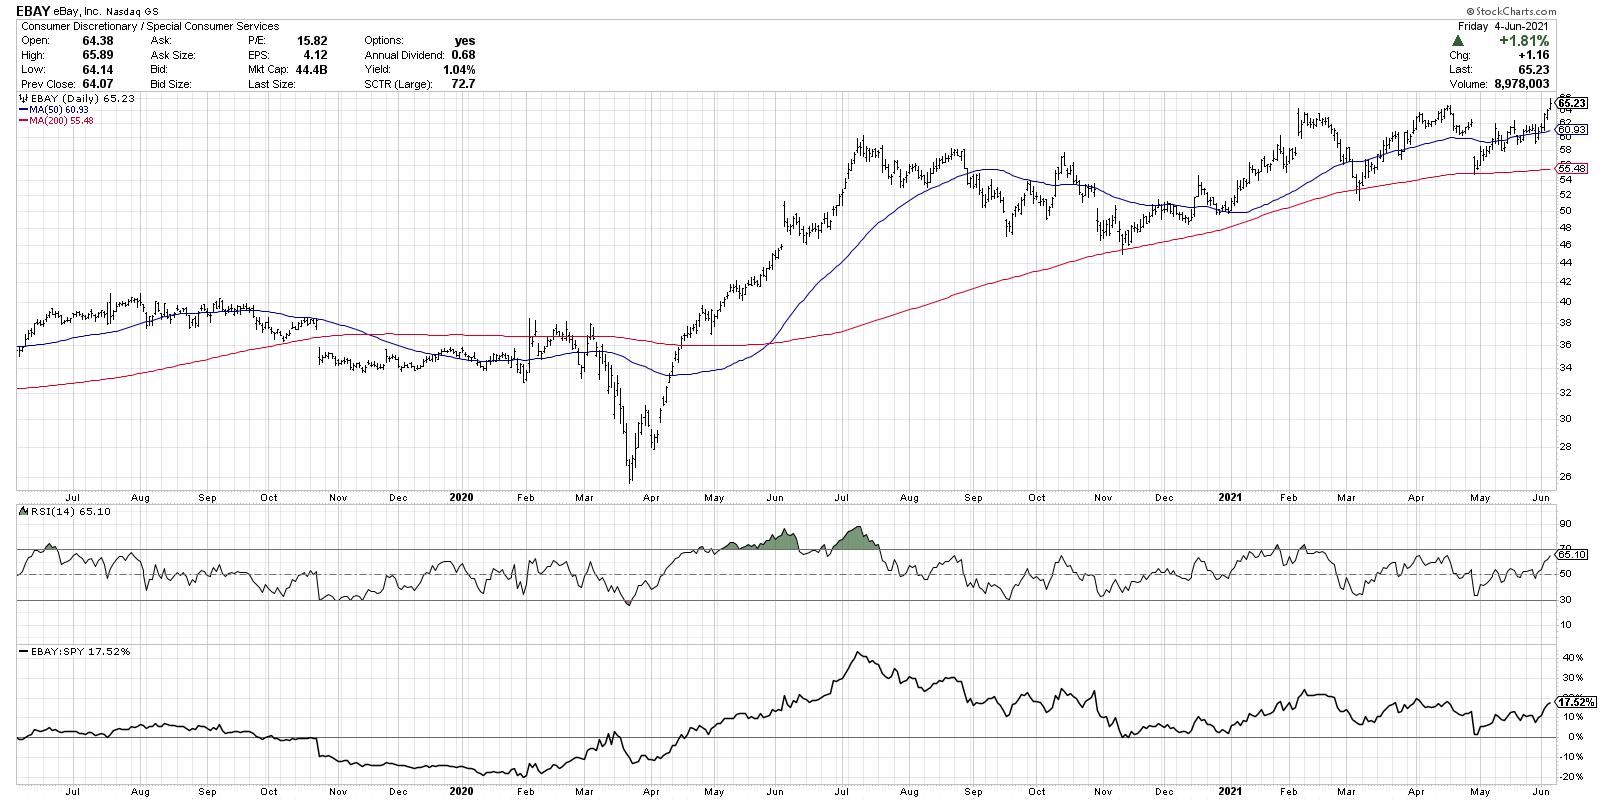
Finally, we have eBay, which is not traditionally grouped with these other names but shows a strong trend profile. EBAY hit the 60 level in July 2020 and spent about six months backing-and-filling to the 200-day moving average before rotating back to the upside.
Friday's rally pushed the stock to another new all-time high and the RSI is not yet overbought. The relative strength on EBAY is less attractive than other names, but the 50- and 200-day moving average certainly could provide support during any pullbacks.
While in years past we followed the FAANG stocks to track leadership in the growth sectors, I would propose the FAME stocks as a better representation of current leadership with upside potential. Most importantly, the 50-day moving average could prove important on all four of these charts, as this popular smoothing mechanism often indicates a level at which institutions are willing to buy short-term weakness and propel the stock to higher highs.
To digest this article in video format, check out my YouTube channel:
RR#6,
Dave
P.S. Ready to upgrade your investment process? Check out my free course on behavioral investing!
David Keller, CMT
Chief Market Strategist
StockCharts.com
Disclaimer: This blog is for educational purposes only and should not be construed as financial advice. The ideas and strategies should never be used without first assessing your own personal and financial situation, or without consulting a financial professional.
The author does not have a position in mentioned securities at the time of publication. Any opinions expressed herein are solely those of the author, and do not in any way represent the views or opinions of any other person or entity.