Markets in healthy uptrends, with improving bullish characteristics, see price breakouts follow through to further upside. Stocks like AAPL and AMZN and PYPL and others break above previous resistance levels and continue to push onward and ever upward.
Except that was not the upside follow through scenario that the markets provided this week, was it?
Earlier this week, I had the pleasure of hosting our latest episode of The Pitch, featuring top ideas from Mark Newton, CMT, Jeff Huge, CMT and Greg Schnell, CMT. They each had the opportunity to highlight five stock ideas and defend their picks using the charts. The only group that was represented in all three of their presentation was the payment processing group, particularly MA, SQ and PYPL.
The chart of PayPal stuck out to me because, while other key names like AAPL and AMZN had already broken above their previous highs, PYPL was actually approaching this key resistance level from below. Would there be enough buying power to push this stock to new highs?
The answer this week was "no"... or at least "not yet."
If I was bullish in the medium term (which I am not), I would be concerned by mega-cap stocks that break out to new highs, only to drop back below the breakout level soon after.
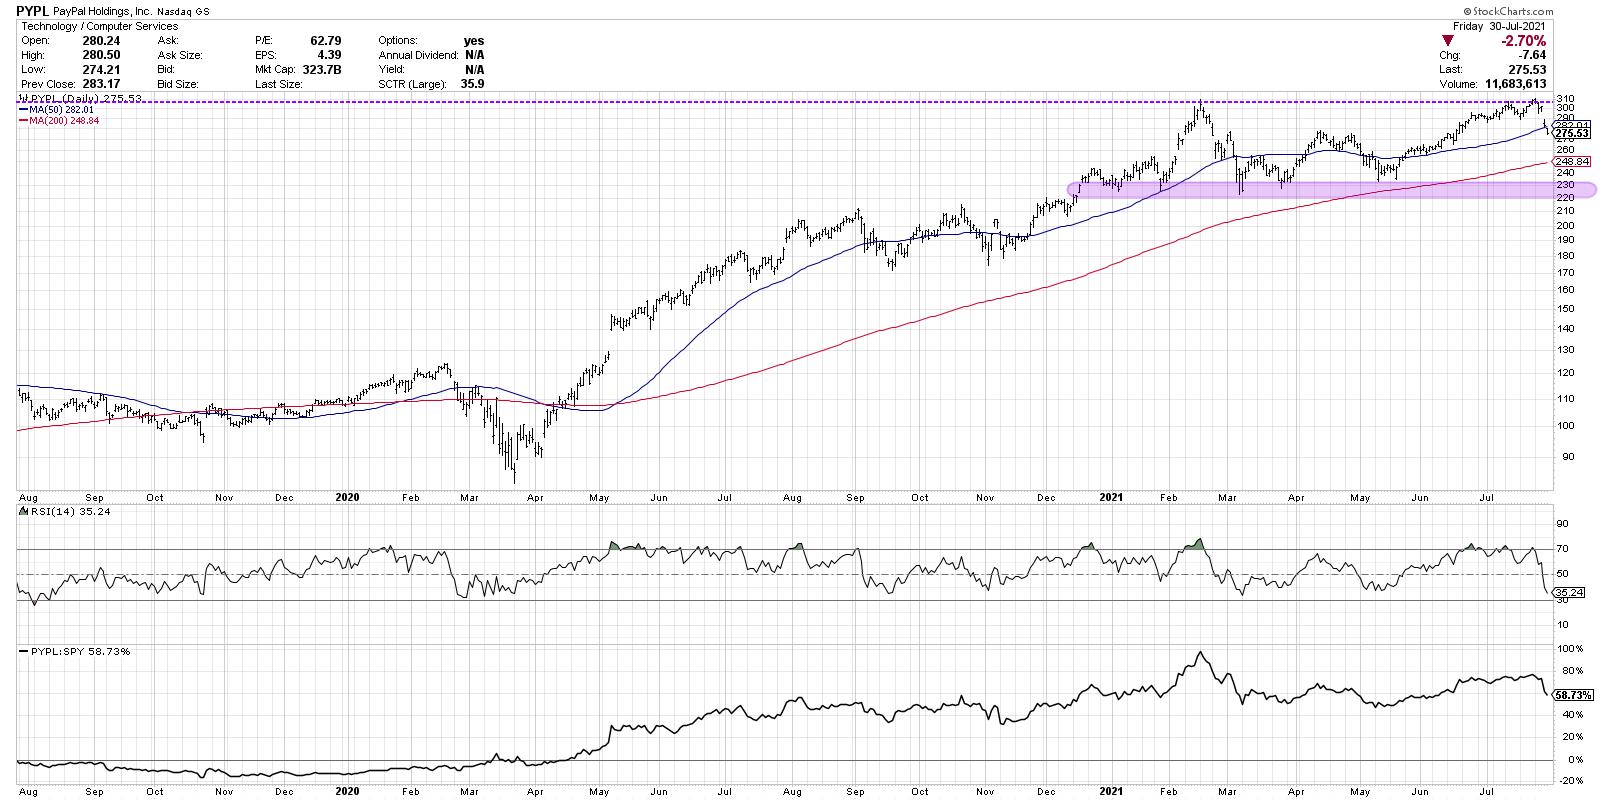
On the chart of PayPal, I would be concerned that, instead of a blowout earnings release propelling the stock to new heights, we saw an underwhelming earnings report that caused the price to top out at $310, almost exactly where it peaked back in February.
Macro thesis aside, what does this pullback mean for PYPL?
I think this chart provides a master class in support and resistance levels. $310 appears to be the ceiling for this name until proven otherwise. If we get a bounce next week, I would assume many PYPL investors will be keyed on this level to determine whether there is upside potential.
It's worth noting that Friday's down day pushed the price below its 50-day moving average for the first time since May. As the S&P 500 has continually found support at its 50-day moving average, it's telling that 44% of S&P 500 members are now below their own 50-day moving averages.
If this week's selloff in PayPal continues into next week, I would focus on two key levels. The 200-day moving average currently lies around $250; further below, we have a consistent support range in the $220-230 area. Remaining above this range would be an important bullet point in the long-term bull thesis for PYPL.
One final observation is that the Fibonacci retracements line up quite well here.
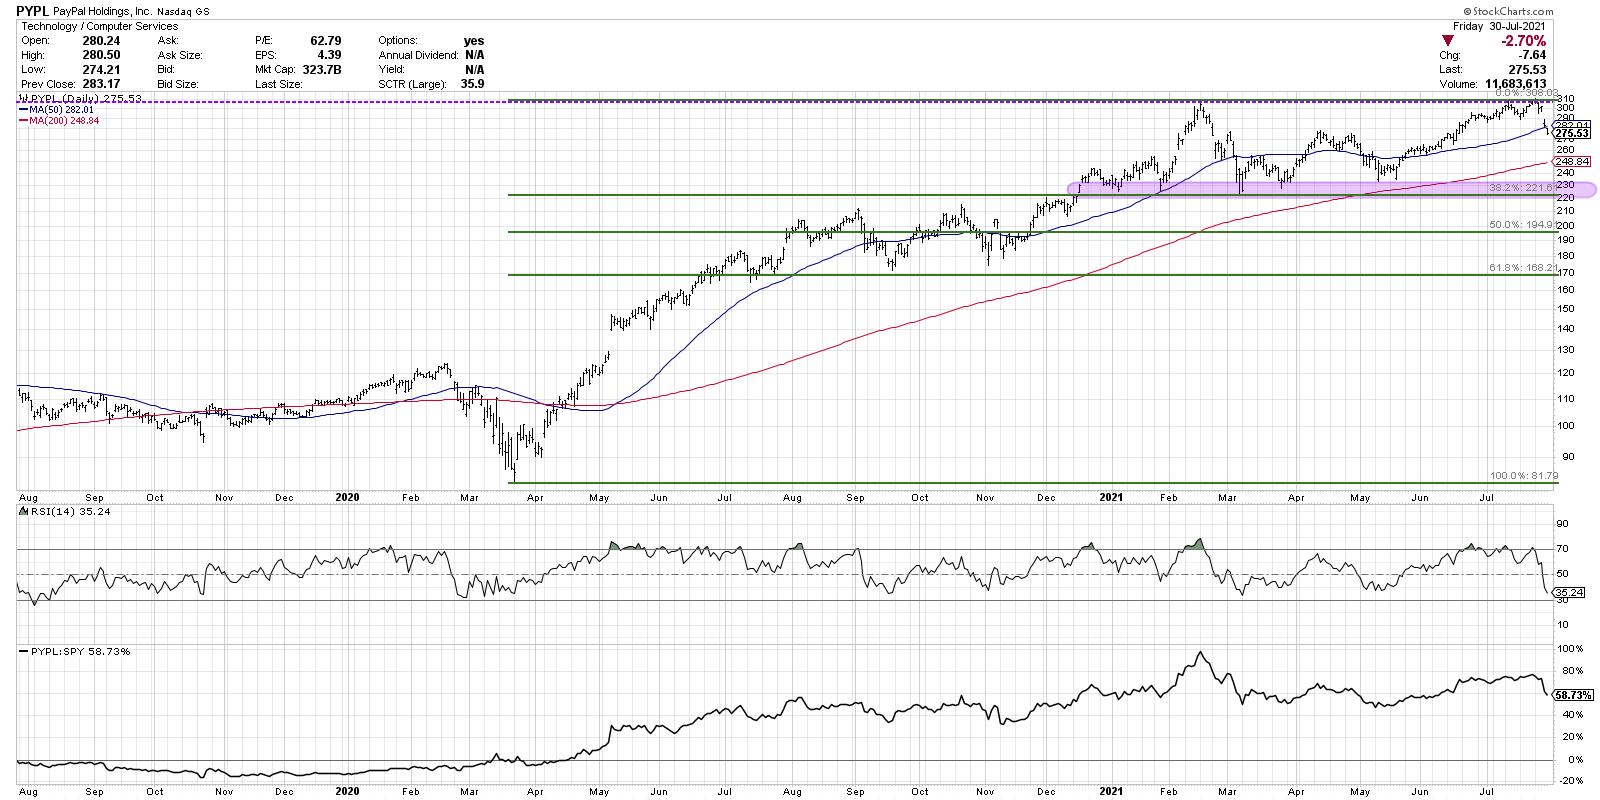
If you use the March 2020 low and the February 2021 high, you'll see that the 38.2% retracement level falls right within the support range indicated. This gives even more validation to the importance of support around 222-225.
As my Market Trend Model remains bearish on the medium-term timeframe, I'm compelled to think more about potential risk than potential return. Stocks like PYPL failing at resistance seem to validate that cautionary thesis.
Want to see digest this article in video format? Just head to my YouTube channel!
RR#6,
Dave
PS- Ready to upgrade your investment process? Check out my free course on behavioral investing!
David Keller, CMT
Chief Market Strategist
StockCharts.com
Disclaimer: This blog is for educational purposes only and should not be construed as financial advice. The ideas and strategies should never be used without first assessing your own personal and financial situation, or without consulting a financial professional.
The author does not have a position in mentioned securities at the time of publication. Any opinions expressed herein are solely those of the author, and do not in any way represent the views or opinions of any other person or entity.