 The AAII indicators are making waves this week so I will cover two charts. AAII percent bears surged to 39.3% and percent bulls dropped to 22.40%. As a result, net bull-bear percentage plunged to -16.90%, the first negative reading since September 2020. Note that the remaining 38.3% are neutral. As a contrarian indicator, this bearish shift points to excessive bearishness that could give way to an advance. Let's look at some actual signals and evidence.
On the chart below, the red lines show when bull-bear net dips below -15% and the green lines show when bull-bear net subsequently exceeds +15%, levels that show modest excess. The November 2019 dip below -15% preceded the stock market plunge in December 2019 and the February 2017 dip preceded a correction the next six weeks. Not very contrarian.
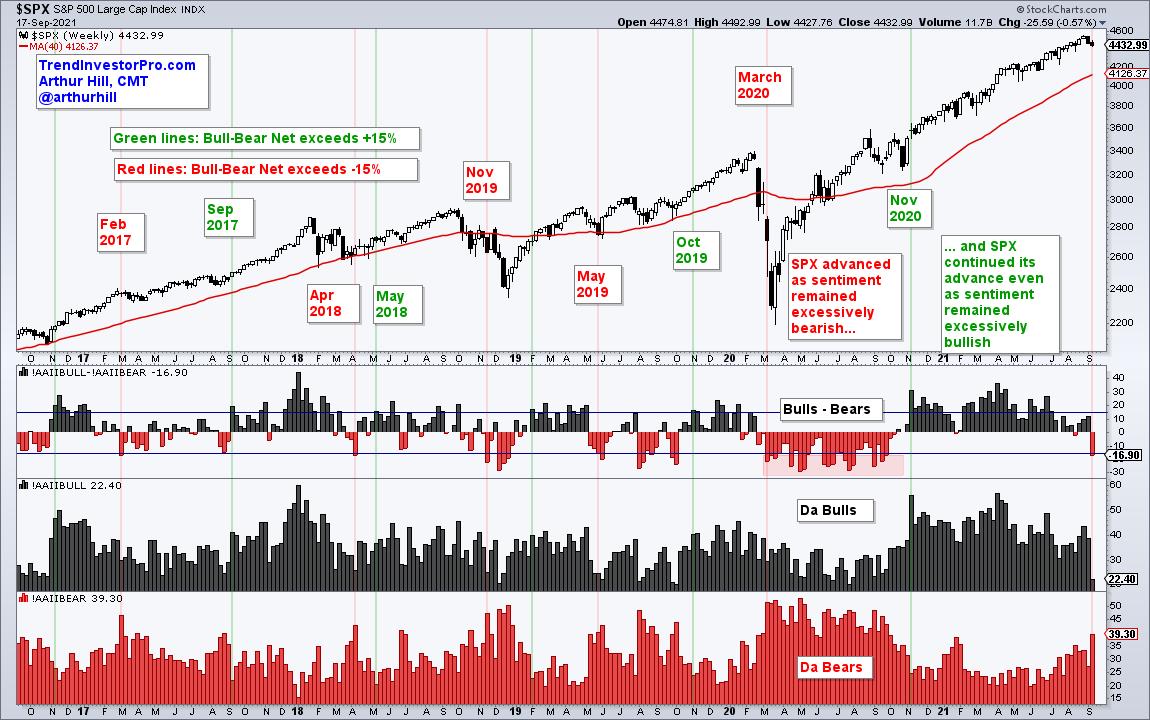
On the flipside, the April 2018 and May 2019 dips below -15% marked lows in the S&P 500 and foreshadowed significant advances. Bull-bear net dipped below -15% in the middle of the covid crash and stayed excessive as the S&P 500 rallied from late March to August. The results are mixed overall, but I would give a slight edge to the bullish signals based on excessively bearish sentiment.
Signs of excessive bullishness (> 15%), however, seem to be more bullish than bearish. Note that "excessive" bullishness kicked off big advances in September 2017, May 2018, October 2019 and November 2020. Yep, you read right. The S&P 500 rallied when bull-bear net reversed its prior signal and exceeded 15% (green lines). Clearly, chartists should not consider signs of excessively bullish sentiment as a bearish signal for the S&P 500.
Sentiment aside, TrendInvestorPro specializes in trend identification and finding short-term bullish setups within the bigger uptrend. Using StochClose, the Momentum Composite, RSI and classic pattern analysis, we monitor a core ETF list with over 120 names to bring you trend signals and mean-reversion setups. Click here to take your analysis process to the next level.
*****************************
Choose a Strategy, Develop a Plan and Follow a Process
Arthur Hill, CMT
Chief Technical Strategist, TrendInvestorPro.com
Author, Define the Trend and Trade the Trend
Want to stay up to date with Arthur's latest market insights?
– Follow @ArthurHill on Twitter
– Subscribe to Art's Charts
