Climax analysis is something unique to DecisionPoint and we've found that "climax days" are highly accurate in determining market bottoms and tops in the very short term.
A climax is a one-day event when market action generates very high readings in (primarily) breadth and volume indicators. We also include the VIX, watching for it to penetrate outside the Bollinger Band envelope. The vertical dotted lines mark climax days -- red for downside climaxes and green for upside. Climaxes are either initiation or exhaustion.

Click here to register in advance for the recurring free DecisionPoint Trading Room! Recordings are available!
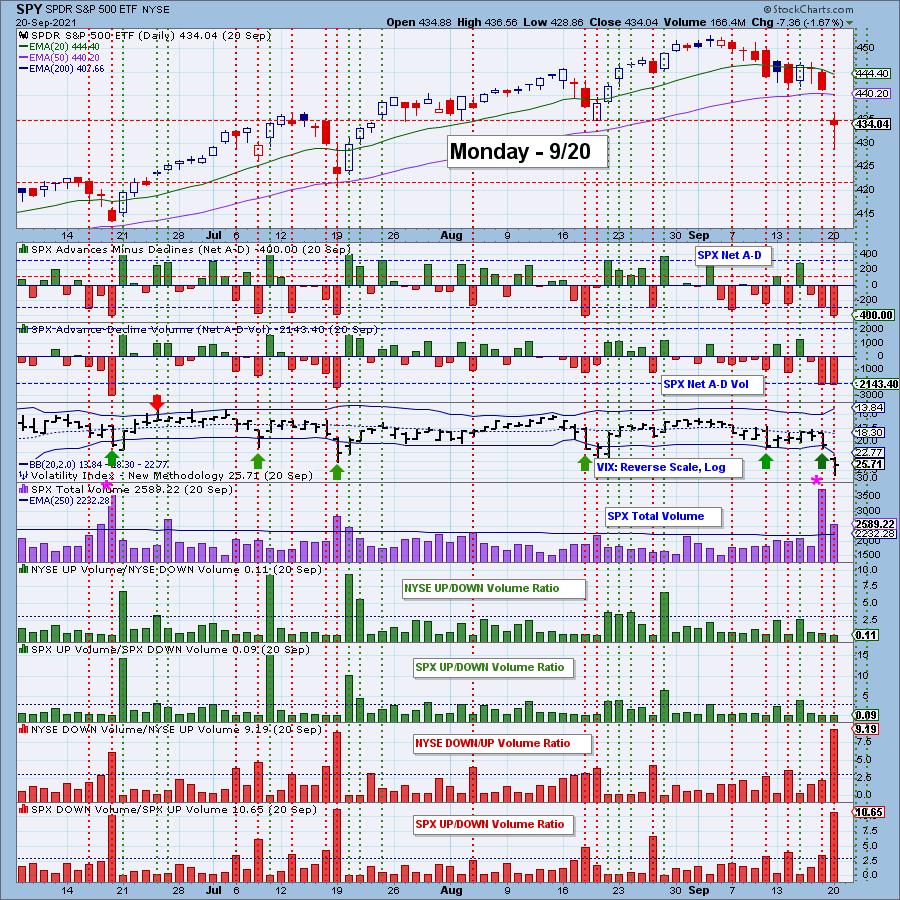
Let's go back in time and look at Monday's climax chart. Monday's climax was a clear exhaustion climax. Price had been tumbling lower after reaching all-time highs. It was a frantic day of selling and a gap down on Monday. We saw a puncture of the lower Bollinger Band by the VIX on the inverted scale; another clear indication this was a selling exhaustion.
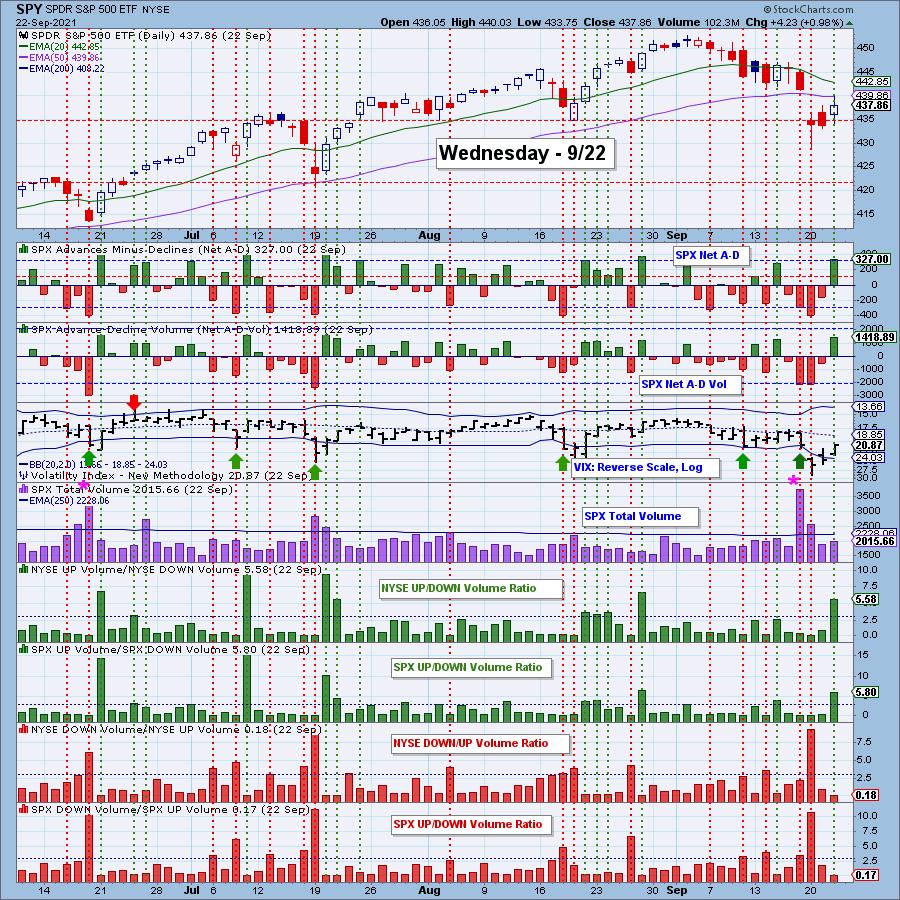
Two days later, on Wednesday, we saw an upside initiation climax. Earmarks of an initiation: they generally arrive right after exhaustions and they suggest follow-through in the direction of the climax.
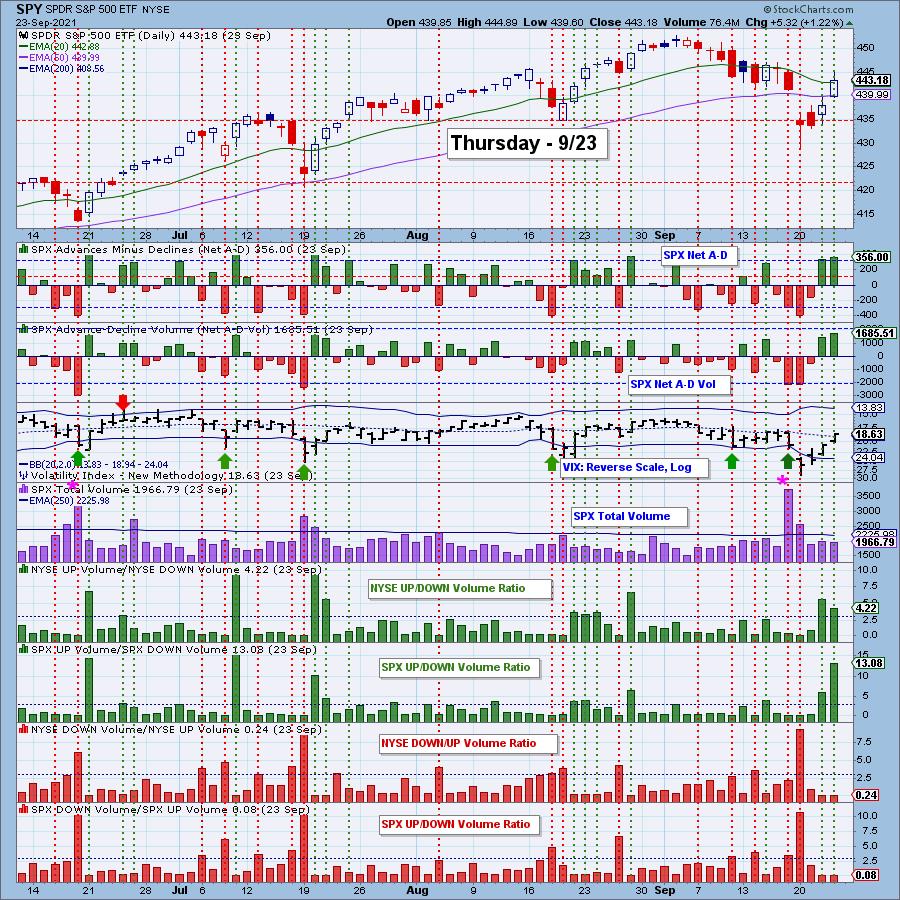
Yesterday's upside climax was considered an "exhaustion" as it arrived after an initiation. We told our readers that while it was an exhaustion, we were expecting "churn," not a big decline.
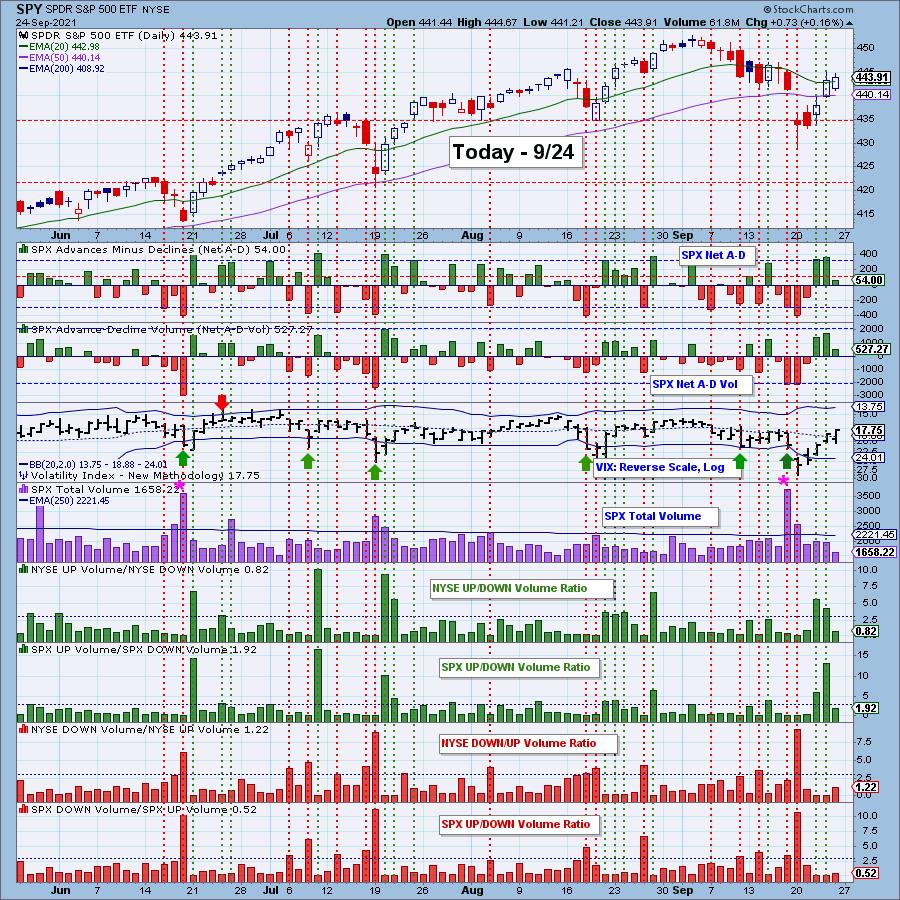
Here is today's climax chart. We didn't see any climactic behavior.
Conclusion: The downside exhaustion climax on Monday was over two weeks from the price high at the beginning of this month, which set the market up for the current rally. The closing price low was on Tuesday and, on Wednesday, we got an upside initiation climax followed immediately by an upside exhaustion climax. Exhaustion climaxes can signal the end of a move or a pause. When they come so soon after the price low as Thursday's did, we tend to expect the more bullish outcome.
There are two things that favor a continuation of the rally: (1) the fact that it began with an initiation climax and (2) that internals were so oversold at the start. Both of these are short-term elements and we will need to see intermediate-term indicators begin to show more improvement. The problem is that the big tech stocks are not coming to life and, while they supported the market as the smaller-cap stocks swooned, they may now be a drag on the market as the smaller-cap stocks attempt to revive.
Be alerted to downside and upside climaxes!
Subscribe to the DP Alert. It is a must-read that you can read in less than 10 minutes. Get coverage of Bitcoin, Yields, Bonds, Dollar, Gold, Gold Miners, Crude Oil and sector rotation. It's invaluable at an incredibly low price of $35/month! Get the best technical analysis for less!
Technical Analysis is a windsock, not a crystal ball.
--Carl & Erin Swenlin
(c) Copyright 2021 DecisionPoint.com
DecisionPoint is not a registered investment advisor. Investment and trading decisions are solely your responsibility. DecisionPoint newsletters, blogs or website materials should NOT be interpreted as a recommendation or solicitation to buy or sell any security or to take any specific action.

Try us out!
Have access to our archived reports going back to 2019.
Subscribe to our "Bundle Package"
Use Coupon Code: DPTRIAL at checkout to receive one free week!
Helpful DecisionPoint Links:
DecisionPoint Alert Chart List
DecisionPoint Golden Cross/Silver Cross Index Chart List
DecisionPoint Sector Chart List
Price Momentum Oscillator (PMO)
Swenlin Trading Oscillators (STO-B and STO-V)

