 Stocks surged for the second Thursday in as many weeks, but this Thursday's surge was a lot different than the previous week. This week's surge featured a strong open and strong close as well as the strongest breadth in four months. What does it mean going forward? Let's investigate.
First and foremost, the long-term trend is up for the S&P 500 SPDR (SPY). The ETF hit a new high in early September and remains well above the rising 200-day SMA. The 50-day SMA (green dashed line) is also above the 200-day.
The chart below shows SPY correcting with a falling wedge and attempting a breakout the previous Thursday (yellow arrow). However, SPY closed near the low of the day and fell the next three days. There was no follow through to the opening gap and breadth was not strong.
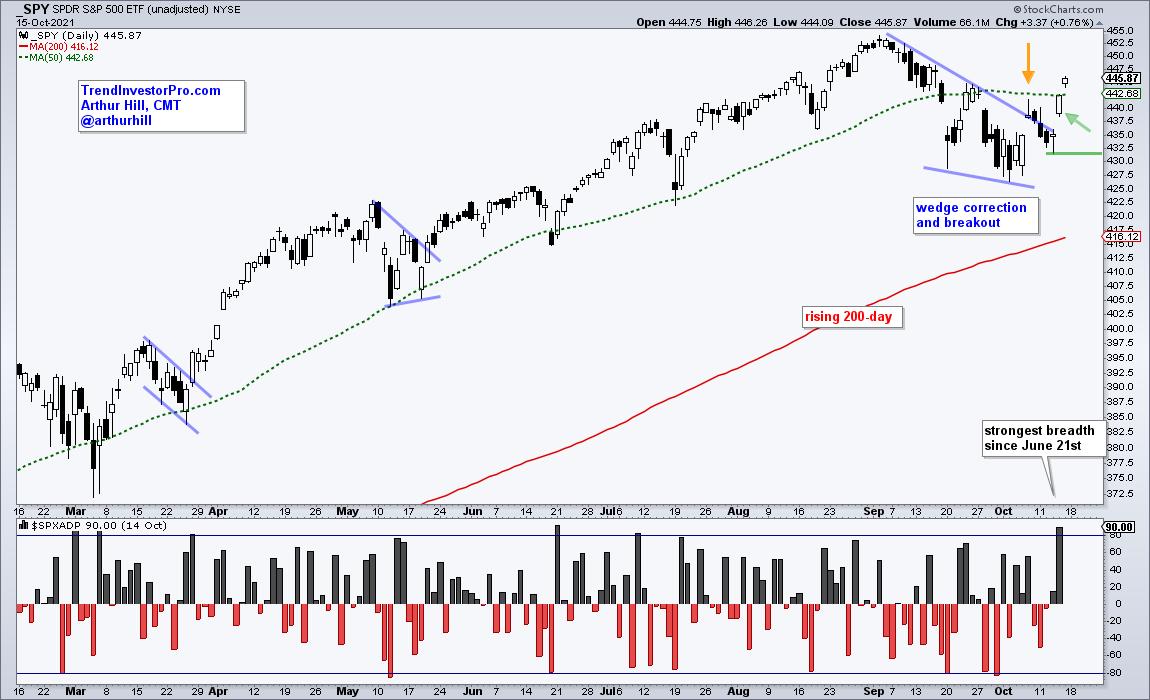
SPY repeated the opening gap this Thursday and the result was different. Instead of closing near the low, SPY continued higher after the open and closed near the high. Follow through after the gap shows strength and validates the breakout, as does strong breadth.
The indicator window shows S&P 500 Advance-Decline Percent, which is advances less declines divided by total issues. 475 stocks in the S&P 500 advanced on Thursday and only 25 declined. As such, Advance-Decline Percent surged to +90% and hit its highest level since June 21st. This participation pop further validates the breakout.
Looking for more bullish signals and setups? TrendInvestorPro specializes in broad market timing, trend identification for ETFs and finding bullish setups within the bigger uptrend. Click here to subscribe.
--------------------------------------------------
Choose a Strategy, Develop a Plan and Follow a Process
Arthur Hill, CMT
Chief Technical Strategist, TrendInvestorPro.com
Author, Define the Trend and Trade the Trend
Want to stay up to date with Arthur's latest market insights?
– Follow @ArthurHill on Twitter
