The two crucial elements of a Relative Rotation Graph (RRG) are the "universe" and the "benchmark".
The Benchmark
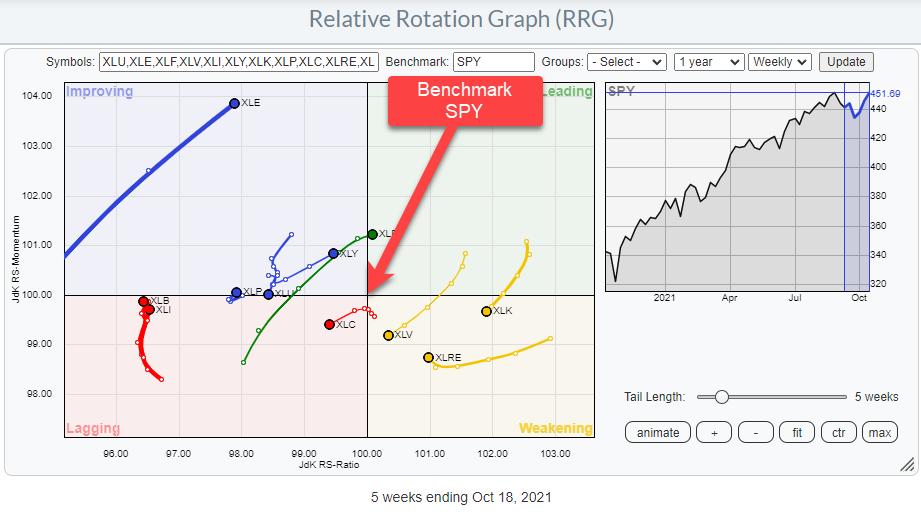
The benchmark for a Relative Rotation Graph is the common denominator for all securities that are present in the universe. Theoretically, the benchmark can be any index or security but usually, and most useful, it is an index or security that has a relation with the securities in the universe.
On the RRG that shows the 11 sectors for the S&P 500 for example, it is clear that the S&P500 index is the obvious benchmark for that security.
For stocks in a specific sector, you can opt for the S&P 500 as the benchmark or the sector index to which those stocks belong. The results on the graph can be quite different.
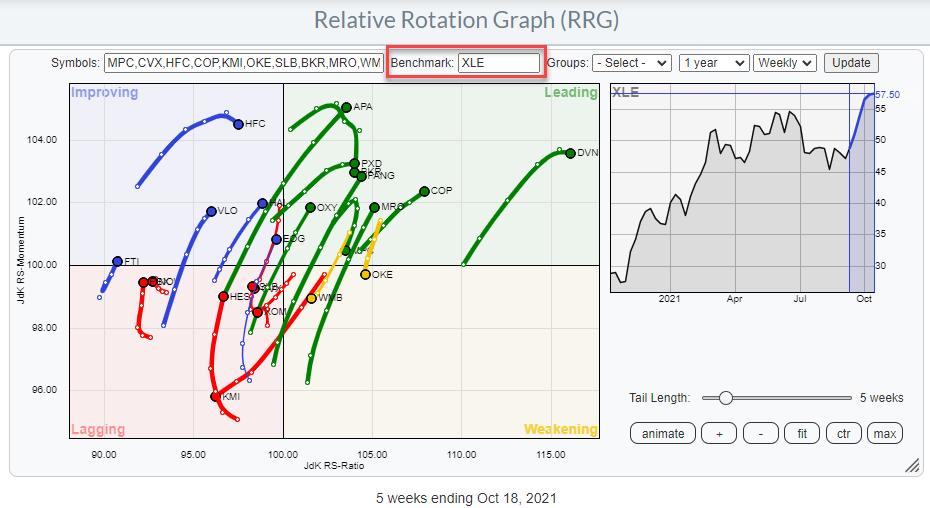
Take for example the Energy sector. The RRG below shows all the stocks inside the energy sector with XLE, the ETF that tracks the Energy Sector Index, as the benchmark.
When we change the benchmark from XLE to SPY we get the RRG below
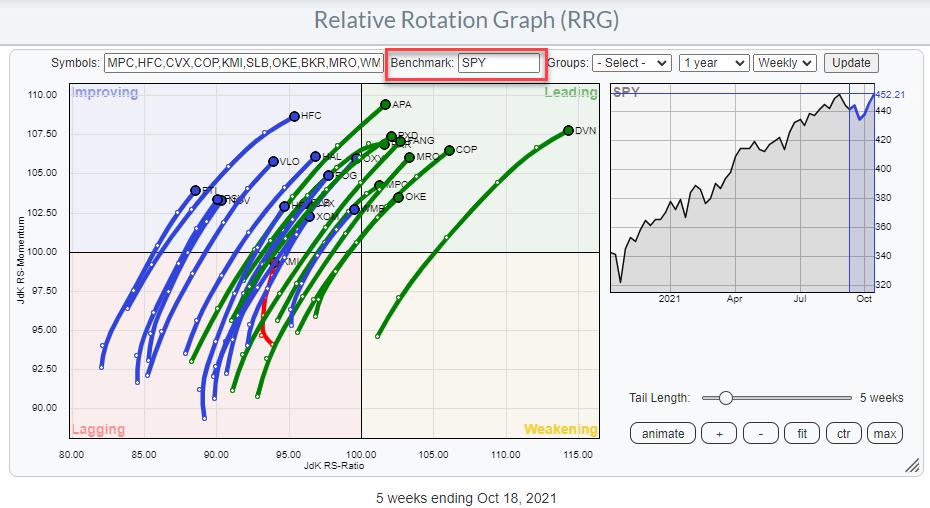
Needless to say that these two RRGs look quite different just by changing the benchmark.
For a group of indexes or securities that represent different asset classes, one could look for an index that combines performances of different asset classes.
Especially for currencies, the benchmark is a tricky one, because currencies are always already a relative expression. $EURUSD is EURos expressed in USDollars. $USDJPY is USDollars expressed in Japanese Yen. The problem here is clear. When the USD gets stronger $EURUSD will drop while $USDJPY will rise.
Hence in order to get a proper picture, when evaluating currencies on an RRG, all currency pairs in the universe should hold the same denominator. It does not matter which currency you choose as the base currency as long as it is the same for all pairs on the graph. Probably wises thing to do is make the currency of your portfolio or bank account the base currency of the RRG.
Because of the fact that all elements in the universe are already expressed as relative, we need a special benchmark. This is ticker symbol $ONE. This is a price series that is always 1.
This article here explains the working of a currency rotation graph more in-depth.
Another use of $ONE can be to take the relative effect out of a relative rotation graph and look at absolute price movements for a group of securities. The result here will be that a group of related securities will most likely all move in the same direction instead of being scattered around the plot when looking from a relative perspective.
The universe
The universe is the group of securities that will be plotted on the canvas of the RRG. This can literally be any group of securities.
Best known is the RRG that shows the 11 sectors that make up the S&P 500 index. But an RRG can also show a universe of individual stocks, (crypto-)currencies, country indexes, bonds, asset class indexes, etc. And any combination of all of the above.
The only thing that you need to keep in mind, or be careful with, is when you are working with data series that contain yields. The problem with yields is that they move inversely with price. So combining price-based series with yield-based series will be confusing.
Understanding the universe that you are working with is important to understand and interpret the resulting Relative Rotation Graph.
CLOSED Universe
The RRG of the 11 sectors against SPY and the stocks in the Energy sector against XLE are so-called "closed universes". But also the RRG of the 30 stocks in the DJ Industrials index is a closed universe.
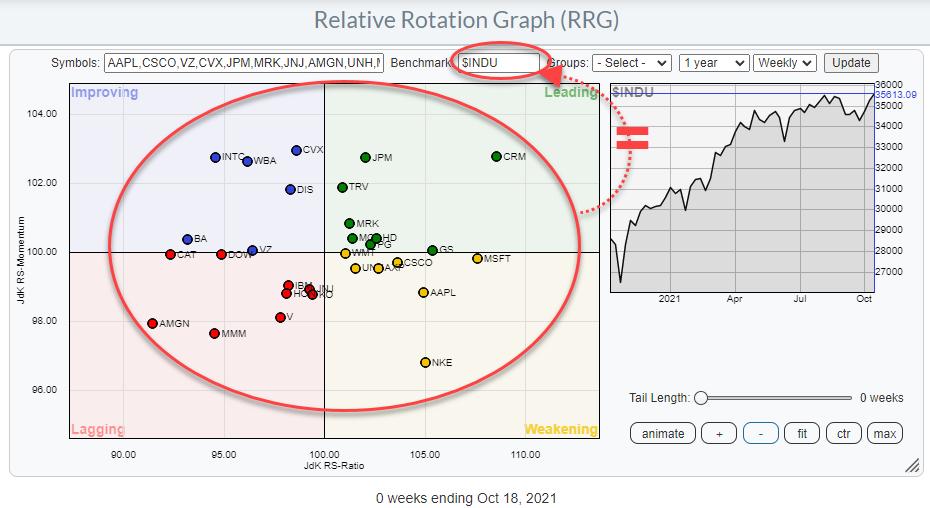
A closed universe is a universe in which the benchmark holds exactly the same securities as the universe.
OPEN Universe
An open universe is a universe that holds a group of securities that is not (exactly) the same as the benchmark to which the securities are compared on the RRG.
For open universes there are three options:
Extended
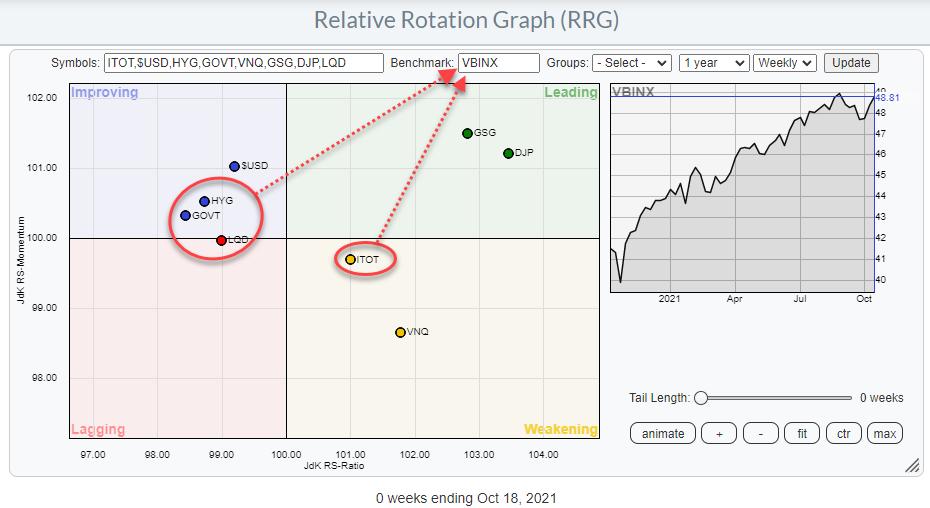
This is a universe that holds all members of the benchmark index plus some securities that are not included in that benchmark. An example of an extended universe is the universe I always use for asset allocation in my blogs. It uses the VBINX fund as the benchmark. This is a balanced index fund comprised of 60% equities and 40% bonds. But on the RRG are also commodities, real estate, and the USD (cash).
Partial
This is a universe that is a subset of the benchmark to which it is compared. For example, the members of a sector compared to an overall market index. ie all stocks in the Energy sector compared to the S&P 500 as shown again below
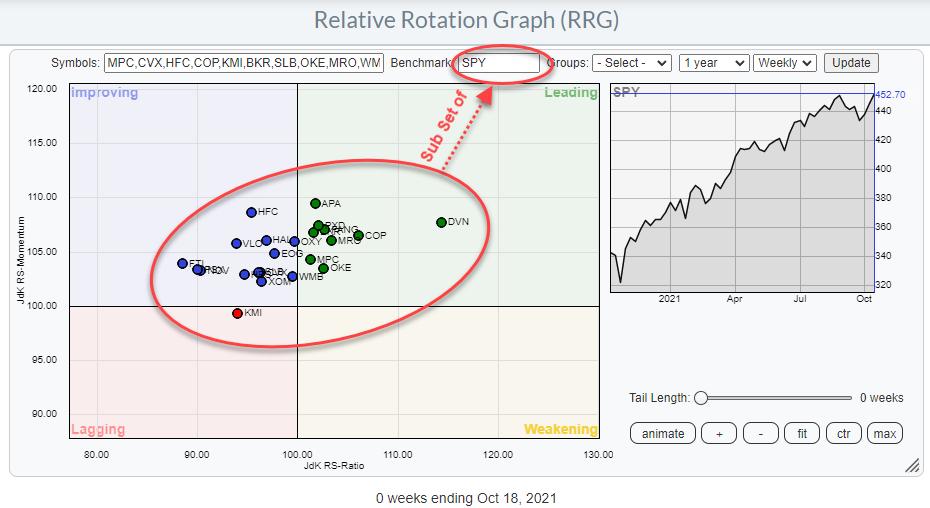
The stocks on the graph are all in the S&P 500 index but there are many more stocks in that index as well so the Energy stocks are only a part of the group represented by the benchmark.
Mixed
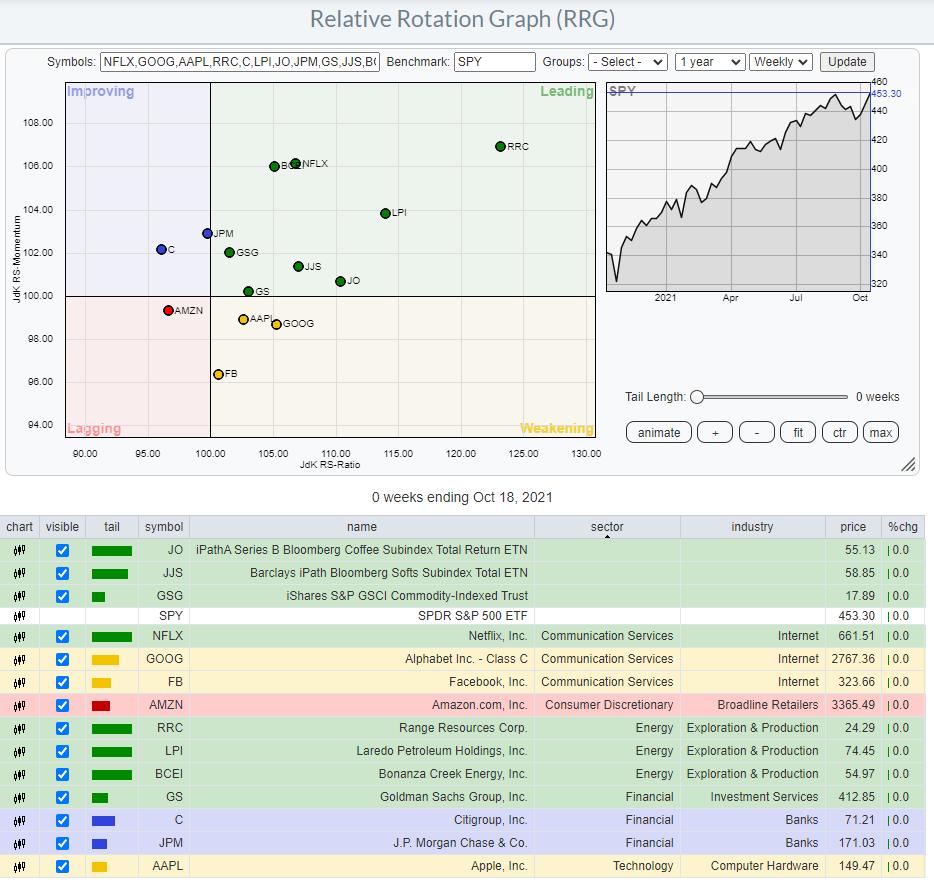
This is a universe that holds both a subset of the benchmark index as well as securities that are not included in the benchmark. This could be, for example, a portfolio of holdings compared to a general benchmark.
I.e. a portfolio of an investor who holds some individual small-cap energy stocks, all FANG stocks, a selection of large-cap banks, and three commodities-related ETFs and uses the S&P 500 index as the benchmark for that portfolio.
The small-cap stocks and the commodity ETFs are not included in the benchmark and the FANG stocks together with large-cap banks are only a subset of the S&P 500.
The relationship between the universe and the benchmark dictates whether it is an open or a closed universe
and
Knowing the details of what you are looking at on a Relative Rotation Graph will help you to better understand and interpret the message that the RRG is sending.
Have a great weekend!
#StaySafe, --Julius
My regular blog is the RRG Charts blog. If you would like to receive a notification when a new article is published there, "Subscribe" with your email address.
Julius de Kempenaer
Senior Technical Analyst, StockCharts.com
Creator, Relative Rotation Graphs
Founder, RRG Research
Host of: Sector Spotlight
Please find my handles for social media channels under the Bio below.
Feedback, comments or questions are welcome at Juliusdk@stockcharts.com. I cannot promise to respond to each and every message, but I will certainly read them and, where reasonably possible, use the feedback and comments or answer questions.
To discuss RRG with me on S.C.A.N., tag me using the handle Julius_RRG.
RRG, Relative Rotation Graphs, JdK RS-Ratio, and JdK RS-Momentum are registered trademarks of RRG Research.
