It has been a tough January.
I want to use a few charts to illustrate my point about why the real problem is just arriving. It might lead to a scenario across all of the charts (both growth and value) over the next six months to a year. It doesn't have to play out this way, as it can be different this time. A long-term chart like this should help us be aware of the three prior situations when the PPO indicator has soared to this level of enthusiasm.
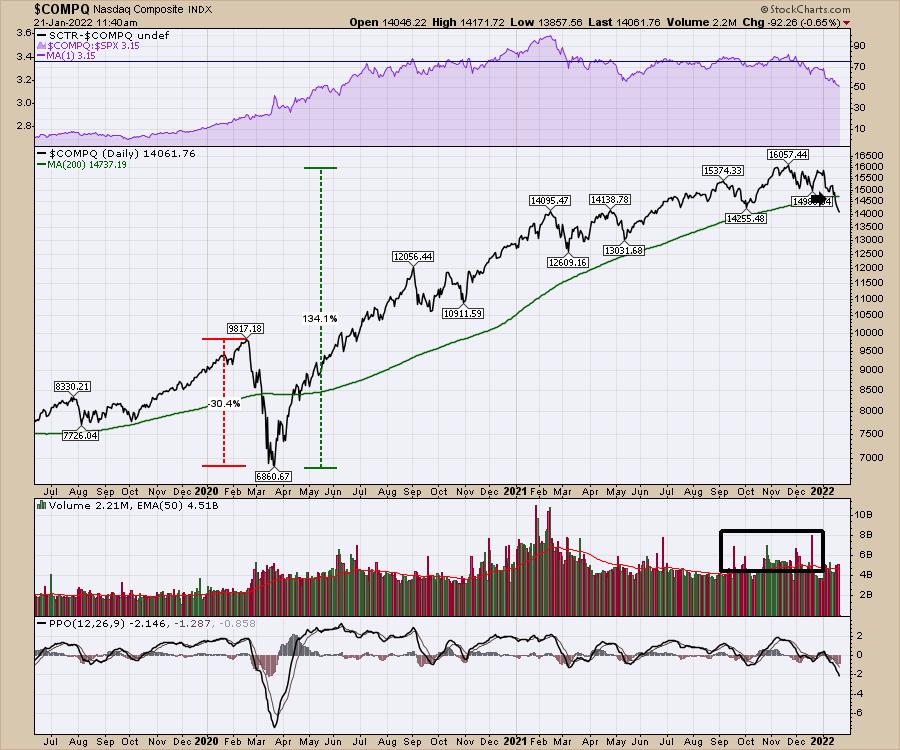
We got a PPO sell signal on the December close of the Nasdaq Composite. Of the three readings at this level, the pain endured was significant and long-lasting. It was also not easy to trade through, as it is a volatile series of trades with a downward-sloping trend.
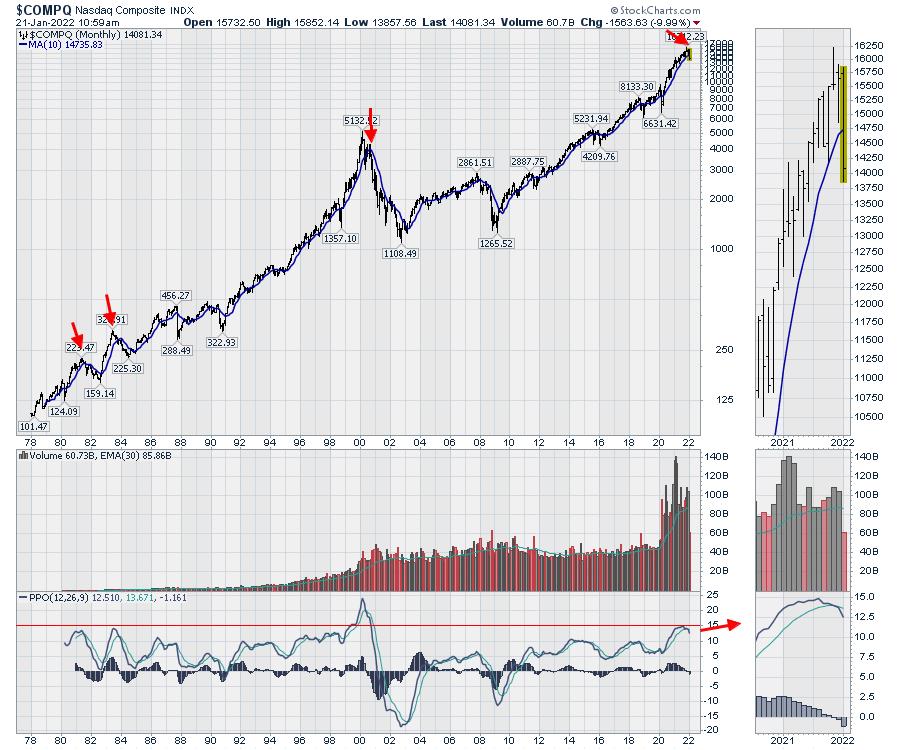
Let's look at the examples where the PPO momentum indicator ran up to a euphoric level near 15 closely, to see what happened in history. For comparison, the COMPQ fell 30% in March 2020 and has rallied 130% over 21 months.
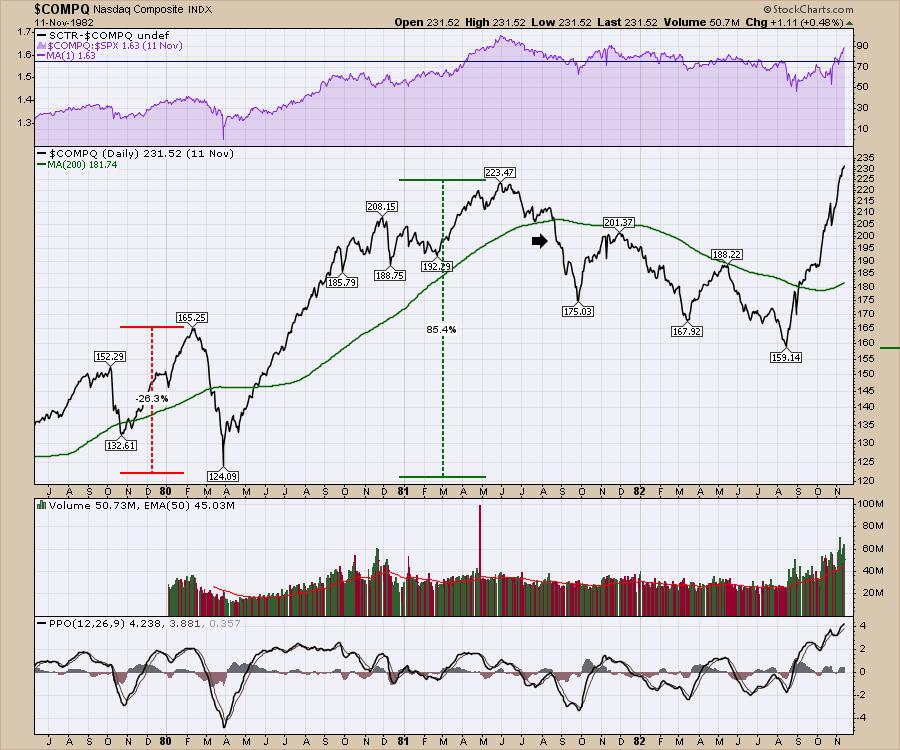
1980
In early 1980, the Nasdaq fell 26% in a month. It subsequently rallied 85% over the next year. It took two months to fall below the 200-DMA but a series of three volatile waves followed for the next year. Each were significant trading opportunities, but you had to sell your positions to make gains on the year.
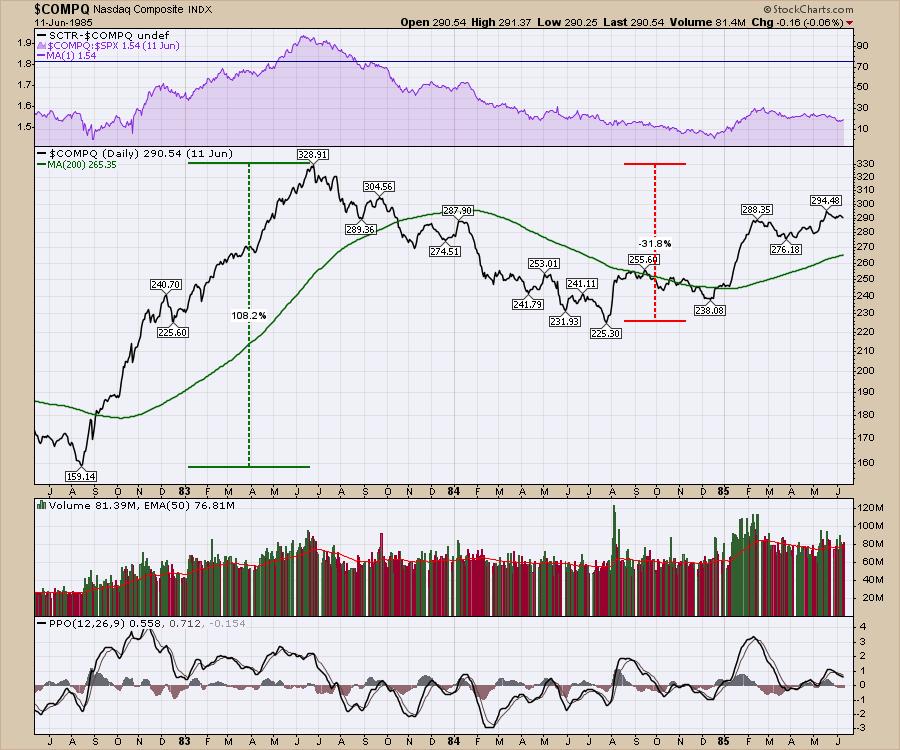
1982
From the 1982 low, another rally started. And it was also a massive rally. After rallying over 100%, the market pulled back 30% in an unrelenting wave lower. I'll let all the other chartists bring in the bond market, the US Dollar, the price of oil, the energy crisis, Iran, etc. The world always has something going on!
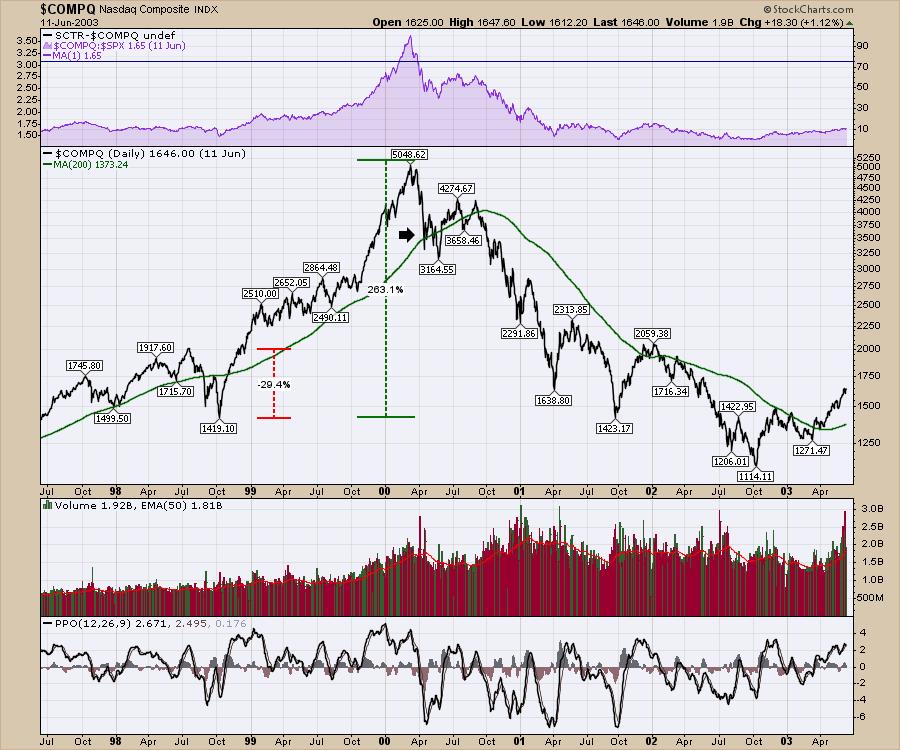
The Year 2000
There was nothing like it. The internet was a thing. Companies were measured on how many eyeballs were looking at their websites. New companies came out with outlandish valuations and promises of the future revenue stream. Alternative energy was also a big theme.
The Asian Financial Crisis had happened in 1997-1998. In 1998, we had a three-month pullback of 30% as LTCM imploded. The follow-on rally soared 250% in 18 months to the internet top. Trading volume skyrocketed 50% in the last quarter of 1999. The downstroke to the 200-DMA was quick. The market wobbled for six weeks. After the wobble, the Nasdaq Composite lost all of the investor support as they sold and sold and sold. The $SPX made a final high in September 2000 (not shown) just below the $SPX March high, but relented to the selling pressure as well.
2022
Fast-forward twenty years to the market run of 2021.
We have seen volume in late 2021 pick up meaningfully from the September levels. There have been three volume surges of note; one when COVID-19 started, the SPAC boom in February 2021 and during the final highs that we had before the PPO sell signal on the monthly chart above. The Nasdaq made the highest closing high in November 2021.
Conclusion
As the title of the article implies, we are at a turning point. The optimistic folks will suggest that this is a pullback on a road to euphoria as the world economies open up. I think Cathie Wood called a value-investing approach "Pavlov's dogs", as investors expect everything she invests in to continue cratering but value to hold up. She thinks the value stocks are way overvalued! It is an interesting paradigm where each person's bias shows up! Optimists say the bubble we had gave consumers money, and they will be out in full force to spend it. Back to growth!
Will the damage we saw in the three historic similarities create the same sort of market response? That is the real problem and it has arrived in a similar fashion. There are 75 stocks on the S&P 500 with price-to-sales ratios of 10 or higher. That is a staggering number. Our world has a global energy crisis that we are slamming into. Fund managers have supported market valuations at levels well above the long-term average. Consumer confidence numbers are declining. The world of optimism has created at least 150 cryptocurrencies, apparently all worth something. Investors can buy NFTs that double after you buy them, while people playing games are buying land in virtual reality games with crypto converted from US Dollars. I could go on. None of it matters until it does. We can have a lot slower year trading 2022 than 2021, but I need to wait for the opportunities. Most importantly, capital preservation is the key to winning after having such a massive run.
For me, I am an energy bull, a mining bull and starting to think about becoming a gold bull. But the cracking of this market has made me reel in my trading size and number of positions. I penned an article discussing the potential for the market to bounce as the $SPX hits the 200-DMA, which happened Friday morning. My videos for Market Buzz and Your Daily Five from this week also talked about the market setup. You might enjoy watching my entry for StockCharts TV's end-of-year review, 2021's Most Influential Charts. Stay safe, and be aware of the prior instances of euphoria. It may play out differently this time, but the previous three examples have a lot of similarities to the current setup.
Good trading,
Greg Schnell, CMT, MFTA
Senior Technical Analyst, StockCharts.com
Author, Stock Charts For Dummies
Want to stay on top of the market's latest intermarket signals?
– Follow @SchnellInvestor on Twitter
– Connect with Greg on LinkedIn
– Subscribe to The Canadian Technician
– Email at info@gregschnell.com
