I think, if I had to pick something in the market that I see often which is misleading, I'd pick the previous historical models proudly rolled out. Examples include how "Saint Patrick's Day is one of the best trading days of the year", "the Santa Claus rally was up, so the next year should be good", "January was down, but from the end of January onward is up", "if the first quarter is down, it's an excellent time to buy because the 12-month forward returns are almost always positive, except for", etc., etc.
The Fed has been frothing markets higher for 13 years. Nothing negative about that, but it's going to skew every historical model with the liquidity that was offered. It was only two years ago that the Fed wanted inflation. We had a massive number of government bonds with a negative interest rate globally. The downward spiral was scaring the world. Commodity prices were plummeting. If all that is changing, are these historical models at all relevant?
With the COVID response, almost every central bank and government in the world offered fuel to keep the economy going. It was the single biggest money print ever. Of course it would be, as the total GDP of the global economy is larger than ever before and this was a response that was also global.
I think what I find more difficult is the forgetfulness of fighting the negative interest rate spiral in the historical model discussion. We are now fighting something new, and it's called inflation. Again, it was only two years ago that the Fed/central banks worldwide wanted to create inflation. We got what we asked for. These are not light switches that turn on and off easily.
Commodity markets were under duress before the Russia/Ukraine situation. In the last month, we have shocked the world's commodity markets. Without proper functioning of the commodity markets, we are in a world of trouble. As countries start to hoard grain and raw materials, we enter a door to a different kind of inflation.
The removal of trade barriers had lowered prices on goods around the world. With the size of Russia and Ukraine commodity exports being affected, this is setting up for some rough seas ahead. If Russia loses 3 million barrels a day of production/exports, that is a billion barrels/year not reaching the world markets. As floating storage swells, eventually this pressure will force Russia to stop producing oil as the tank farms fill up. The impacts from reduced grain shipments is also huge, so oil is one example, but it moves across the spectrum of commodities.
Amazingly, commodities are only marginally higher from the sanction date of February 24th. Notice crude oil trading for three days trading within the price bar of February 24th, shown by the black arrow. When people talk about the oil price reflecting the war with Russia, I would suggest it has barely started. Both the 8-day and 20-day moving averages were pointed down and are now flat. Has the shortage stopped?
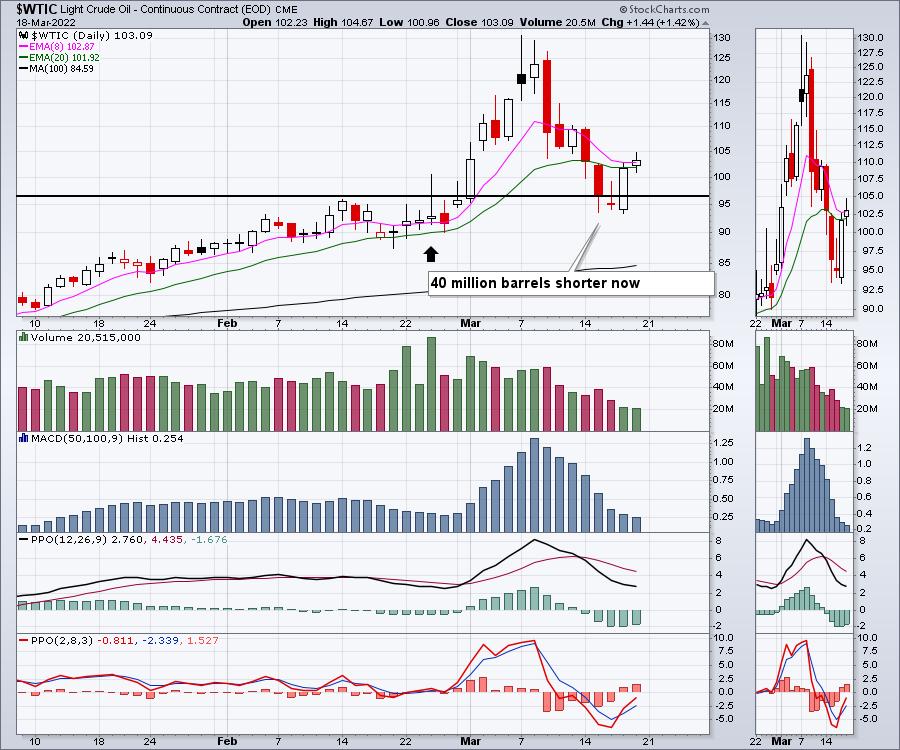
The price volatility is definitely changing, as oil has traded in a 26% range for the prior two weeks. The current week of March 14th has oil trading in a 17% range. Oil is currently a $100 Billion/day market, and it is swinging wildly trying to adapt to the changes.
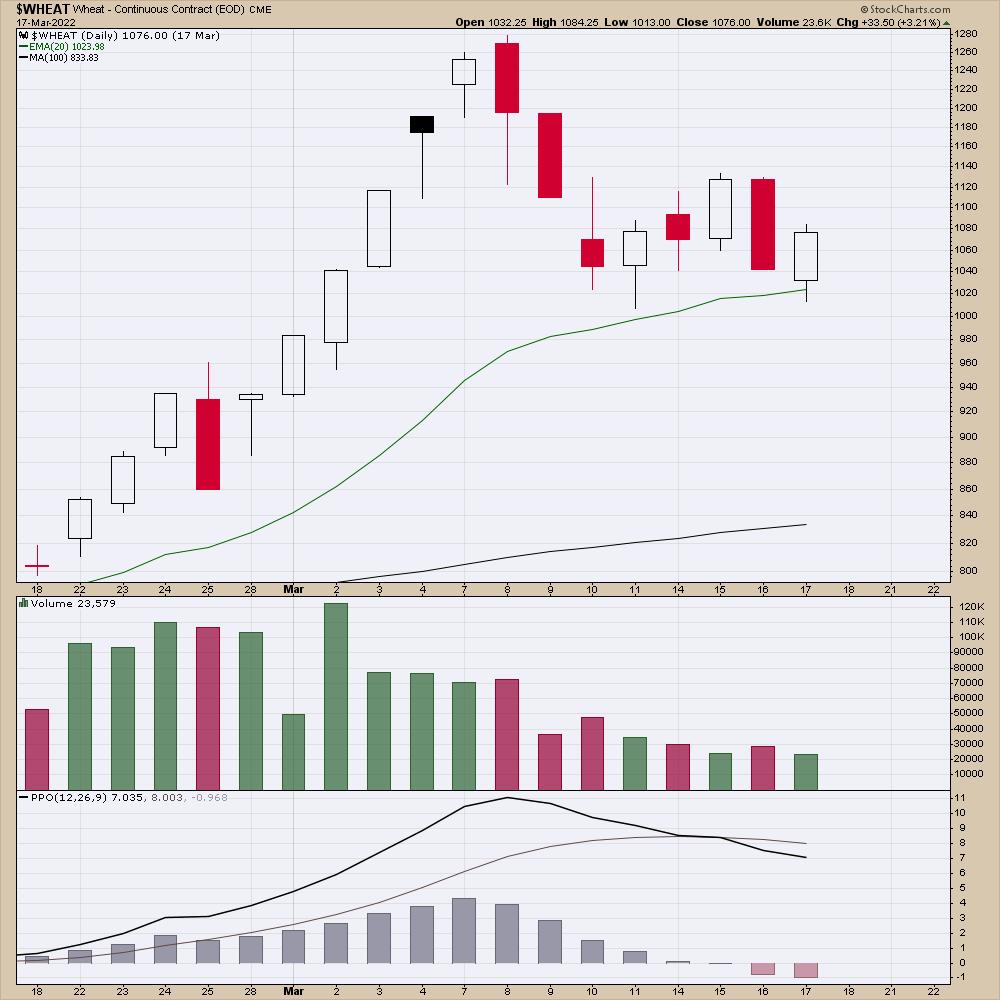
Wheat is also trying to stabilize after rocketing higher.
Germany is closing car plants to deal with supply chain problems. Again, oil is just one example. As the hoarding of materials goes global, this can affect the economic resilience of our industries.
While the focus is on the Fed to control inflation, it's not realistic to think they can control commodity inflation, especially during trade sanctions. The slowing of the economy might help them do that, but it is a difficult type of inflation we are staring at. Investing will be very tricky as the Fed removes liquidity and raises rates into a commodity shortage. It's not the quarter-point change that matters in my opinion, it is the shortage of energy globally that is going to make the economy slow. We were in an energy crisis before this Fed meeting. We are definitely in one after the sanctions.
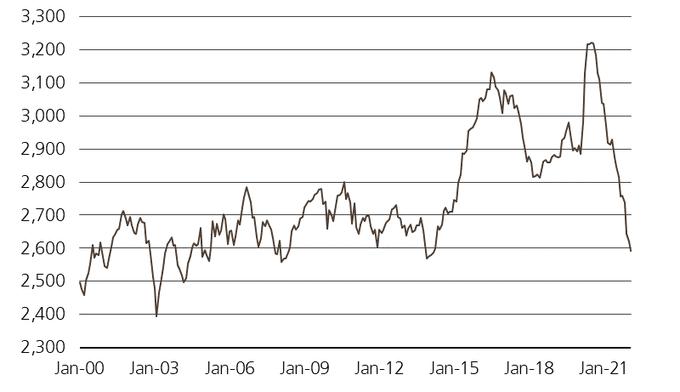
I found this chart on my Twitter feed, but this shows the global crude inventory levels back in January from the IEA, before any war started.
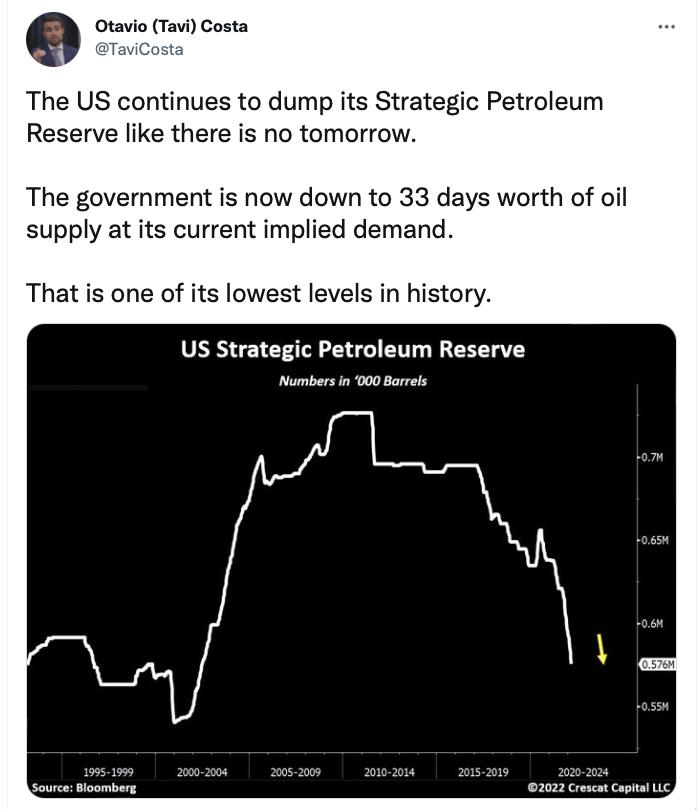
For those believing the SPR is the source of solace, notice the dates on this chart.
The charts are telling us a different story than the current political spin globally. The inflation we wanted 2 years ago is now unrelenting. The problem didn't start in February, and it won't being going away anytime soon.
Using historical models of good days and seasonal tendencies is literally pub talk. The backdrop of what we are facing is dramatically different than anything we have faced in the golden years since the 2009 financial crisis. Fed support and commodity weakness made it a one-way environment. Now it's a Fed that is removing liquidity and extreme commodity shortages, making it the opposite environment.
I think minimizing the use of historical data within the last ten years is probably a much better way to think about the markets going forward. The shortages are just beginning, unless something remarkable happens beyond the Russian situation.
Good trading,
Greg Schnell, CMT, MFTA
Senior Technical Analyst, StockCharts.com
Author, Stock Charts For Dummies
Want to stay on top of the market's latest intermarket signals?
– Follow @SchnellInvestor on Twitter
– Connect with Greg on LinkedIn
– Subscribe to The Canadian Technician
– Email at info@gregschnell.com
