I need to add a new word to my trading vocabulary. I think every presentation at this year's CMT Association Symposium has used "regime change" to define the shift from one leading sector to another leading sector. This verbiage is also used in discussions for the "regime change" from growth to value. How about from tech- to commodity-centric? These are all regime changes, and this phrase does help to disrupt our historical thinking of tech or growth as the best sector.
The phrase is important because it highlights how significant the change is. This is not just a month-to-month focus. The consideration of a regime change highlights that we are at a much more significant place in history. Using this macro terminology, let's look at some of the different market areas.
Nasdaq 100
The markets have been breaking down for months and, as we roll out of April, the QQQ hangs around the neckline of the classic head/shoulders pattern.
When we place the thought pattern of a regime change, the chart below holds some technical signals that chartists talk about. First of all, the QQQ SCTR is down to 23%. That means that 77% of the ETF's have better price action than the QQQ's right now. The question has to be "Is this a bounce level?"
The relative strength in purple compares the chart to the $SPX. The Nasdaq was outperforming the $SPX for years, and now it is not. Until that 3-month down trend changes, we can look elsewhere. The simple trend line change can tell us a regime change may be happening, when we are comparing big macro environments. It was a great clue at year end.
The full stochastic is near the bottom of the range. This can stay near the bottom of the range for a while. The way a full stochastic is calculated tells us where the price is compared to the recent price action. Bad markets stay near the bottom, good markets stay near the top. There is no news that this is improving yet.
When we look at price, the chart has clearly made a lower high recently at the end of March. But it is trying to bounce off support.
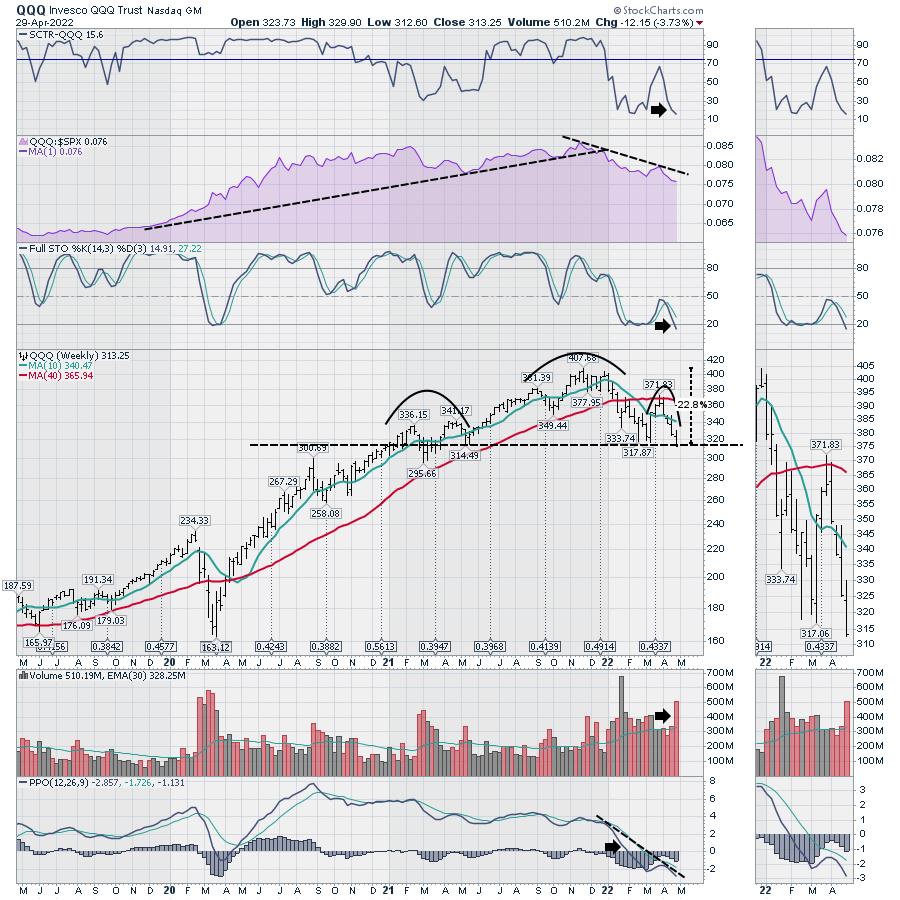
The volume on this chart shows this week as one of the highest volume weeks in 2022. It was also the earnings week for the largest tech companies. The volume reflects something very important here: it was either managers selling into any earnings rally, or it was managers buying the bounce. We won't know yet, but there is a specific level of interest right here.
Lastly, the PPO is my favorite indicator, and it is still pointing down. The slotted black trend line is a real resistance line. For me, unless we can break this momentum downtrend, this chart is still heading lower. If this chart breaks lower, I would suggest a larger cycle regime change is officially here as it breaks support.
Energy
I do have a chart that is a commodity-related chart. Without going through all the indicators, it's pretty obvious this has been outperforming.
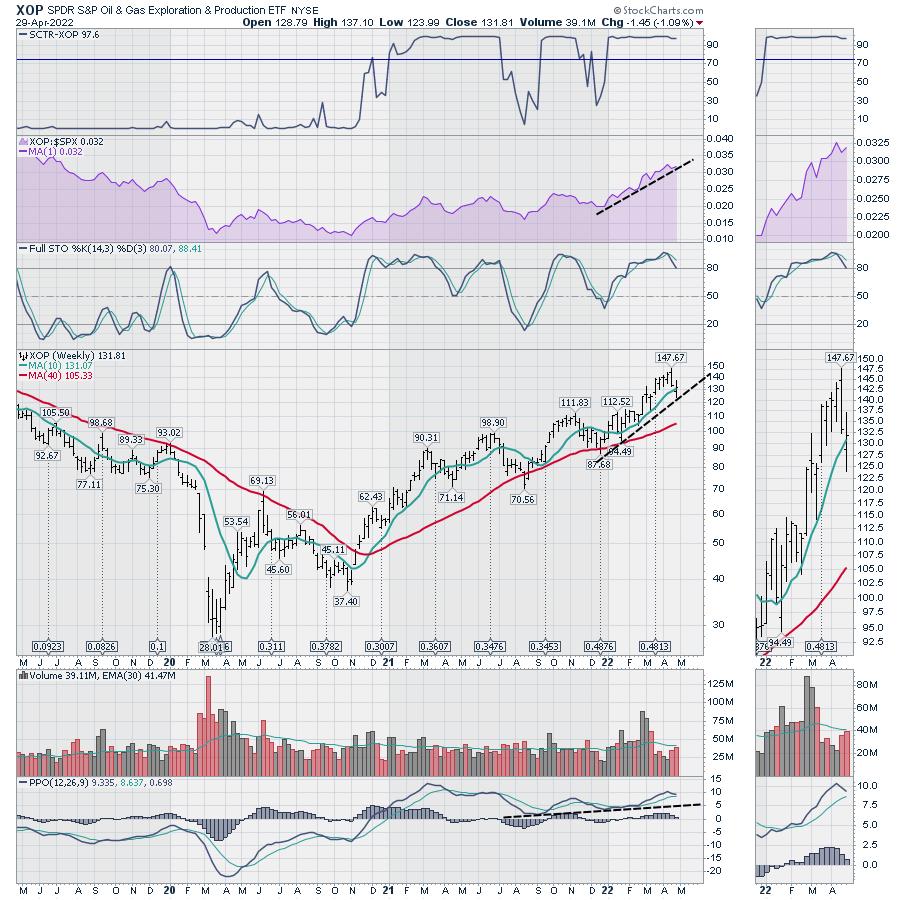
The real question for me is if the purple uptrend on the XOP chart will continue to outperform. The PPO is rolling over to end the month of April. We'll see if this chart can continue higher, but, right now, it is much better than the rest of the market.
If the idea of a regime change is worrying to you, we are about to see if the change from tech to energy is a larger cycle regime change. To me, the regime change started in January 2022, when the QQQ started to underperform the $SPX.
The CMT Symposium is using the regime change verbiage during most presentations. While the fundamental investors are thinking this is a great time to step in as a value investment, the technical view suggests the regime change is very important. For me, we stand at a critical juncture.
Stay tuned.
Good trading,
Greg Schnell, CMT, MFTA
Senior Technical Analyst, StockCharts.com
Author, Stock Charts For Dummies
Want to stay on top of the market's latest intermarket signals?
– Follow @SchnellInvestor on Twitter
– Connect with Greg on LinkedIn
– Subscribe to The Canadian Technician
– Email at info@gregschnell.com
