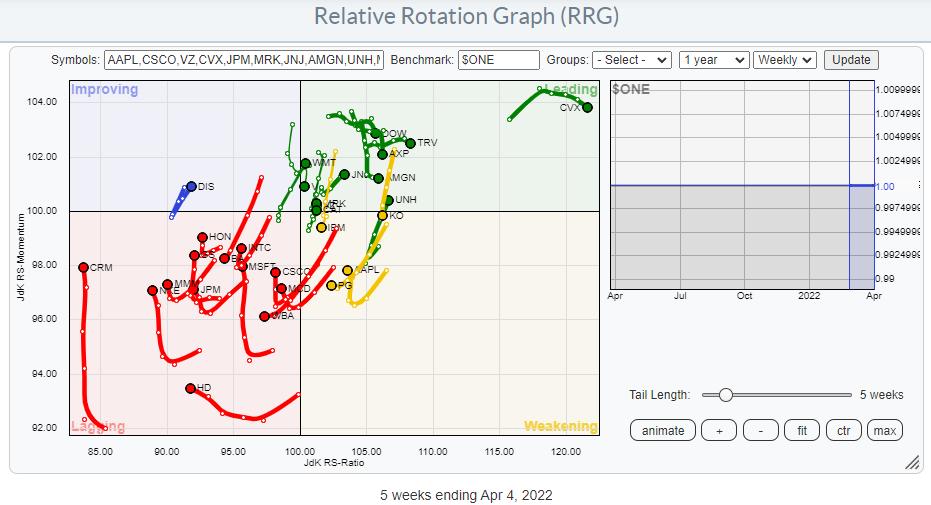
The Relative Rotation Graph above shows the members of the DJ Industrials index against $ONE as the benchmark. This way of looking at RRG helps us to gauge the price trends within the universe. You can see quite clearly that the majority of the tails are inside the lagging quadrant, with a few inside weakening and heading towards lagging.
Of the tails that are inside leading, only a few are moving at a positive RRG-Heading. Of the tails inside lagging, quite a few are picking up on the vertical JdK RS-Momentum axis but not (yet) on the RS-Ratio axis. This suggests that these moves are more recoveries within the existing downtrends than reversals of those trends.
This reading gets support from the daily RRG
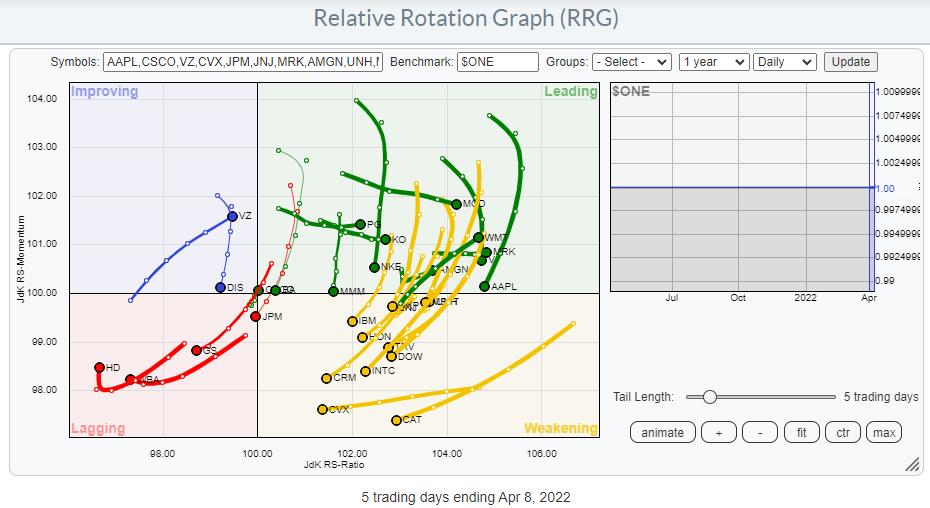
Here we see a whole cluster of tails inside leading and weakening, pretty much all at a negative RRG-Heading. It's the positive rotation that this group went through over the past 2-3 weeks which pushed the weekly tails up on the RS-Momentum scale. The weakness that is now setting in on the daily RRG suggests that this recent rally is now ending.
The fact that the general tendency of tails on both RRGs is weak makes it hard to call a bull market for the DJ industrials index itself.
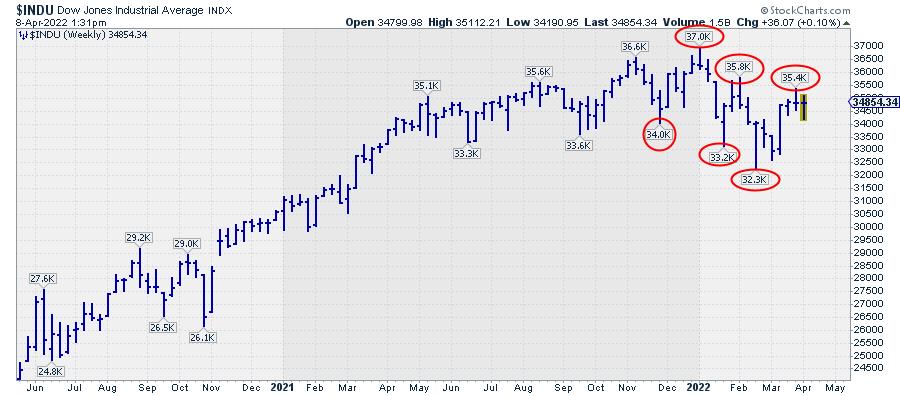
A quick look at the weekly chart of $INDU above reveals that, since the start of this year, the lows are coming in at lower levels while the highs are also coming in at lower levels. This defines a down-trend.
I am writing this on Friday before the close, so things have still a few hours to change, but I'd be quite surprised if the market would manage to take out the 35.4k high that was set last week. When the market closes at or around current levels, that 35.4k peak will become a confirmed lower high.
But also simply comparing the behavior on this chart since the start of 2022 with the behavior since mid-2020, it's pretty safe to conclude that this is not a very strong chart anymore. There's enough technical evidence that one should at least be using a careful approach to putting on new long positions.
Not All Pigs Are Equal..
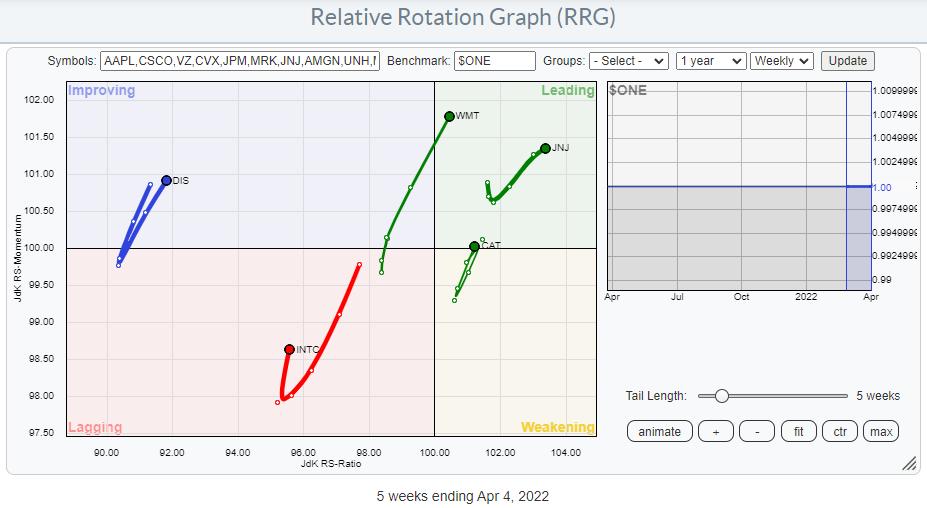
Browsing through the tails on the weekly RRG., I identified only five stocks that are on a positive RRG-Heading (0-90 degrees). These are shown in the plot above. The two that really stand out in a positive way are WMT and JNJ.
JNJ - Johnson & Johnson
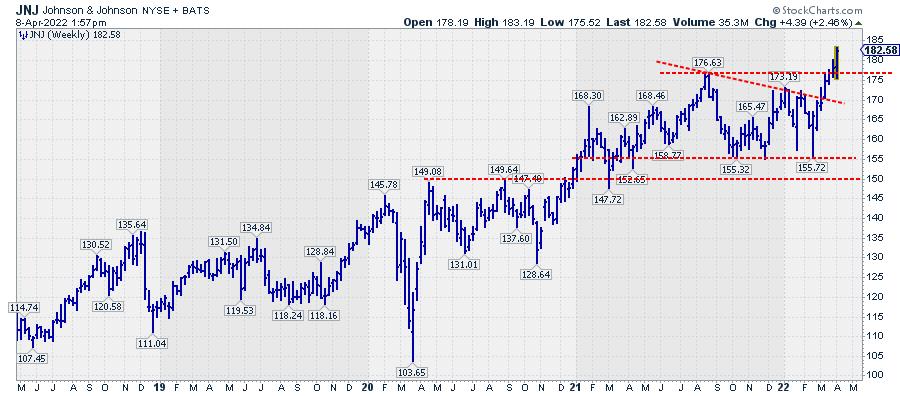
After a consolidation that took about a year, JNJ is now breaking away from that trading range, which opens up a lot of new upside potential for this stock. Within the Dow Jones Industrials index, this could be one of the few fish that is trying to swim against the tide.
WMT - Walmart
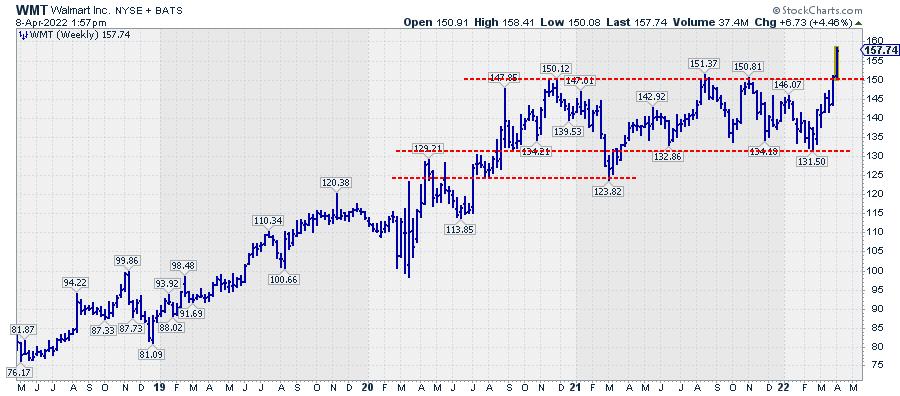
For WMT, the picture is quite similar. The consolidation took even longer, but the upward break of this week takes WMT convincingly out of its trading range which, just like JNJ, opens up a lot of fresh upward potential for the stock.
For both names, the downside is well protected by the upper boundary of the former trading range, which should start to act as support in case of a setback offering a good risk/reward ratio.
Have a great weekend and #StaySafe, --Julius
My regular blog is the RRG Charts blog. If you would like to receive a notification when a new article is published there, "Subscribe" with your email address.
Julius de Kempenaer
Senior Technical Analyst, StockCharts.com
Creator, Relative Rotation Graphs
Founder, RRG Research
Host of: Sector Spotlight
Please find my handles for social media channels under the Bio below.
Feedback, comments or questions are welcome at Juliusdk@stockcharts.com. I cannot promise to respond to each and every message, but I will certainly read them and, where reasonably possible, use the feedback and comments or answer questions.
To discuss RRG with me on S.C.A.N., tag me using the handle Julius_RRG.
RRG, Relative Rotation Graphs, JdK RS-Ratio, and JdK RS-Momentum are registered trademarks of RRG Research.
