
When the stock market can't decide which way it will go, investors have difficulty making decisions. But it doesn't have to be that way. You can up your investing game plan by following this road map.
CHARTWATCHERS KEY POINTS
- Looking at different asset types helps to get a big picture view of the stock markets.
- Viewing charts of the broader equity markets gives you a picture of one area of the markets.
- It's important to add other asset types such as Treasury yields, gold, and US dollar into your charting routine.
When FOMC minutes were released on Wednesday, the likelihood of higher Fed Funds rate sent the stock market lower, finding support at the 50-day moving average. A strong labor market and wage inflation are still a concern. Jobless claims continue falling, while wages continue to rise. Higher home prices also remain a concern, although they seem to be pulling back, as 30-year mortgage rates have started moving higher after a short-term pullback.
The CME FedWatch tool showed the possibility of a 50 basis point (bps) rate hike at around 27%. It's still lower than a 25 bps interest rate hike expectation, but higher than the 16% probability prior to the FOMC release. Treasury yields rose, with the 10-year yields moving closer to the 4% level.
One of the funny things about the stock market is that every time one person buys, another sells, and both think they are astute. -- William Feather.
Revised Q4 real GDP showed that the economy grew a little slower than expected (2.7% vs. 2.9%), the main reason being consumers cutting back on spending. This is in line with guidance earlier this week from big box retailers Walmart (WMT) and Home Depot (HD), which both indicated that consumers were getting more conservative in their spending.
Nvidia's (NVDA) stellar earnings and its involvement in the AI wave helped boost the Technology sector, with the Nasdaq Composite ($COMPQ) closing higher today by 83.33 points.
Investors are getting mixed messages, which aren't helping the stock markets get into a bullish groove. Let's see if the personal income and expenditures for January that'll be released Friday morning helps. Remember, the personal-consumption expenditures (PCE) price index is one the Fed likes to use to measure inflation. And if it comes in higher than estimates, equities could go down further.
Rev Up Your Market Engagement
If you're looking to invest some cash in the stock market and are having a hard time deciding what to invest in and when, it's best to explore different areas of the stock market to help make decisions. One way to do that is to set up a chart that analyzes equity performance against other assets.
The chart below shows how you can compare the performance of S&P 500 index with 10-Year US Treasury yields, gold futures, and the US dollar.
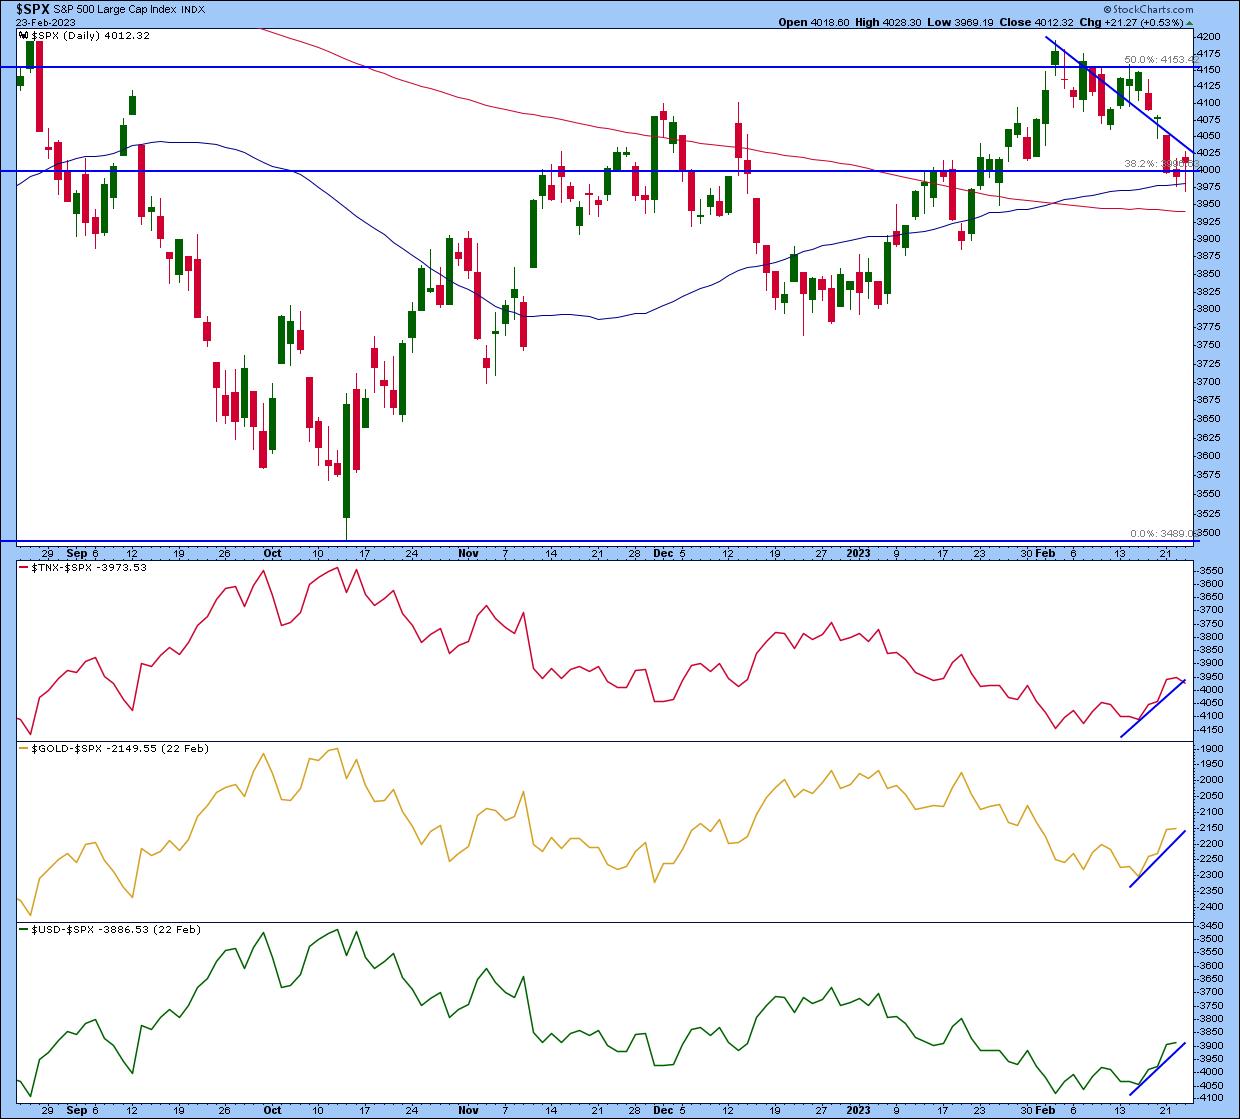
CHART 1: S&P 500 INDEX CHART VS. TREASURY YIELDS, GOLD, AND US DOLLAR. A downward-trending S&P 500 index and upward-trending US Treasury yields, gold, and US dollar opens up investing opportunities in areas other than US large cap stocks. Click on chart to access live chart.Chart source: StockCharts.com. For educational purposes only.
Note that as the S&P 500 was trending lower, the relative performance of 10-year yields, gold prices, and the US dollar, with respect to the S&P 500, were trending higher. When you see this type of scenario play out, some questions may arise:
- How much lower will equities fall and for how long?
- Does it make sense to invest in bonds, or in gold stocks/ETFs?
- How can you take advantage of the rising value of the US dollar?
Rising Interest Rates: Best Investments
Interest rates and bond prices have an inverse relationship, which means that, as interest rates rise, bond prices fall. So why invest in bonds when they're falling? All bonds are not created equal. Shorter-term bonds tend to be less sensitive to interest rate changes. Pull up a chart of the iShares 20+ Year Treasury Bond ETF (TLT) and compare its performance to the SPDR Barclays 1-3 Month T-Bill ETF (BIL). You'll notice that BIL has a clear uptrend whereas TLT goes through ups and downs.
Another alternative would be to invest in sectors that tend to perform better in a rising interest rates environment. Financial companies often perform better in a rising rate environment. Pull up a chart of the Financial Select Sector SPDR ETF (XLF), as in the chart below.
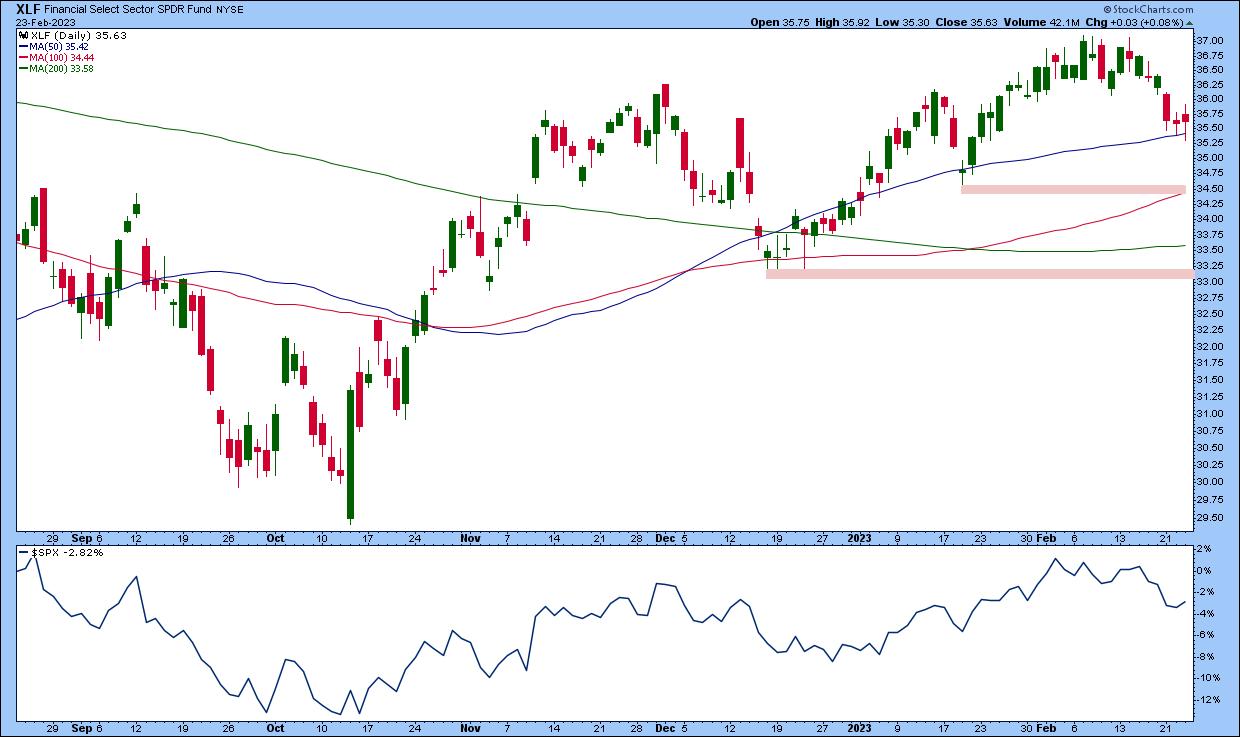
CHART 2: DAILY CHART OF XLF. If XLF breaks below its 50-day moving average, it could fall towards its next two support levels (pink horizontal lines). Also note the relative strength of XLF vs. the S&P 500 index. It looks to be turning up. Click on the chart to access the live chart.Chart source: StockCharts.com. For educational purposes only.
XLF is hanging out at its 50-day moving average support. It could bounce off this level and move higher, or it could go lower towards the $34.50 level or even towards $33.25. You'll want to see a followthrough of an uptrend before opening a long position in XLF.
More important, looking at the relative strength of XLF relative to the S&P 500 (lower subchart), it's in negative territory as of this writing, although it looks like it may be turning higher. Something to keep an eye on, going forward. If it turns and starts to move higher, XLF could be a potential long candidate for your portfolio.
Investing in Gold
Gold is considered a risk-off investment—when stock markets are underperforming, investors often invest in gold. It's thought of as a hedge against inflation and recession. Short of buying physical gold or futures, you could consider investing in gold ETFs, such as the SPDR Gold Shares (GLD) or gold-related stocks.
To screen for gold-related stocks, from Your Dashboard, scroll down the Member Tools section to Summary Pages and select Industry Summary. Gold mining ($DJUSPM) falls under Materials, and, when you click on it, you'll see a chart on the left. Below it are several icons. Click on the one on the extreme right and you'll see a list of all the industry members. Looking for the large cap stocks in this category? Sort the columns by market cap (U) and start your analysis. If you find a stock you like, add it to one of your ChartLists. Then take it one step higher and set alerts for when prices reach a certain threshold.
Taking Advantage of a Strong US Dollar
A strengthening dollar can be a headwind for large US multinationals that have a lot of international business dealings. So, if the dollar rises in line with a strengthening US economy, you may be better off investing in small cap stocks with domestic operations.
To get a big picture view of small caps, you can access the S&P 600 Small Cap index ($SML) from the Market Overview section on Your Dashboard. If the technicals look good, you could consider investing in small cap ETFs. Think real estate, defense, and health insurance companies. Some small cap ETFs to consider are the iShares Russell 2000 (IWM), the Vanguard Small-Cap Value (VBR), and the Schwab U.S. Small-Cap (SCHA).
The Bottom Line
The stock market is continuing with its up and down indecisive movement. It's almost as if investors are waiting for some news that provides some certainty. This could go on for a while, given that the next Fed interest rate decision isn't until March 22. But even though the broader equity markets aren't showing signs of direction, there are other areas you could look at, such as Treasury yields, gold, and the US dollar. Uptrends in these three could open up investment opportunities beyond large cap stocks.

Disclaimer: This blog is for educational purposes only and should not be construed as financial advice. The ideas and strategies should never be used without first assessing your own personal and financial situation, or without consulting a financial professional.
Happy charting!
