
In the dynamic world of market prices, timing is often everything.
Knowing when to buy or sell is key to a successful trade. But how can you identify the opportune moment to make a move? One strategy many traders embrace involves focusing on stocks breaking their 52-week highs. This is the intriguing, yet all-too-well-known, strategy of trading 52-week high breakouts.
This trading approach, while seemingly straightforward, encompasses a nuanced blend of momentum investing, psychology, market sentiment, and technical analysis. Its allure lies in the premise that stocks soaring to their highest peaks in the last year often carry the potential to climb even further.
What's the Big Deal About a 52-Week Breakout?
Aside from 52 weeks representing a year's high (or low), here are a few other reasons why this approach may be considered favorable:
- Momentum Investing. This approach aims to capitalize on the continuation of an existing trend. The basic idea is that stocks which have recently performed well are more likely to continue performing well. Thus, a stock reaching new 52-week highs could be a signal that its upward momentum will continue.
- Hype Factor. When a relatively popular stock breaks above its 52-week high, it can sometimes create a sense of excitement, urgency, or even FOMO (Fear Of Missing Out) among speculators, which can drive more buying pressure and potentially push the stock price even higher.
- Market Sentiment. Breaking a 52-week high can be seen as a strong bullish signal, indicating that perhaps the positive sentiment will likely be validated by fundamental expectations (i.e., earnings).
- Resistance Becomes Support. In technical analysis, the 52-week high is often viewed as a resistance level. If a stock breaks through this level, it's thought that the resistance has been broken and might, should the stock continue moving upward, turn into "support."
Watch Out for the Risks
It's important to note that just because a stock has broken its 52-week high doesn't guarantee that it will continue to go up. The stock may be overvalued above the 52-week level.
The stock may experience a false breakout. Other factors, such as company's fundamentals, market conditions, and macroeconomic factors, can also influence a stock's future performance.
The "tradability" of a stock depends on the stock itself. In other words, there are plenty of variables that might make one stock a better prospect than another despite both breaking above their 52-week highs. So look for setups with a favorable risk-to-reward ratio. Also, be sure your stops are set at reasonable levels (not too tight, but not too far either).
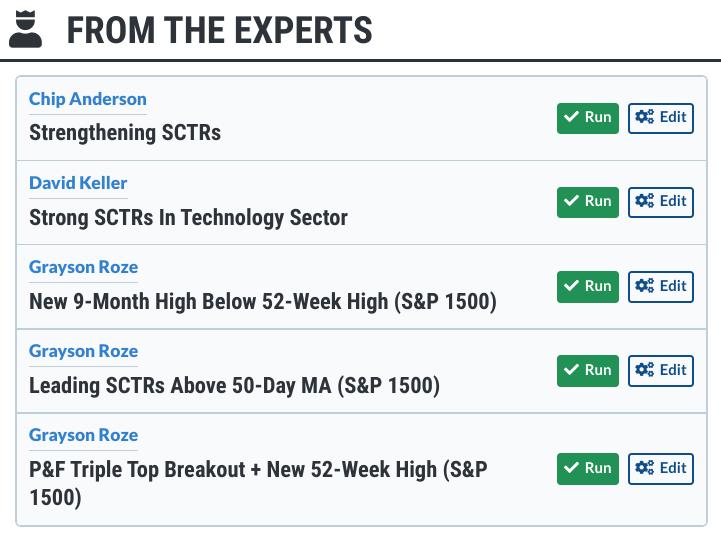
How to Scan for 52-Week Breakouts Before They Take Place
To get a jump on the 52-week breakout before it happens, run a scan on Grayson Roze's New 9-Month High Below 52-Week High scan.
From Charts & Tools menu, scroll down to Sample Scan Library and click Browse Scan Library.
For example, running a scan this morning yielded only two results.

Fortunately, the first suggestion, GXO Logistics Inc (GXO), happened to break out today, which gives a clear example of what this scan does.
Just so you know, the following is not a trade recommendation. It's an example of how you might use StockCharts' scan functions to find a tradable asset; in this case, an asset that aligns with the 52-week breakout setup.
A Break Above the 52-Week High... So, Now What?
The first suggestion from the hypothetical scan is GXO, which happens to be breaking out as we speak. So, now what?
First, know something about the stock before you trade it. Remember, this illustrates an example of the scan (and not as a tradable asset).
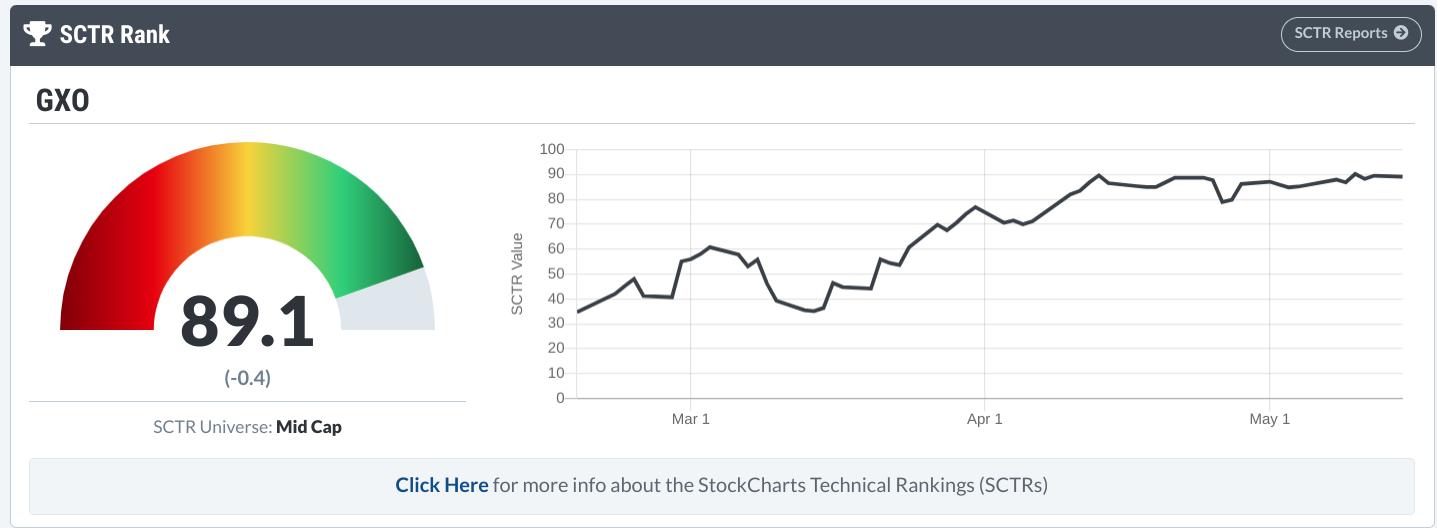
GXO's SCTR reading has been on the up-and-up for some time (see image below).
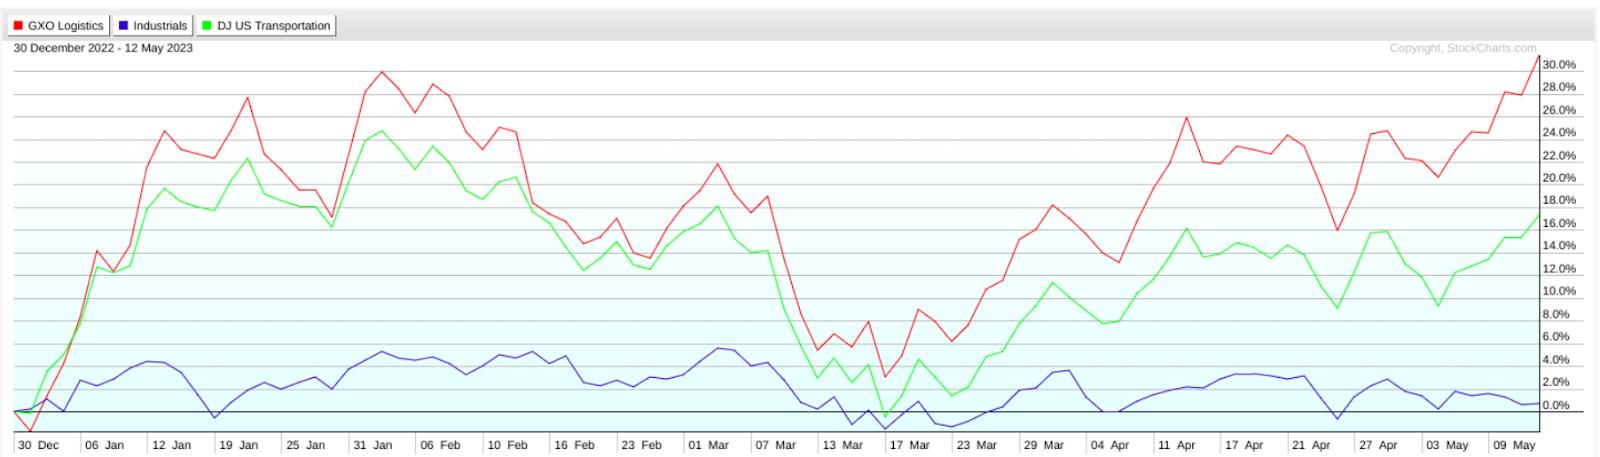
As a stock within the Industrials sector and Transportation Services industry, GXO has been outperforming both year-to-date.
Let's take a closer look at the breakout itself.
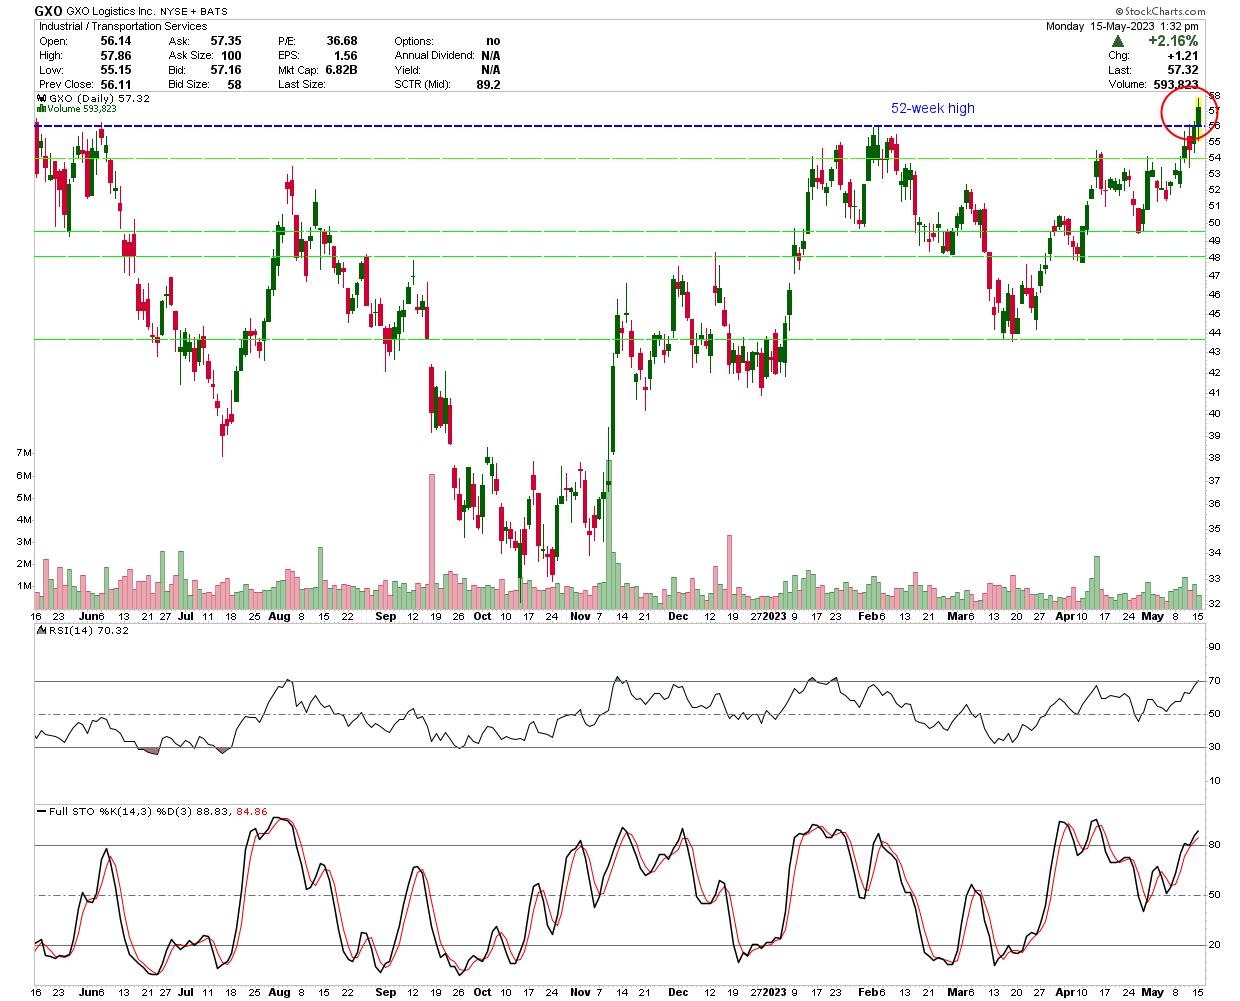
If you look at the Relative Strength Index and the Stochastic Oscillator in the above chart, you might get a feeling that sits somewhere between "we're entering overbought territory" and "this overbought reading can stay at these levels for a prolonged period."
Both intuitions can seem unsettling, especially if you enter with a long position right as it breaks out (which is now, more or less). So, it's best to look at the downside and see where, if it pulls back, the stock might find some support.
If you look at the green horizontal lines, you'll find plenty of "ranges" in which several areas of support or resistance-turned-support lay.
For a trader looking to make an entry, any of those lines make for a potentially favorable entry point. As far as a stop-loss is concerned, the line below the $50 range makes for a reasonable stop, as the range below may begin to render the upside bias invalid. A break below $44 would invalidate the bias and the trade (depending on where you entered your position).
The Bottom Line
Using a tool like the 9-Month High Below 52-Week High scan can be a game-changer for spotting possible 52-week breakout trades. It can help you get ahead of the curve.
But remember, as much as we'd love every breakout to be a surefire win, trading is more complex. Just because a stock hits a new high doesn't mean it's set to skyrocket. Sometimes, the stock might be overvalued, or you might run into a false breakout. Always keep an eye on the company's fundamentals and overall market vibes.
In short, be savvy about it. Use the scan, but also use your head. Make sure the potential rewards outweigh the risks, and set your stops at reasonable levels. In the end, trading is about timing and being ready to make your move when the opportunity strikes.

Disclaimer: This blog is for educational purposes only and should not be construed as financial advice. The ideas and strategies should never be used without first assessing your own personal and financial situation, or without consulting a financial professional.