TAKEAWAYS
- After three quiet decades, Japanese stocks are making a comeback
- The rise is powered by factors like improved company management, cheaper stock prices compared to the US, a weaker yen, and companies giving more money back to shareholders
- The $64 price level is key for the MSCI Japan Index ETF (EWJ)

After a dormant period of three decades, which saw scant interest from international investors, Japanese stocks appear to be making their way once again into the limelight. While investors across the globe are wondering whether now might be the right time to invest in Japan, the iShares MSCI Japan ETF (EWJ) exhibited a dazzling run, gaining nearly 18% year-to-date—its highest level in 33 years.
Notably, EWJ, at its highest level in June, outperformed the S&P 500 Index ($SPX), as StockCharts' PerfCharts show below.
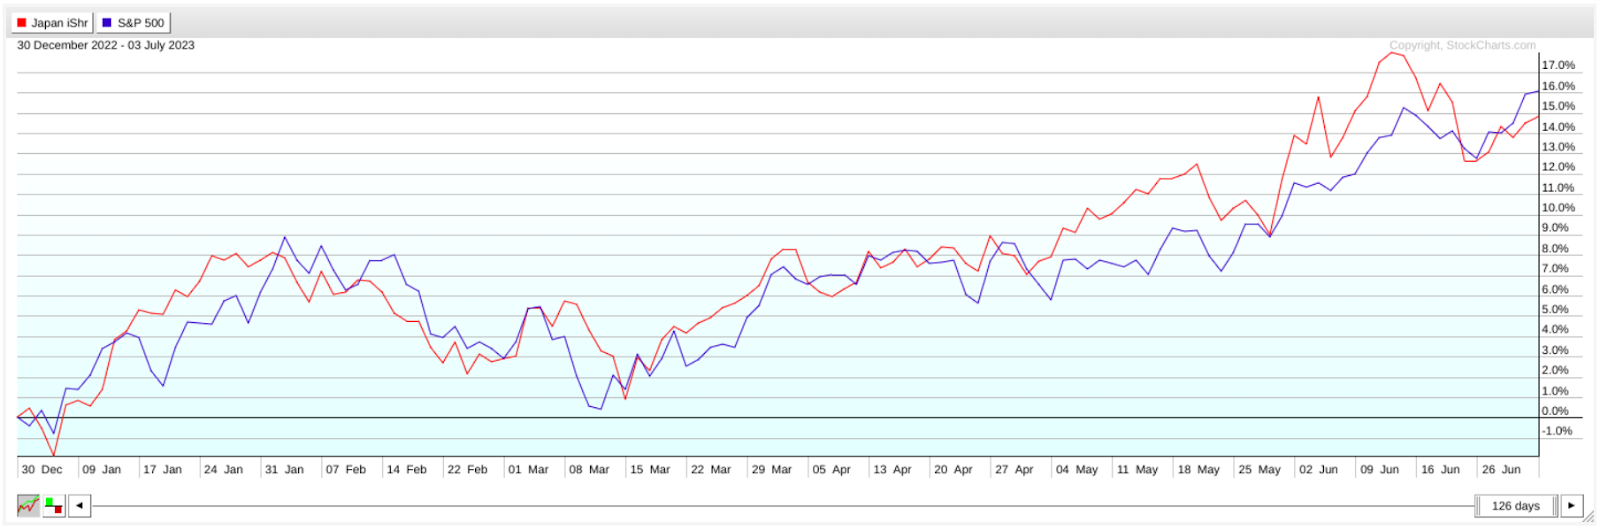
CHART 1: PERFCHARTS OF EWJ AND THE S&P 500: The iShares MSCI Japan ETF outperformed the S&P 500 index from April to June 2023. Chart source: StockCharts.com. For illustrative purposes only.
What's Triggering the Turnaround?
Investors like Warren Buffett are shelling out capital to re-enter the Japanese market. Why? There are quite a few factors: enhanced governance standards, cheap stocks relative to the US market, a depreciated yen, and share buybacks and record dividends have helped to bolster Japanese stocks.
More notably, however, several large semiconductor manufacturers are also reportedly increasing manufacturing and strengthening tech partnerships in Japan, which is viewed as a safer way to capitalize on China's growth amidst the US-China tensions.
Fundamentally, there's enough of a reason to be bullish on Japanese stocks, particularly about semiconductors, which right now are experiencing a huge surge in interest. So what does the technical picture look like?
A Weekly Technical Picture of EWJ
EWJ tracks around 237 Japanese large- and mid-caps (with minimal small-cap exposure) listed on the Tokyo Stock Exchange. The index is designed to provide investors with a comprehensive and representative view of the Japanese equity market.
A Head & Shoulders Bottom
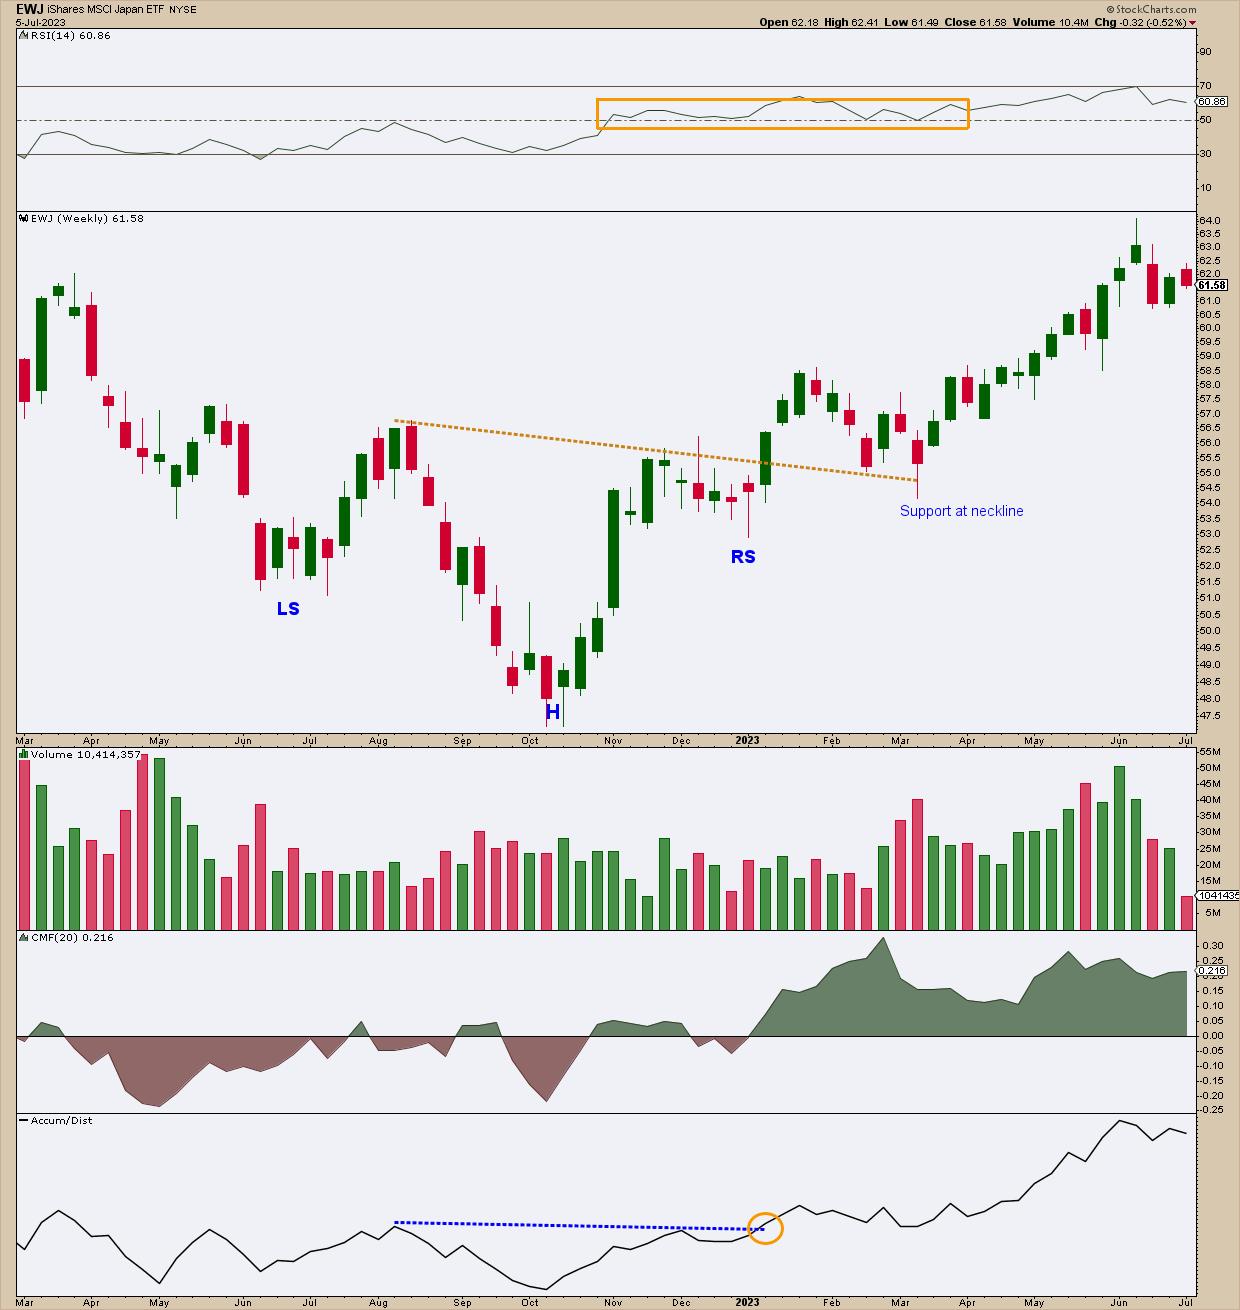
CHART 2: WEEKLY CHART OF EWJ. Price is trending higher following a seven-month Head & Shoulders bottom. Chart source: StockCharts.com (click chart for live version). For illustrative purposes only.
Zooming out to get a big-picture view of EWJ's price action on a weekly chart, you'll notice a Head & Shoulders Bottom spanning seven months, from June 2022 to January 2023. Extending the neckline forward by a few months, you can see how it provided ample support twice, with the market reacting with a strong rejection toward the upside in March.
How's the Buying Pressure and Momentum Looking?
This is an important question to ask, since a breakout can only go so far as momentum and (in this case) money flow can take it.
The Chaikin Money Flow (CMF) shows a significant surge in buying pressure starting at the right shoulder (RS) preceding the breakout. But let's double-check that reading by pulling up the Accumulation Distribution Line for a second opinion. Looking at both indicators (one panel on top of the other), you see a similar reading (marginal note: the breakout of the line coincides with EWJ's breakout from the formation). As for momentum, the Relative Strength Index (RSI) gives a promising reading, as it exceeded the 50 level (centerline) well before the CMF and Accumulation Distribution turned positive.
Overall, the weekly chart paints a bullish picture. But on a smaller and more tactical scale, where might you find a good entry point? And is EWJ due for a pullback? If so, how deep might it go?
Look Back Further
The ironic thing is that to get a sense of what's up ahead, you have to look backward. To make sure you're seeing what this bullish trajectory is heading into, let's zoom out even further to see the price action over three years.
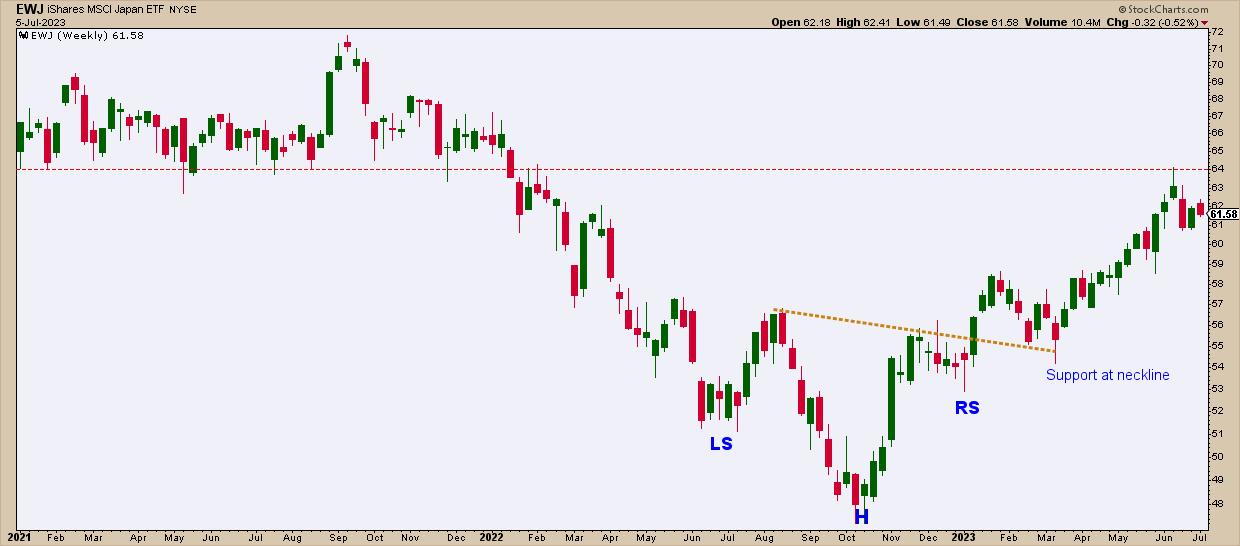
CHART 3: A THREE-YEAR VIEW OF EWJ'S WEEKLY CHART. Note the significance of the $64 price level.Chart source: StockCharts.com (click on chart for live version). For illustrative purposes only.
Did you notice how EWJ hit resistance at $64.11 on June 14? Well, now you can see why. The $64 level was a critical support level for 2021. It was eventually broken, and bears might look at that level as support-turned-resistance.
This means that $64 is a critical resistance level EWJ must break above and hold if Japan's market resurgence has any staying power. If you're bullish on this prospect, you could consider a few entry points. Let's zoom into the daily chart of EWJ.
Entering a Long Position in EWJ
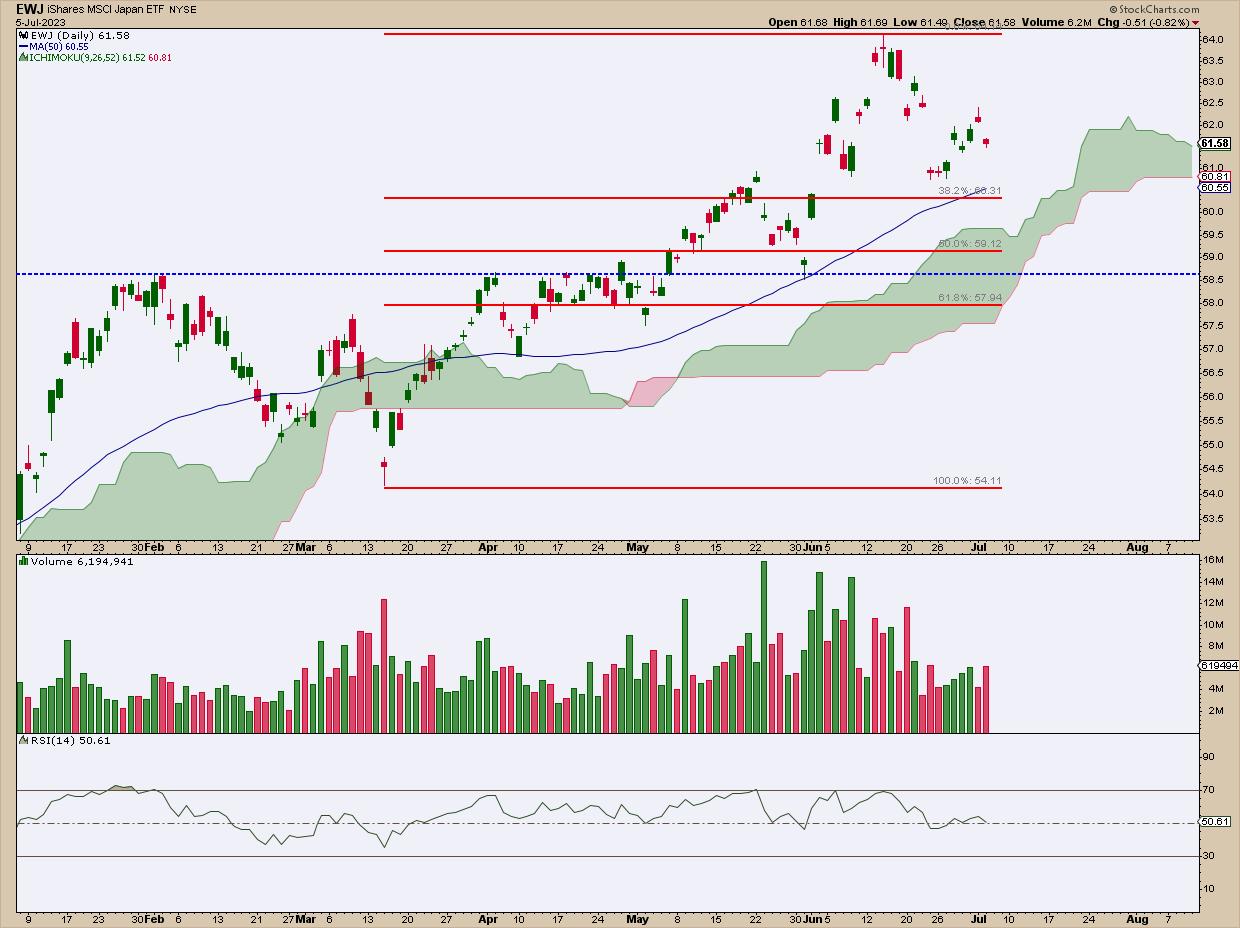
CHART 4: DAILY CHART OF EWJ. Note several potential levels of support, all of which can be viewed as potential buy targets. Beware of price falling below the 61.8% Fib retracement line.Chart source: StockCharts.com (click on chart for live version). For illustrative purposes only.
BIG CAVEAT: If you look at any of the weekly charts, you'll realize that "buying the dip" now means making an entry relatively high up in its price trajectory. If you're comfortable with that, there are a few things to consider.
- The RSI is still holding above the centerline (50), which is a bullish sign that momentum, despite EWJ's pullback, is sustaining itself for now. Also, EWJ hadn't entered overbought levels as it hit its $64.00 high.
- Price seems to be coasting steadily along the 50-day simple moving average (and notice the Ichimoku Cloud following slightly below the moving average). Both seem to support the near-term trend, but they also distract from the likelihood that EWJ could exhibit a deeper pullback in the weeks ahead.
- And if that deeper pullback does occur, support at $58.50 (resistance turned support) and the general range between the Fibonacci levels of 50% and 61.8% should serve as a cushion for a bounceback (Fib retracement drawn from the second leg of EWJ's uptrend).
If price falls below these levels, then EWJ is subject to an even deeper correction. In that case, you might want to check the fundamental picture, and if it still warrants a bullish outlook, then you'd have to readjust your technical setup for a more suitable entry point.
Other Japanese ETFs to Look Into
EWJ is the largest ETF in the US market that gives you exposure to Japanese stocks. But there are a few smaller ETFs worth mentioning.
- JPMorgan BetaBuilders Japan ETF (BBJP) follows the Morningstar Japan Target Market Exposure Index, with 273 stocks in its basket. Major sectors are Industrials and Consumer Discretionary.
- WisdomTree Japan Hedged Equity Fund (DXJ) provides exposure to the Japanese equity market while hedging U.S. dollar/yen fluctuations.
- Xtrackers MSCI Japan Hedged Equity ETF (DBJP) tracks the MSCI Japan US Dollar Hedged Index, mitigating exposure to dollar/yen fluctuations.
Remember to pick your ETFs carefully.

You can research each of the ETFs using the Symbol Summary tool on StockCharts.com. You'll find technical data, fundamental data, and other fund details. You'll also find predefined scans, alerts, and ChartLists for a specific symbol.
What if Japan's Economy Doesn't Have Staying Power?
Don't ignore the risks. Some experts say that there needs to be a clear sign Japan has regained the kind of economic dynamism it had in the 70s and 80s.
Consider Japan's stock market and real estate bubble burst in the early 1990s, policy errors, demographic challenges, and China's rise as an economic and political super-power. All have hindered Japan's economic recovery.
There are also reasons to be skeptical of the rally: deflationary pressures, complex corporate governance practices, and an aging population with a rapidly declining workforce—not the most promising precursor for re-invigorated global competition. Still, Buffett praised Japan's economic potential and resilience and plans to hold these investments for around 10 to 20 years. Perhaps the Oracle of Omaha sees something that most of us can't (yet).
The Bottom Line
After three decades in the shadows, Japanese stocks seem poised for a significant comeback. Factors such as improved governance standards, cheap stocks relative to the US market, a depreciated yen, and record dividends have all contributed to this resurgence. Also, Japan's booming chip-making industry may be a good way to invest in semiconductor and AI (artificial intelligence) developments, especially in light of US-China tensions.
The article presents a technical scenario and potential entry points if you're looking to gain Japanese stock exposure at this stage of the game. Just mind the technical and fundamental risks associated with such an entry. While some experts believe this Japanese resurgence has staying power, the jury, overall, is still out.