TAKEAWAYS
- Positive momentum in the stock market is driving equities higher
- If earnings continue to be upbeat, the S&P 500 could reach its all time high
- Weaker US dollar is pushing commodity prices higher
As the trading week ends, the better-than-expected earnings from three big banks, Delta Airlines (DAL), and Pepsi Co (PEP) added more excitement to end an exciting trading week.
The one sticking point is the University of Michigan consumer sentiment survey, which showed that confidence in the economy boomed but suggested that inflation may not be as soft as the CPI and PPI indicated earlier this week. That news saw a bit of a selloff in the S&P 500 index ($SPX) and the Nasdaq Composite ($COMPQ) but the Dow Jones Industrial Average ($INDU) closed higher, its best weekly performance since March. Communication Services and Technology sectors are still holding strong, which has brought more investor optimism into the financial market.
You have probably heard about how the largest seven stocks have been driving the stock market rally. But it looks like other stocks are joining that rally. If you look up the chart of the Direxion Nasdaq-100 Equal Weighted Index (QQQE) and compare it with the Invesco QQQ Trust (QQQ), the two have been moving in sync more recently. And the Accumulation/Distribution line in the lower panel shows that accumulation is rising—an indication of good upside follow-through.
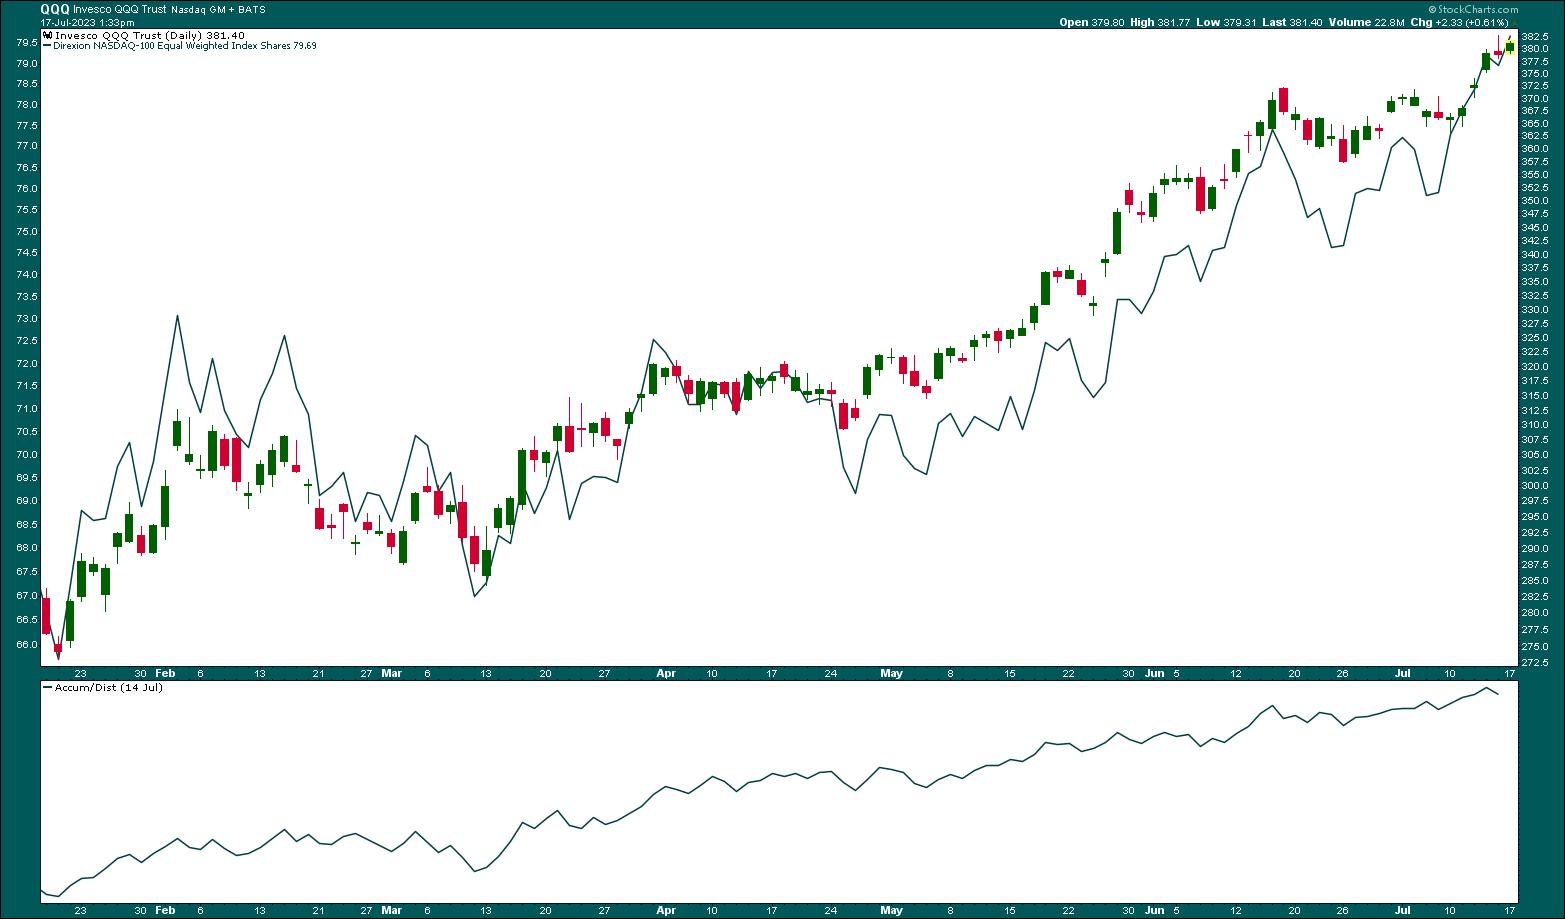
CHART 1: MARKET PARTICIPATION IS BROADENING. QQQE and QQQ are moving in sync, and accumulation is trending higher. Chart source: StockCharts.com (click on chart for live version). For educational purposes.
There's a lot of positive momentum in the market. Many stocks are reaching new all-time highs or 52-week highs. If you run these two scans, you may be surprised at the number of stocks and ETFs that meet the scan criteria.
 How to Run Scans. From Your Dashboard or Charts & Tools, scroll down to the Sample Scan Library. Click Browse Scan Library and run the New All-Time Highs and New 52-Week Highs scans.
When so many stocks and ETFs are reaching new highs, it's hard to argue against a bull market. Great traders trade with the trend. And when the market has strong momentum behind it, it's best to take advantage of trading opportunities.
There's the likelihood of many of these stocks reaching overbought levels, which may make them pullback candidates. Using shorter moving averages such as the 20- or 25-day can act as an initial support level for a pullback. One example is the daily chart of Nvidia Corp. (NVDA) below.
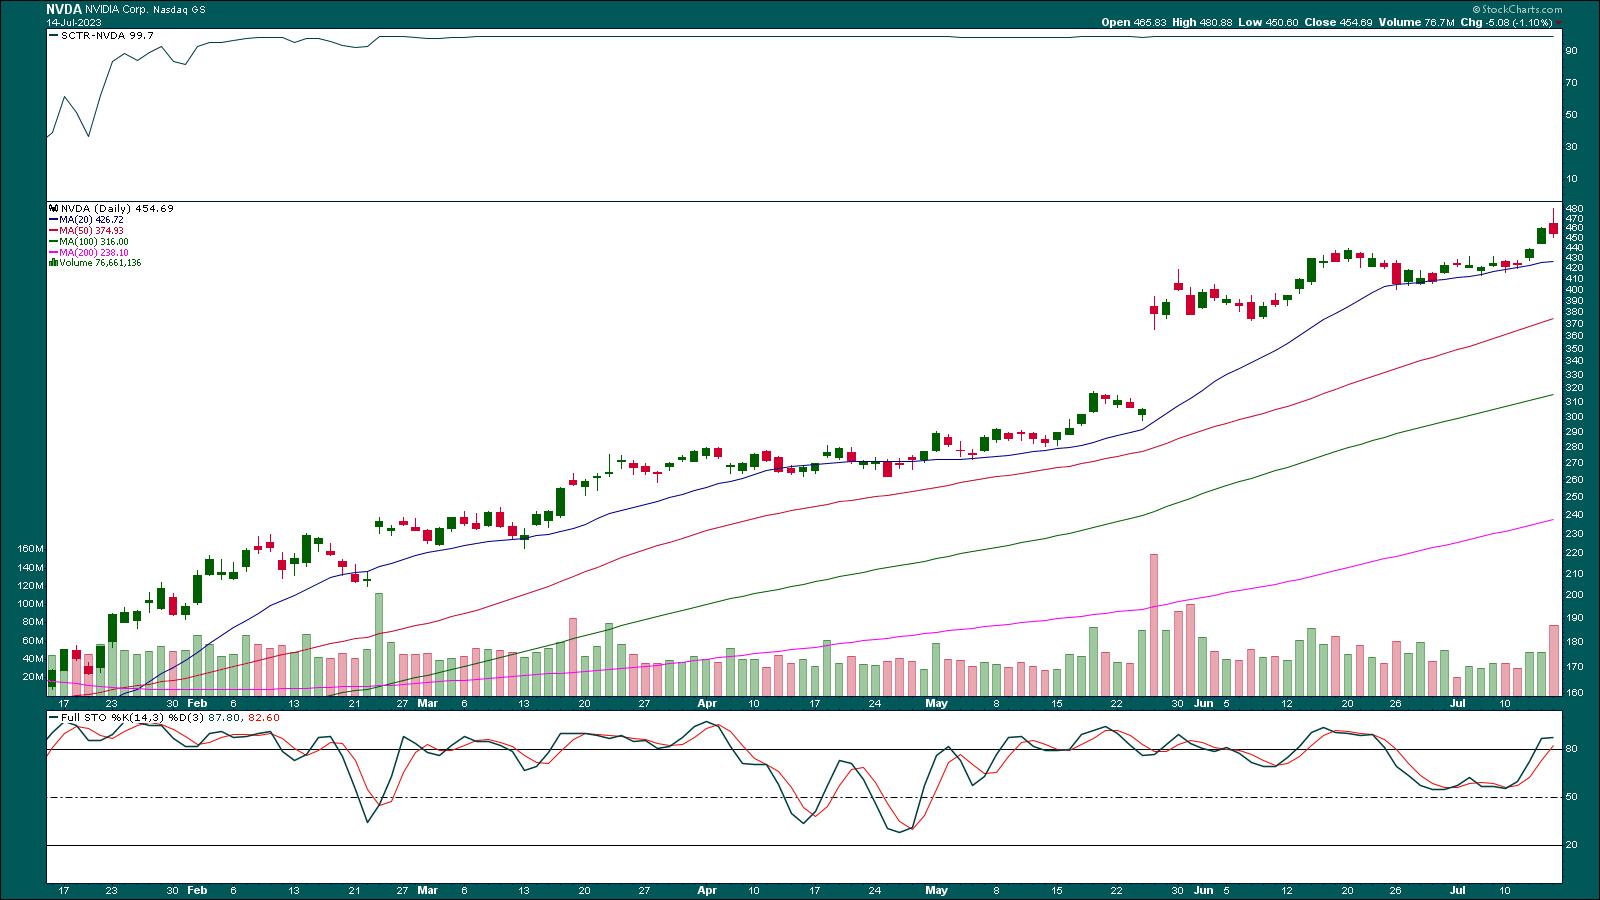
IS NVDA READY FOR A PULLBACK? NVDA may be entering overbought territory. Keep an eye on the stochastic oscillator, especially if the stock pulls back to its 20-day moving average. Chart source: StockCharts.com (click chart for live version). For educational purposes.
NVDA has been a top-ranking SCTR candidate since February 2023. Looking at the Stochastic Oscillator in the bottom panel, you see that, when the stock pulled back to its 20-day moving average, the stochastic fell. But the stochastic didn't reach the 50 level. When NVDA bounced off the 20-day MA and rallied higher, the stochastic oscillator turned higher and moved into overbought territory. Looking at the stochastic oscillator, the stock may have further upside movement. If it pulls back to the 20-day MA, it could present a buying opportunity.
Great traders trade with the trend.
And now that smaller caps, other sectors such as Industrials, and international equities are showing signs of catching up with the larger caps, there may be some lower-priced stocks you can jump on.
Earnings Season is Here
So far, this quarter's earnings have been solid but this is just the start. Next week is chock full of earnings. Wall St. will focus on guidance, since that will indicate what to expect in the future. In a rising market, a little bit of bad news could send stocks lower. So, it's a good idea to keep an eye on the big picture. A couple of points to keep in mind as we head into the thick of earning season:
- The US Dollar Index ($USD) has fallen below 100. The last time the index was at this level was in April 2022. The lower dollar sent gold, silver, and copper prices higher.
- Crude oil prices showed signs of a rebound but fell after hitting resistance at its 200-day moving average.
- Bond yields are also lower. The 10-Year US Treasury Yield Index ($TNX) is trading around 3.8%, which is well below its >4% levels it reached in early July.
The Bottom Line
If the S&P 500 closes above 4500, there's a chance it could reach its all-time high of 4818.62. The index may hit resistance close to the 4637 level (March 2023 highs), but it may not be a very strong level. And if the S&P 500 pulls back, look at the 4200 level as a support, which aligns with the 200-week moving average. It may also be worth keeping an eye on earnings. Some heavyweights are reporting next week (see below for a list), and any mention of weak guidance could impact the stock market.
End of Week Wrap Up
US equity indexes mixed; volatility down
- $SPX down 0.10% at 4505.42, $INDU up 0.33% at 34509.03 (best week since March); $COMPQ down 0.18% at 14113.70
- $VIX down 2.28% at 13.30
- Best performing sector for the week: Consumer Discretionary
- Worst performing sector for the week: Energy
- Top 5 Large Cap SCTR stocks: Super Micro Computer, Inc. (SMCI), NVIDIA Corp. (NVDA), Coinbase Global Inc. (COIN), Palantir Technologies, Inc. (PLTR), DraftKings Inc. (DKNG)
On the Radar Next Week
- Earnings season in full swing. Some companies reporting next week: Bank of America (BAC), Morgan Stanley (MS), Charles Schwab (SCWB), Goldman Sachs (GS); Tesla (TSLA), Netflix (NFLX), United Airlines (UAL), American Airlines (AAL), Taiwan Semiconductor Manufacturing Co. (TSMC), Johnson and Johnson (JNJ), and much more.
- June US Retail Sales
- June US Housing Starts
- July Philadelphia Fed Manufacturing Index

Disclaimer: This blog is for educational purposes only and should not be construed as financial advice. The ideas and strategies should never be used without first assessing your own personal and financial situation, or without consulting a financial professional.
Happy charting!
