
It was quite a week in the stock market. The early part was relatively calm, but then things got a little hairy. You can thank the Fitch Ratings downgrade of US long-term debt from AAA to AA+ for the quick pivot in investor sentiment.
The reason for the downgrade: "Expected fiscal deterioration over the next three years, an erosion of governance in light of repeated debt-limit political standoffs, and a generally growing debt burden." The last time something similar to this happened was in 2011, when Standard & Poor's downgraded US credit.
When the news was released—after Tuesday's close—S&P 500 futures fell. This carried forward into the next trading day as stocks opened lower. And while equities sold off, Treasury yields and the US dollar moved higher.
A Short-Lived Hiccup?
It remains to be seen how much of an impact the Fitch downgrade had on the stock market. One thing is for sure: investors become more cautious.
Earnings. After Amazon (AMZN) reported positive earnings and upbeat guidance, the stock price rallied in after-hours trading. The company's revenues from its cloud-computing unit, AWS, helped lift other cloud stocks. Things weren't so great for Apple (AAPL). While it also beat Wall Street estimates, the slowdown in overall sales didn't help the stock much. AAPL stock price fell and is trading below its 50-day simple moving average (SMA).
July jobs report. Now that earnings season is beginning to wrap up, investors were eagerly awaiting the jobs report data. Non-farm payrolls were up 187,000, less than the 200,000 economists expected. It's also the lowest level since December 2020, which is encouraging in that job growth is slowing. But there are some sticky areas. The 3.5% unemployment rate is slightly lower than last month's, and average hourly earnings went up by 0.4%. This suggests that the labor market is still tight.
Labor participation has flatlined, which could be because a large segment of people are retiring. And the number of new participants seems to stay the same as the number leaving the workforce.
Investors may be worried the Fed isn't getting inflation down to 3%. Energy prices are going up, as are food and services prices. Despite these possible headwinds, the jobs report was considered optimistic.
Market pullback. In the daily chart of the S&P 500 index ($SPX) below, you can see that the index pulled back and has moved back below its 21-day EMA. The percentage of S&P 500 stocks above the 200-day moving average and Advance-Decline Percent also dipped during the index's pullback. All indications suggest a potential pullback, which could present buying opportunities if the stock market reverses. Keep an eye on the 50-day SMA as the next support level.
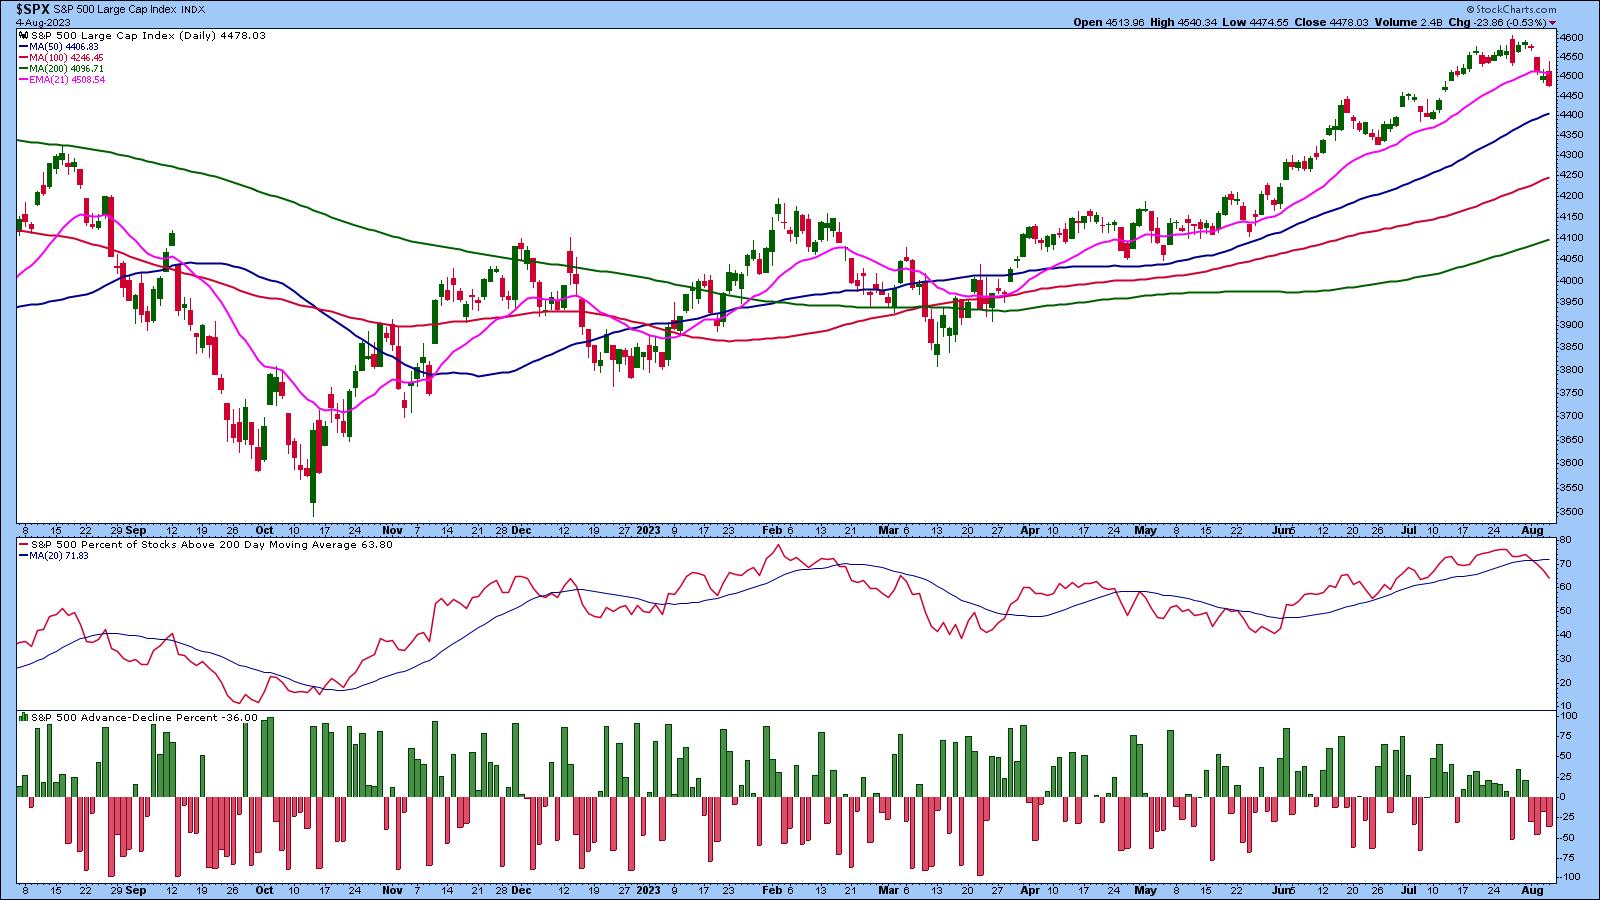
CHART 1: S&P 500 INDEX ($SPX) PULLS BACK. The index dipped below its 21-day EMA and is approaching its next support level at the 50-day SMA.Chart source: StockCharts.com (click chart for live version). For educational purposes.
After the Fitch Ratings' downgrade and the Treasury's plans to borrow $1 trillion, it's worth looking at other assets besides equities. The 10-year US Treasury Yield Index ($TNX) rose to the highest 2023 level as equities sold off. After the July jobs report, 10-year yields moved lower, but remain above 4%. This brings up the next point—mortgage rates. The 30-year fixed-rate mortgage is close to 7%, the highest rate in about two decades.
It's almost as if the forecast for how long the Fed will continue to raise interest rates keeps getting pushed out further. While some data seems to be trending in the right direction slowly, others seem to be supporting the idea that inflation is still around. If the 10-year yield hovers around 3.75%, it would be healthy for stocks, but if the 10-year yield continues to remain above 4%, stocks may sputter.
Another area to watch closely is crude oil. Price rose to the April 2023 levels, and, if price breaks above $84 a barrel, it could soar higher. If this happens, it could impact inflation, since energy is a large component of household expenses.
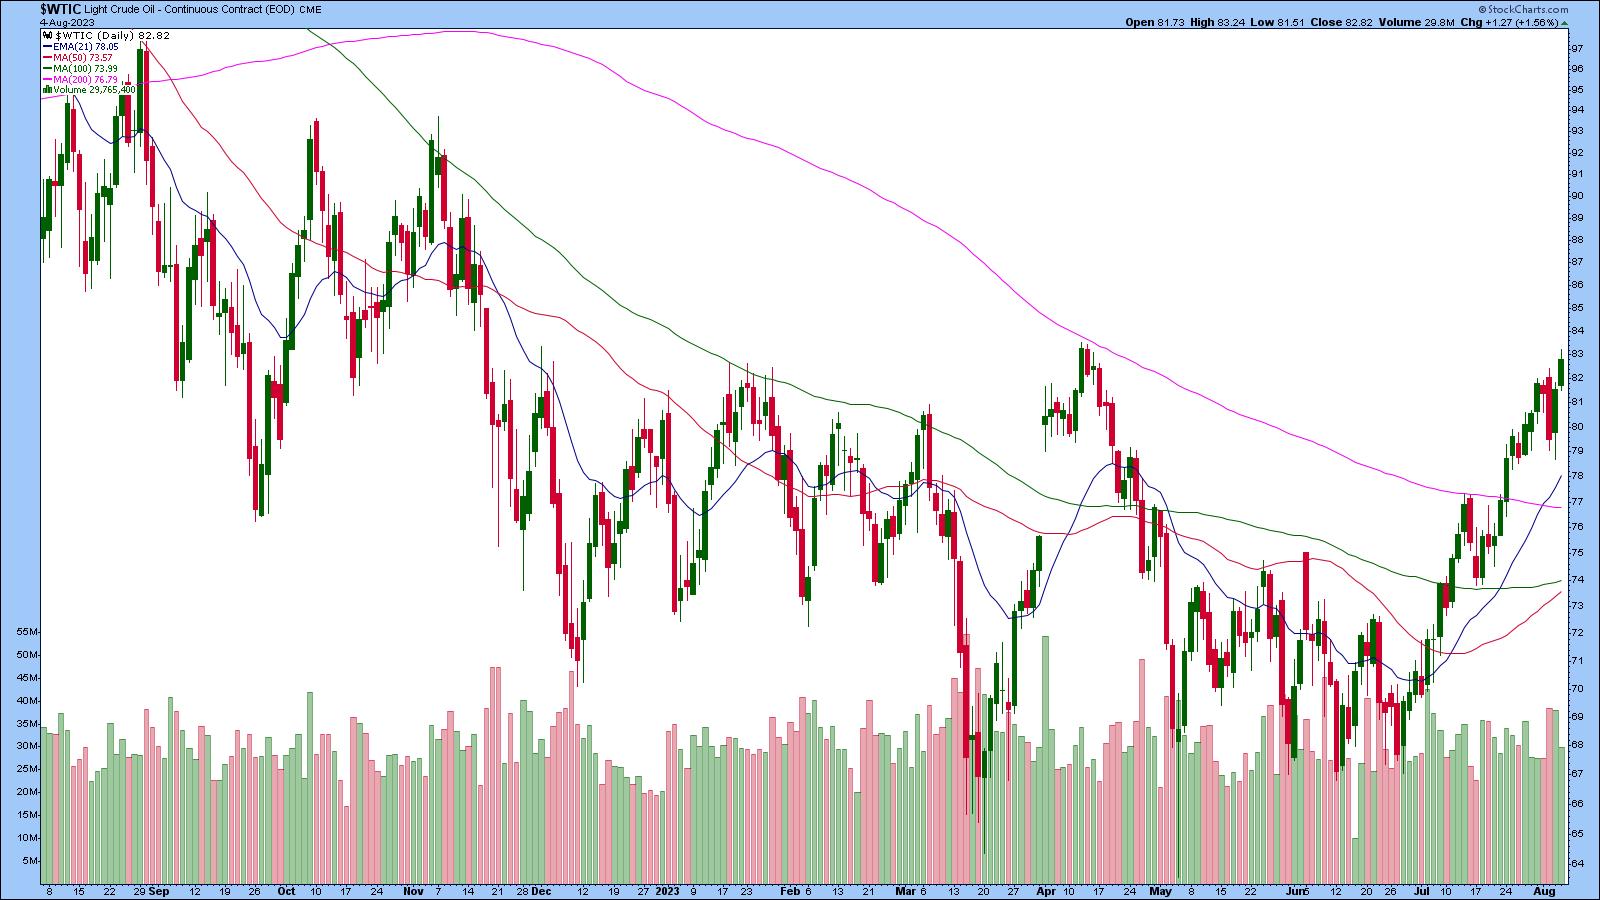 CHART 2: CRUDE OIL PRICES RISE. Crude oil futures are trading well above their 200-day SMA. The rise in oil prices may impact inflation.Chart source: StockCharts.com (click chart for live version). For educational purposes.
End of Week Wrap Up
US equity indexes down; volatility up
- $SPX down 0.53% at 4478.03, $INDU down 0.43% at 35065.62; $COMPQ down 0.36% at 13909.24
- $VIX up 7.41% at 17.10
- Best performing sector for the week: Energy
- Worst performing sector for the week: Utilities
- Top 5 Large Cap SCTR stocks: Super Micro Computer (SMCI), Palantir Technologies (PLTR), Pohang Iron & Steel (PKX), Li Auto (LI), NVIDIA (NVDA)
On the Radar Next Week
- 30-Year Mortgage Rate
- Mortgage applications
- July CPI
- July PPI
- Michigan Consumer Sentiment
Disclaimer: This blog is for educational purposes only and should not be construed as financial advice. The ideas and strategies should never be used without first assessing your own personal and financial situation, or without consulting a financial professional.
Happy charting!
