TAKEAWAYS
- Rising Treasury yields have hurt growth stocks but buying opportunities could lie ahead
- The stock market could bottom at the end of September and present buying opportunities
- Watch Fibonacci levels, Equal Weighted S&P 500 Index, and market breadth for a reversal

Last week wasn't the most optimistic on Wall Street. Even though the US economy is growing, Federal Reserve Chairman Jerome Powell's comments after the Fed meeting weren't what investors wanted to hear.
The Federal Reserve's decision to keep interest rates steady at 5.25–5.50% wasn't a surprise, but the possibility of higher rates for longer than expected could have caused the sell-off in the stock market following Chairman Powell's comments. The broader equity indexes ended lower for the week, with the Nasdaq Composite ($COMPQ) hit the hardest—down 3.6%.
Based on Powell's comments, we can expect one more rate hike in 2023 and maybe only two rate cuts in 2024. In other words, it'll take longer to lower rates, given that the GDP is projected to grow and the labor market remains tight. The lower-than-expected jobless claims number last week supports the possibility of inflation continuing for longer.
Higher Interest Rates
Higher interest rates aren't great for growth stocks. If Treasury yields continue to rise or remain high, future earnings of companies that tend to borrow money become less attractive. Higher borrowing costs hurt future cash flows, which could result in lower stock prices.
It's worth watching the chart of the 10-Year Treasury Yield Index ($TNX). The chart below shows that yields have been on a relatively steep ascent and are continuing to move higher. The 10-year Treasury yield is above 4.5%, a level not seen since 2007. If yields continue to move higher, stocks could fall even further, especially the large-cap growth stocks.
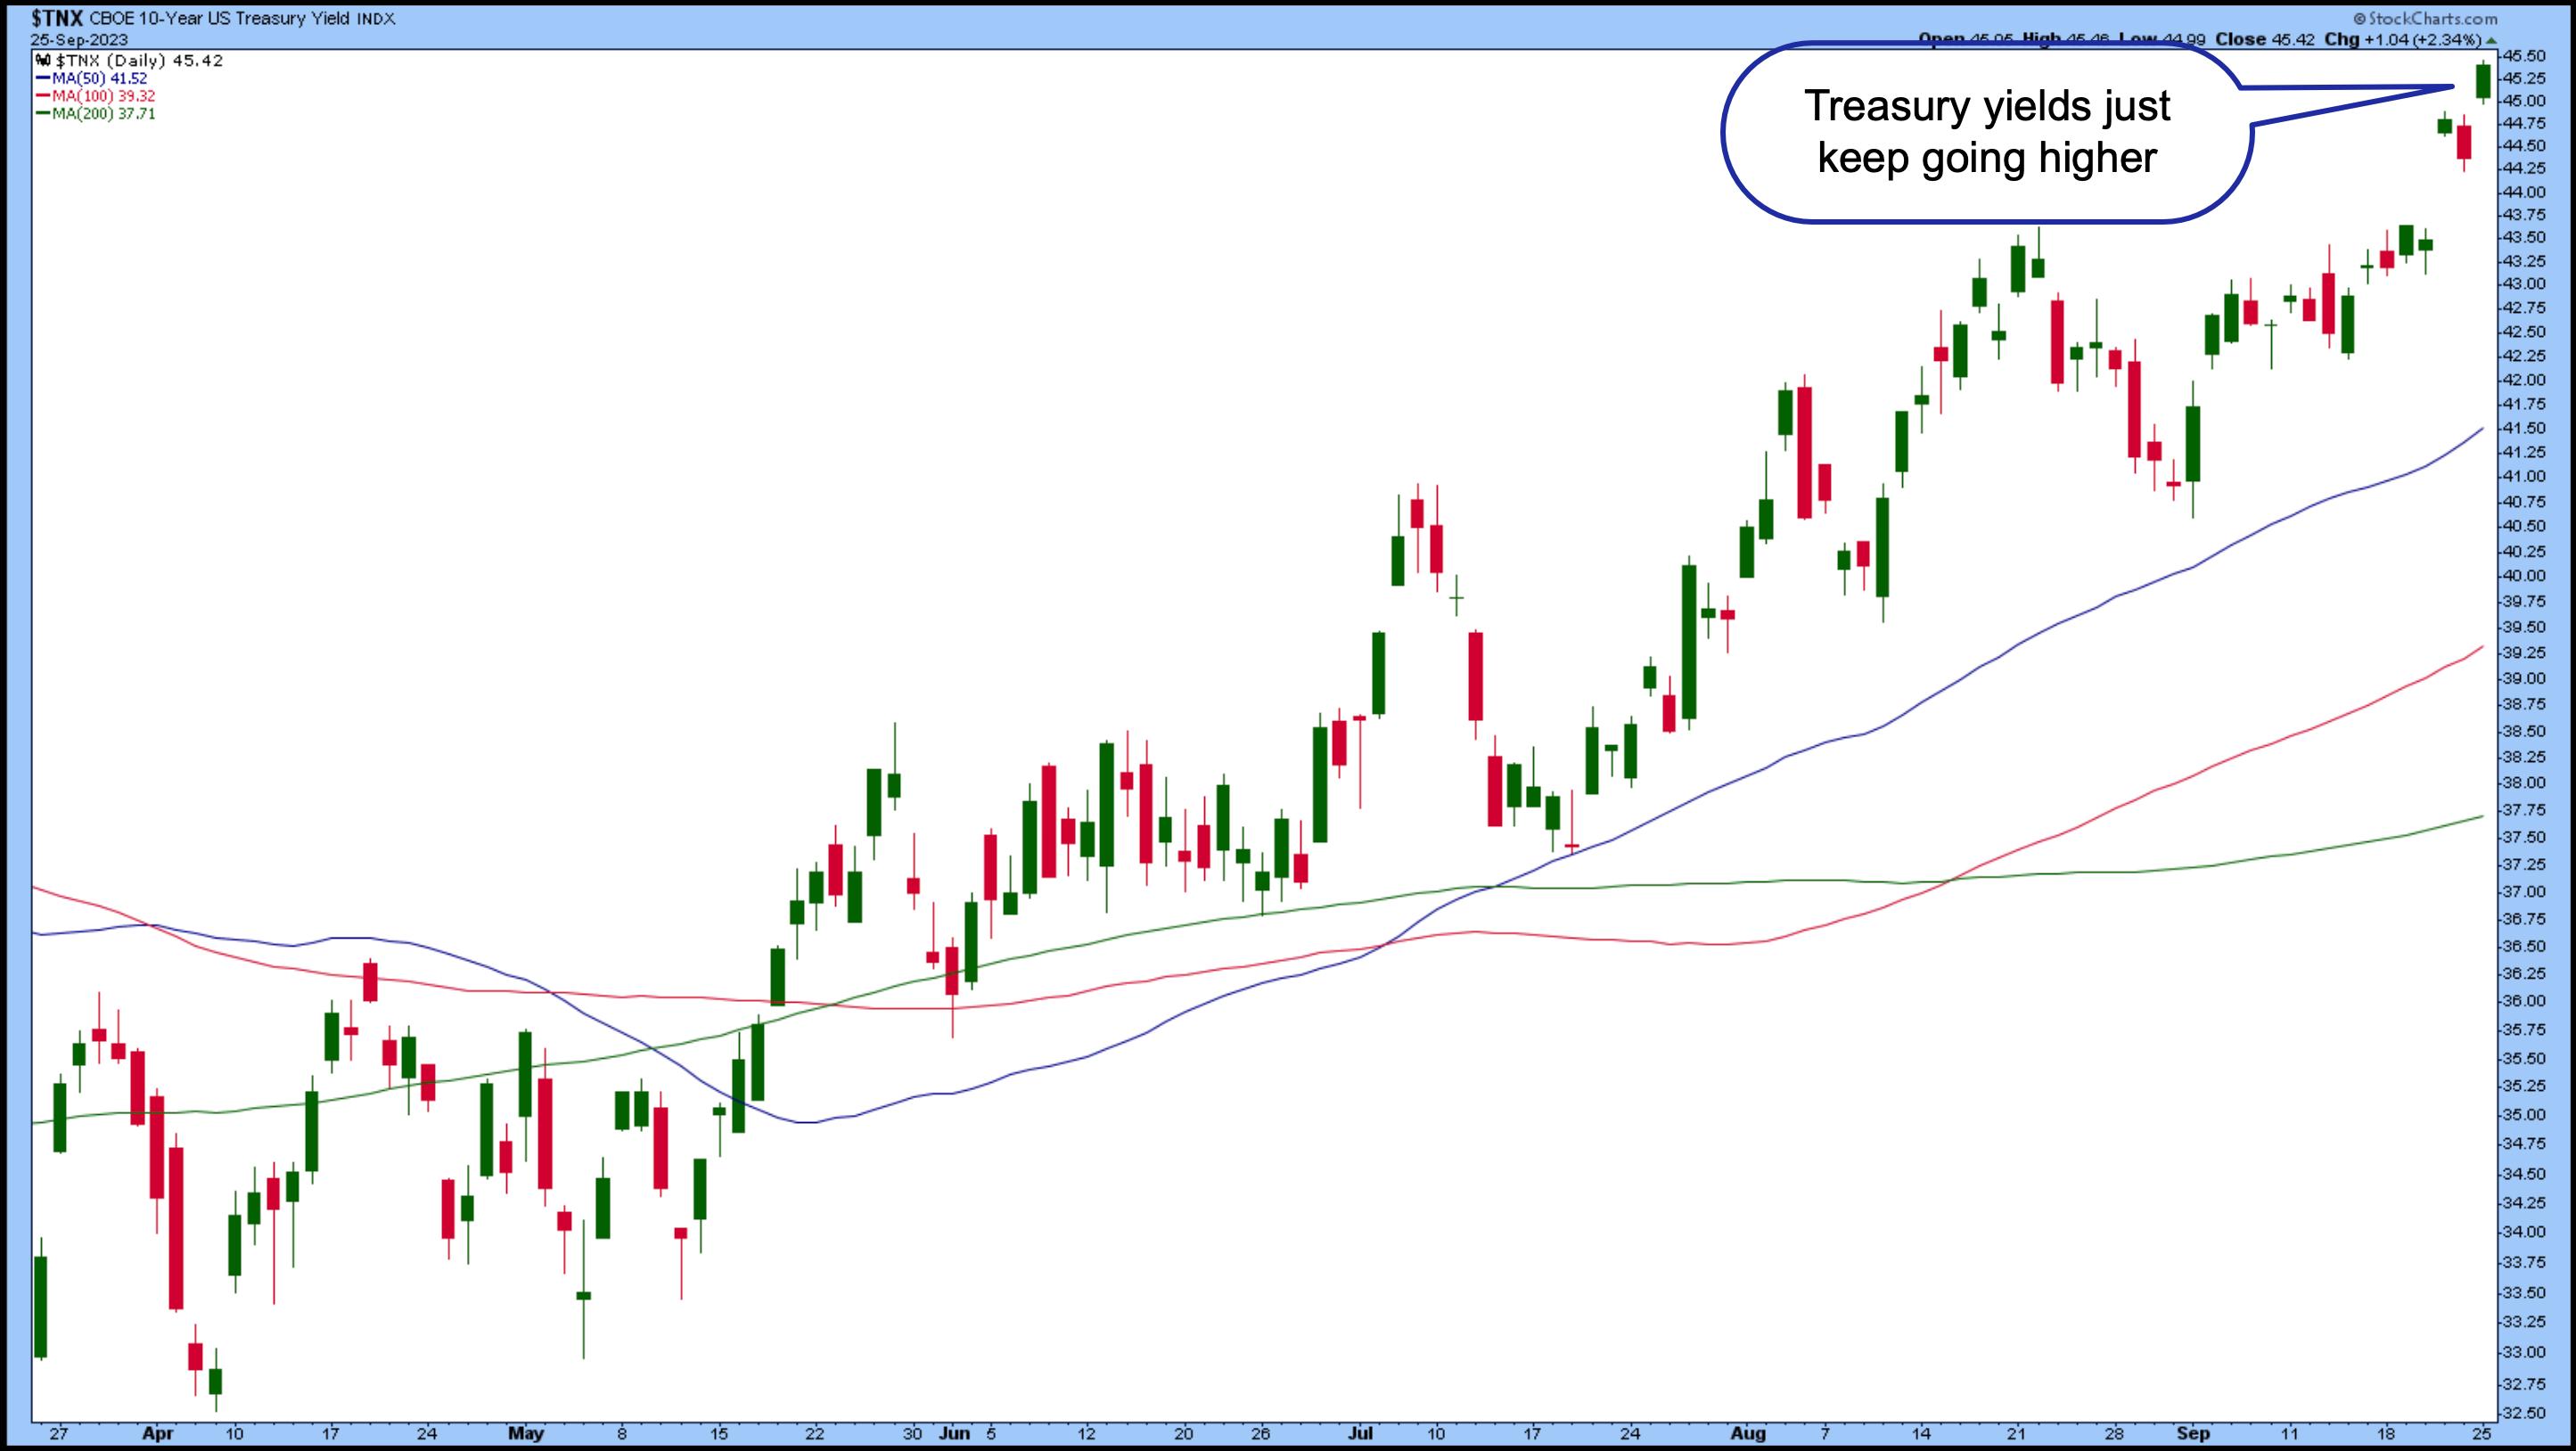
CHART 1: TREASURY YIELDS CONTINUE TO RISE. Rising Treasury yields can be a headwind for growth stocks. Chart source: StockCharts.com. For educational purposes.
If you look at the weekly chart of the Nasdaq Composite with the $TNX overlay, it's interesting to see that from March 2020 to November 2021, the index was moving higher with the $TNX. In November 2021, a few months before the Fed started raising interest rates, the two started diverging. The Nasdaq Composite has dropped below its 100-day moving average. If it breaks below this support and takes out the August low of 13,162, the September pullback could become a reality.
The good news? It could present a buying opportunity. In a recent StockCharts TV episode of Charting Forward, three well-known technical analysts expressed their thoughts on how Q4 would unfold. All three agreed that the fourth quarter tends to be strong, with some sectors, such as Consumer Discretionary, Communication Services, Technology, Industrials, and Financials, likely to outperform. Commodities may also be coming off their base.
If you look at the markets now, your first thought might be it doesn't seem like that's likely to happen after a week. But it's the stock market and it can turn on a dime. And given that this type of price action is typical in September, there's a chance that the stock market could take off. All the more reason to watch the charts.
Charting Your Course With 3 Charts
Turning to the S&P 500, the weekly chart below displays that the index is at a critical support level at the 61.8% Fibonacci retracement level (using the January 2022 high and October 2022 low) and struggling to stay there. The 50% retracement level is an interesting one since it closely aligns with the support of the 100- and 50-week moving average.
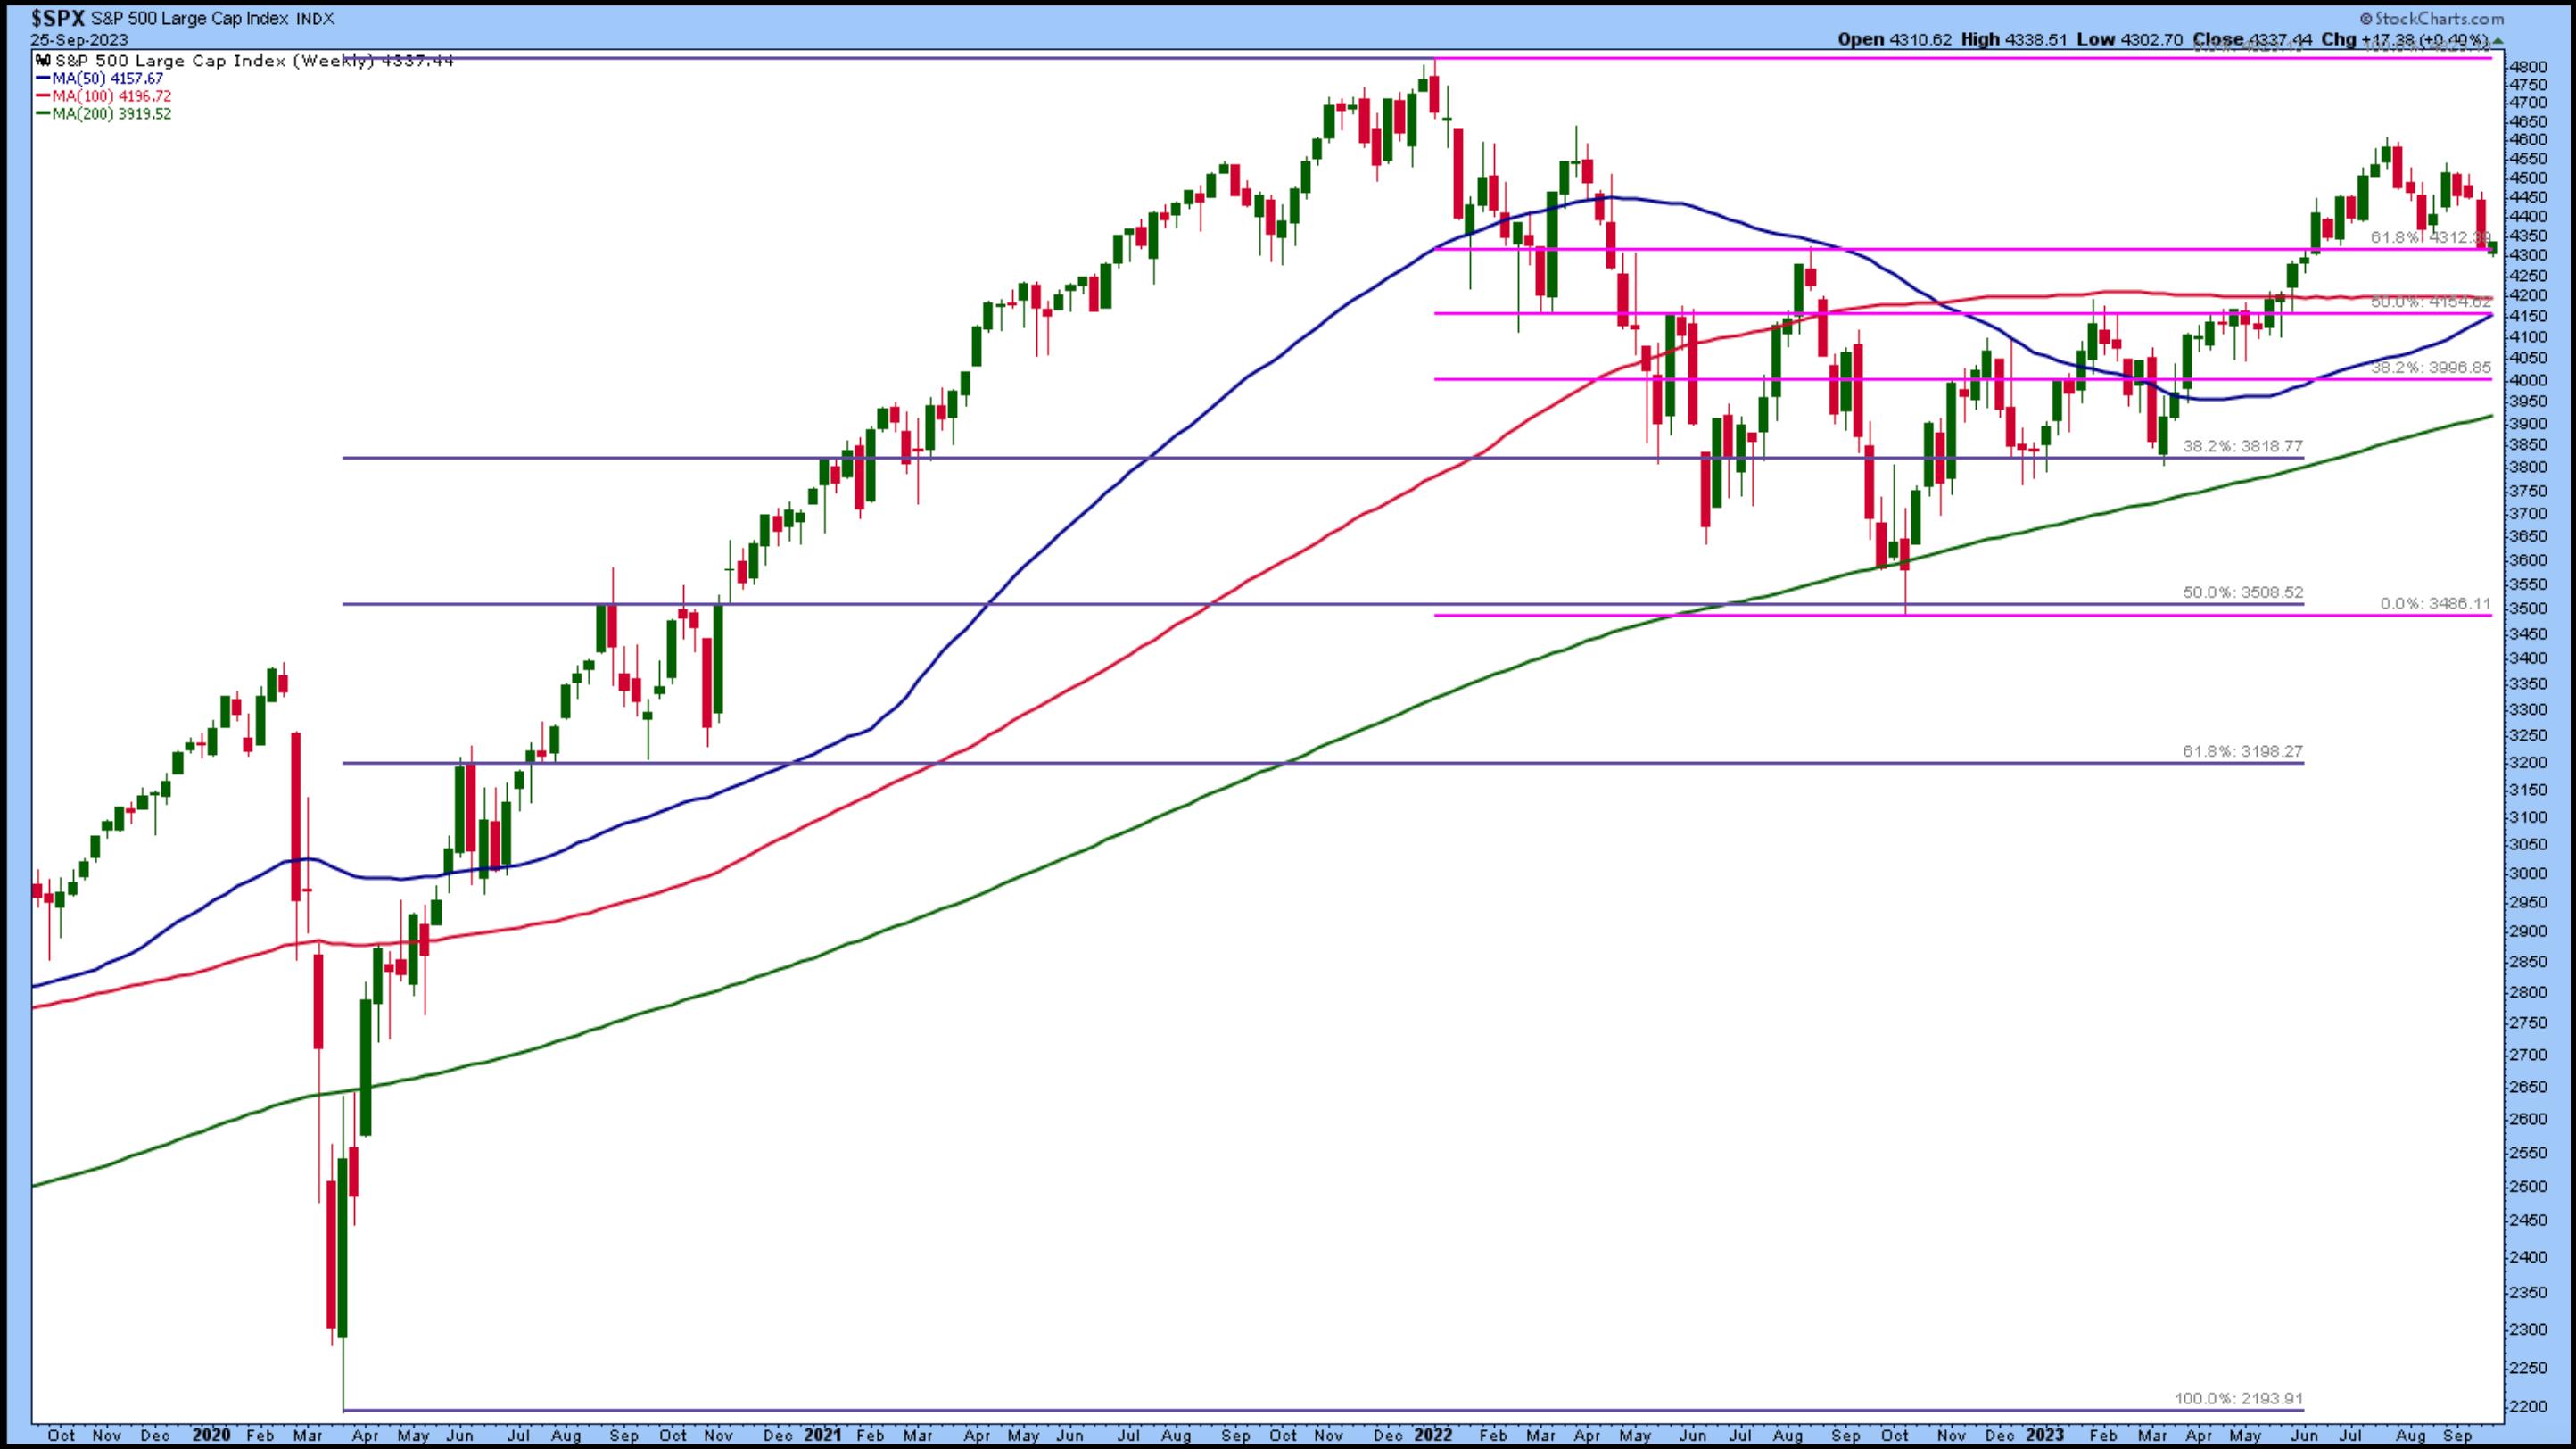
CHART 2: WATCH THE 61.8% AND 50% FIBONACCI RETRACEMENT LEVELS. Depending on how low the S&P 500 index goes, the Fibonacci retracement levels could be reversal points. The S&P 500 is struggling to hold the 61.8% level. The next few days should tell more about the index's directional move. Chart source: StockCharts.com. For educational purposes.
If the S&P 500 breaks below the 61.8% Fib retracement level, the index could likely hit that 50% level of 4160. A reversal from either of these Fibonacci levels could present buying opportunities.
Another chart to pay attention to is the S&P 500 Equal Weighted Index ($SPXEW). The index has been trending lower since the end of July. The chart below of $SPXEW is overlaid with the Invesco S&P 500 Top 50 ETF (XLG), a fund with pretty strong exposure to the Magnificent Seven stocks. The chart gives you a pretty good idea of how much the two diverge. You can see that the two sometimes move closely, but other times, there's a significant gap between the two. A reversal in $SPXEW or a narrowing of the gap between the two would be encouraging as we head into the end of September.
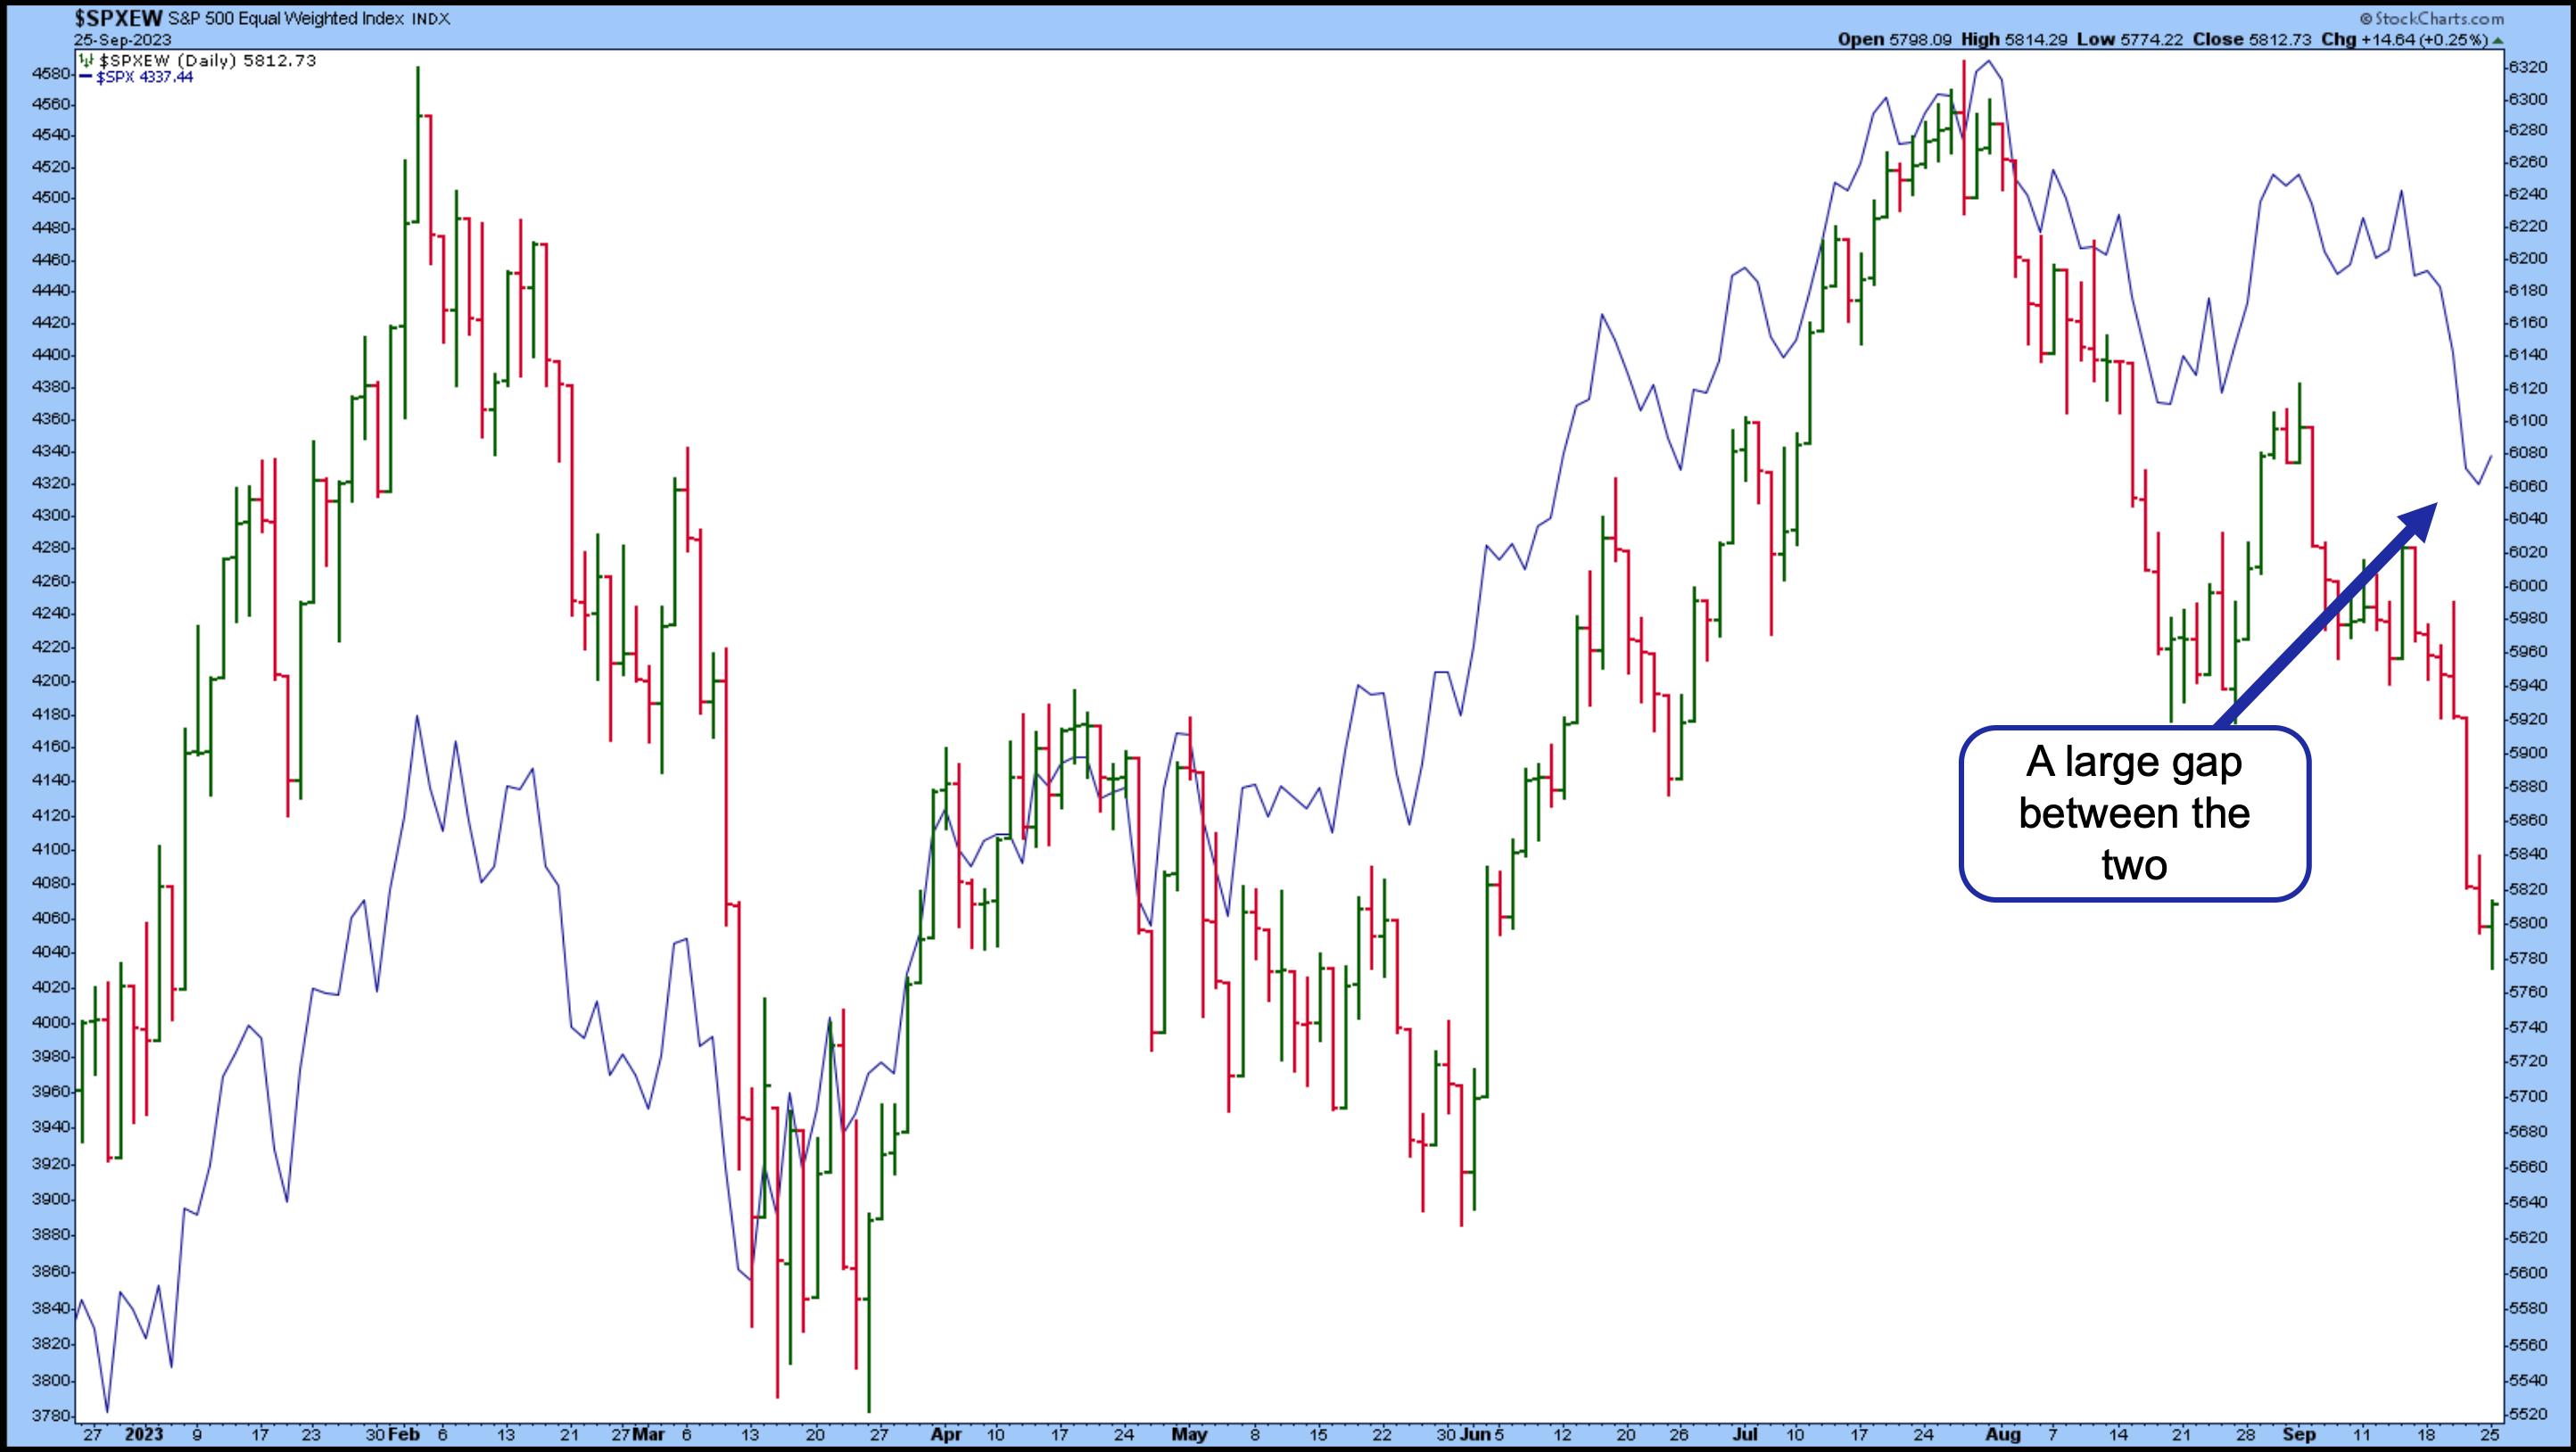
CHART 3: S&P 500 EQUAL WEIGHTED INDEX ($SPXEW) VS. INVESCO S&P 500 TOP 50 ETF (XLG). The gap between the two is pretty wide. Look for the gap between the two to narrow and a reversal in $SPXEW. Chart source: StockCharts.com. For educational purposes.
It's worth viewing the market breadth indicators such as the Advance-Decline Line, the percentage of stocks trading above their 200-day moving average, and the Bullish Percent Index. The chart below displays that market breadth indicators are trending to the downside, meaning market breadth is narrowing.
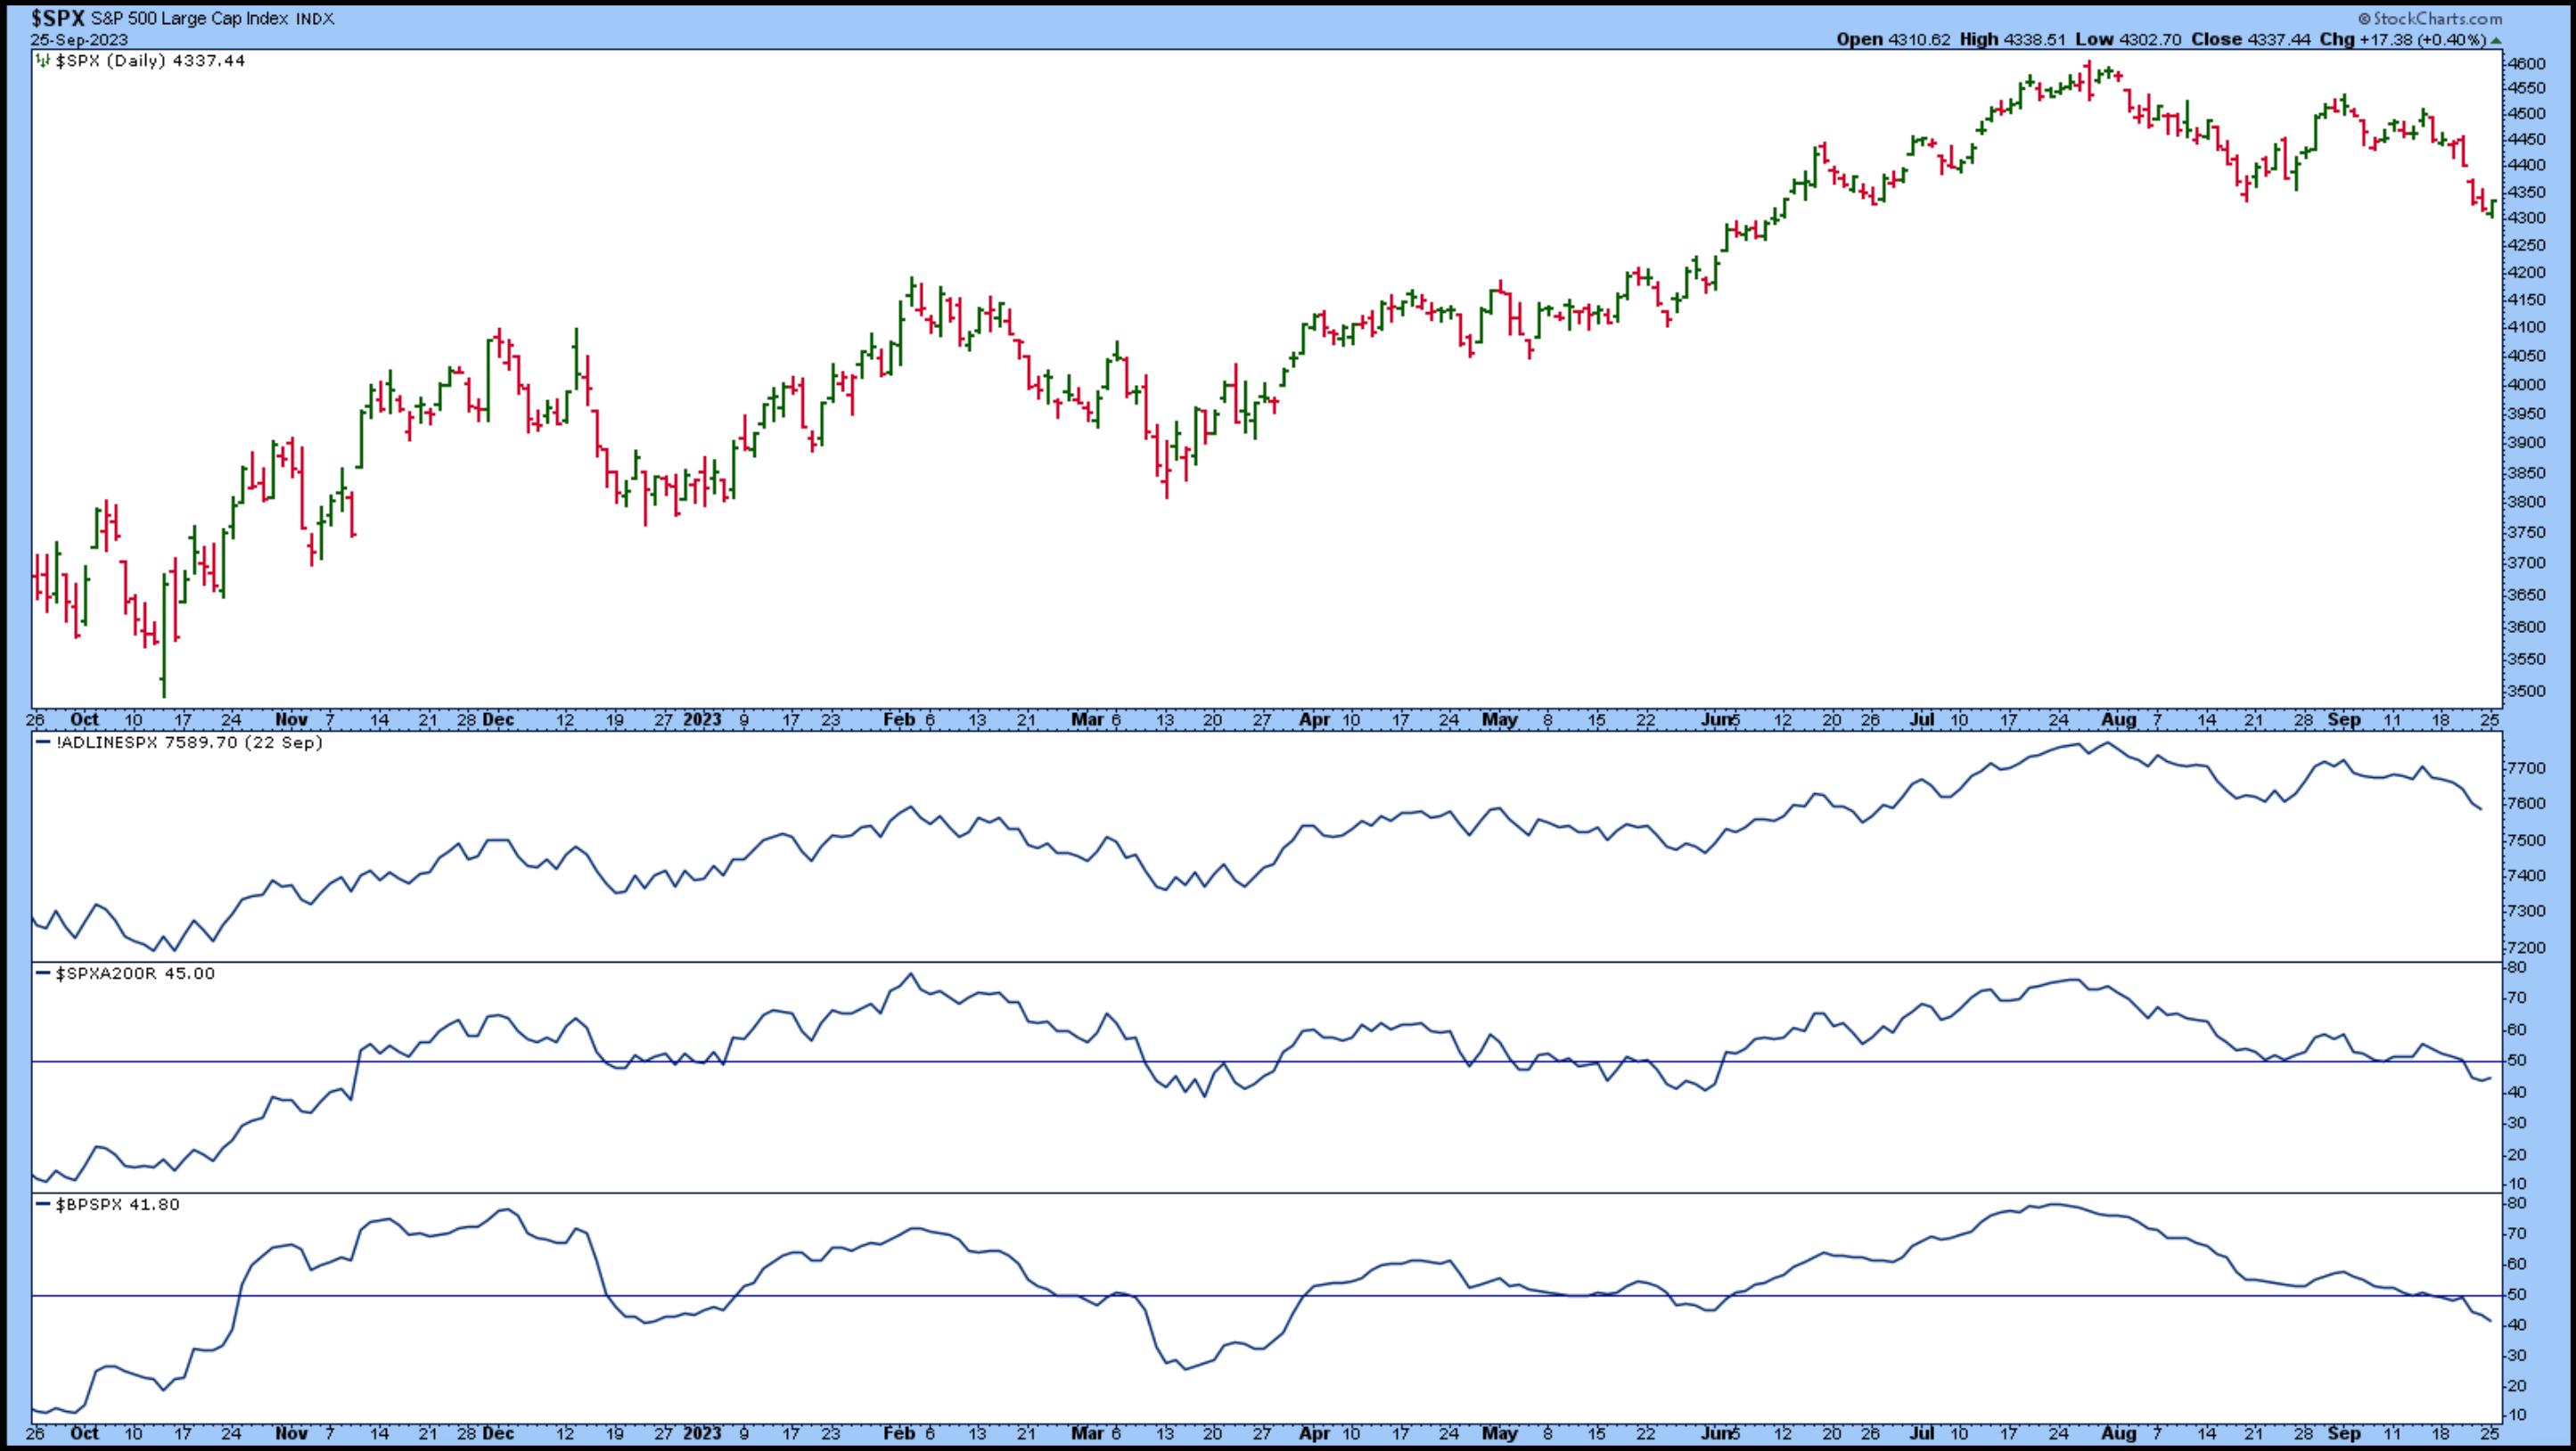
CHART 4: MARKET BREADTH INDICATORS SHOW THAT BREADTH IS NARROWING. The indicators need to reverse before confirming a turnaround in the broader market. Chart source: StockCharts.com. For educational purposes.
Final Thoughts
Let's hope the stock market turns around in October and ends strongly in Q4. According to the Stock Trader's Almanac 2023, October is a "jinx" month, but overall, especially in a pre-election year, October tends to start reversing after a terrible September and can be a great time to buy. The potential headwinds the stock market could face are rising interest rates, rising oil prices, and a possible government shutdown.
Disclaimer: This blog is for educational purposes only and should not be construed as financial advice. The ideas and strategies should never be used without first assessing your own personal and financial situation, or without consulting a financial professional.
Happy charting!
