TAKEAWAYS
- The Dow, S&P 500, and Nasdaq Composite are trading below their 200-day moving averages
- US Treasury yields are taking a breather now but their near-term action could impact equities, especially big tech stocks
- Investors are anxiously awaiting to hear if Fed Chairman Jerome Powell will lean toward being hawkish
When uncertainty prevails, investors become indecisive, which leads to erratic movements from one day to the next. This is what's happening in the market right now. One day, you think the worst is behind you; the next day, the market sings a different tune.
Q3 2023 GDP increased 4.9%, which sent equities lower. A strong labor market didn't ease investor sentiment either. But then, on Friday, the personal consumption expenditures price index (PCD) came in at 3.7%, indicating inflation slowed slightly in September. Investors were more optimistic, especially in the big tech space. Strong earnings from Amazon.com (AMZN) and Intel (INTC) helped reignite investor interest in the technology stocks for most of the trading day, but that fizzled towards the close.
Where Should Investors Turn?
The Nasdaq Composite ($COMPQ) had a rough week, falling below its 200-day moving average. Although the Nasdaq Composite closed higher on Friday, it bounced off its 200-day SMA and closed lower (see chart below). It also broke below its downward-sloping channel (red dashed line).
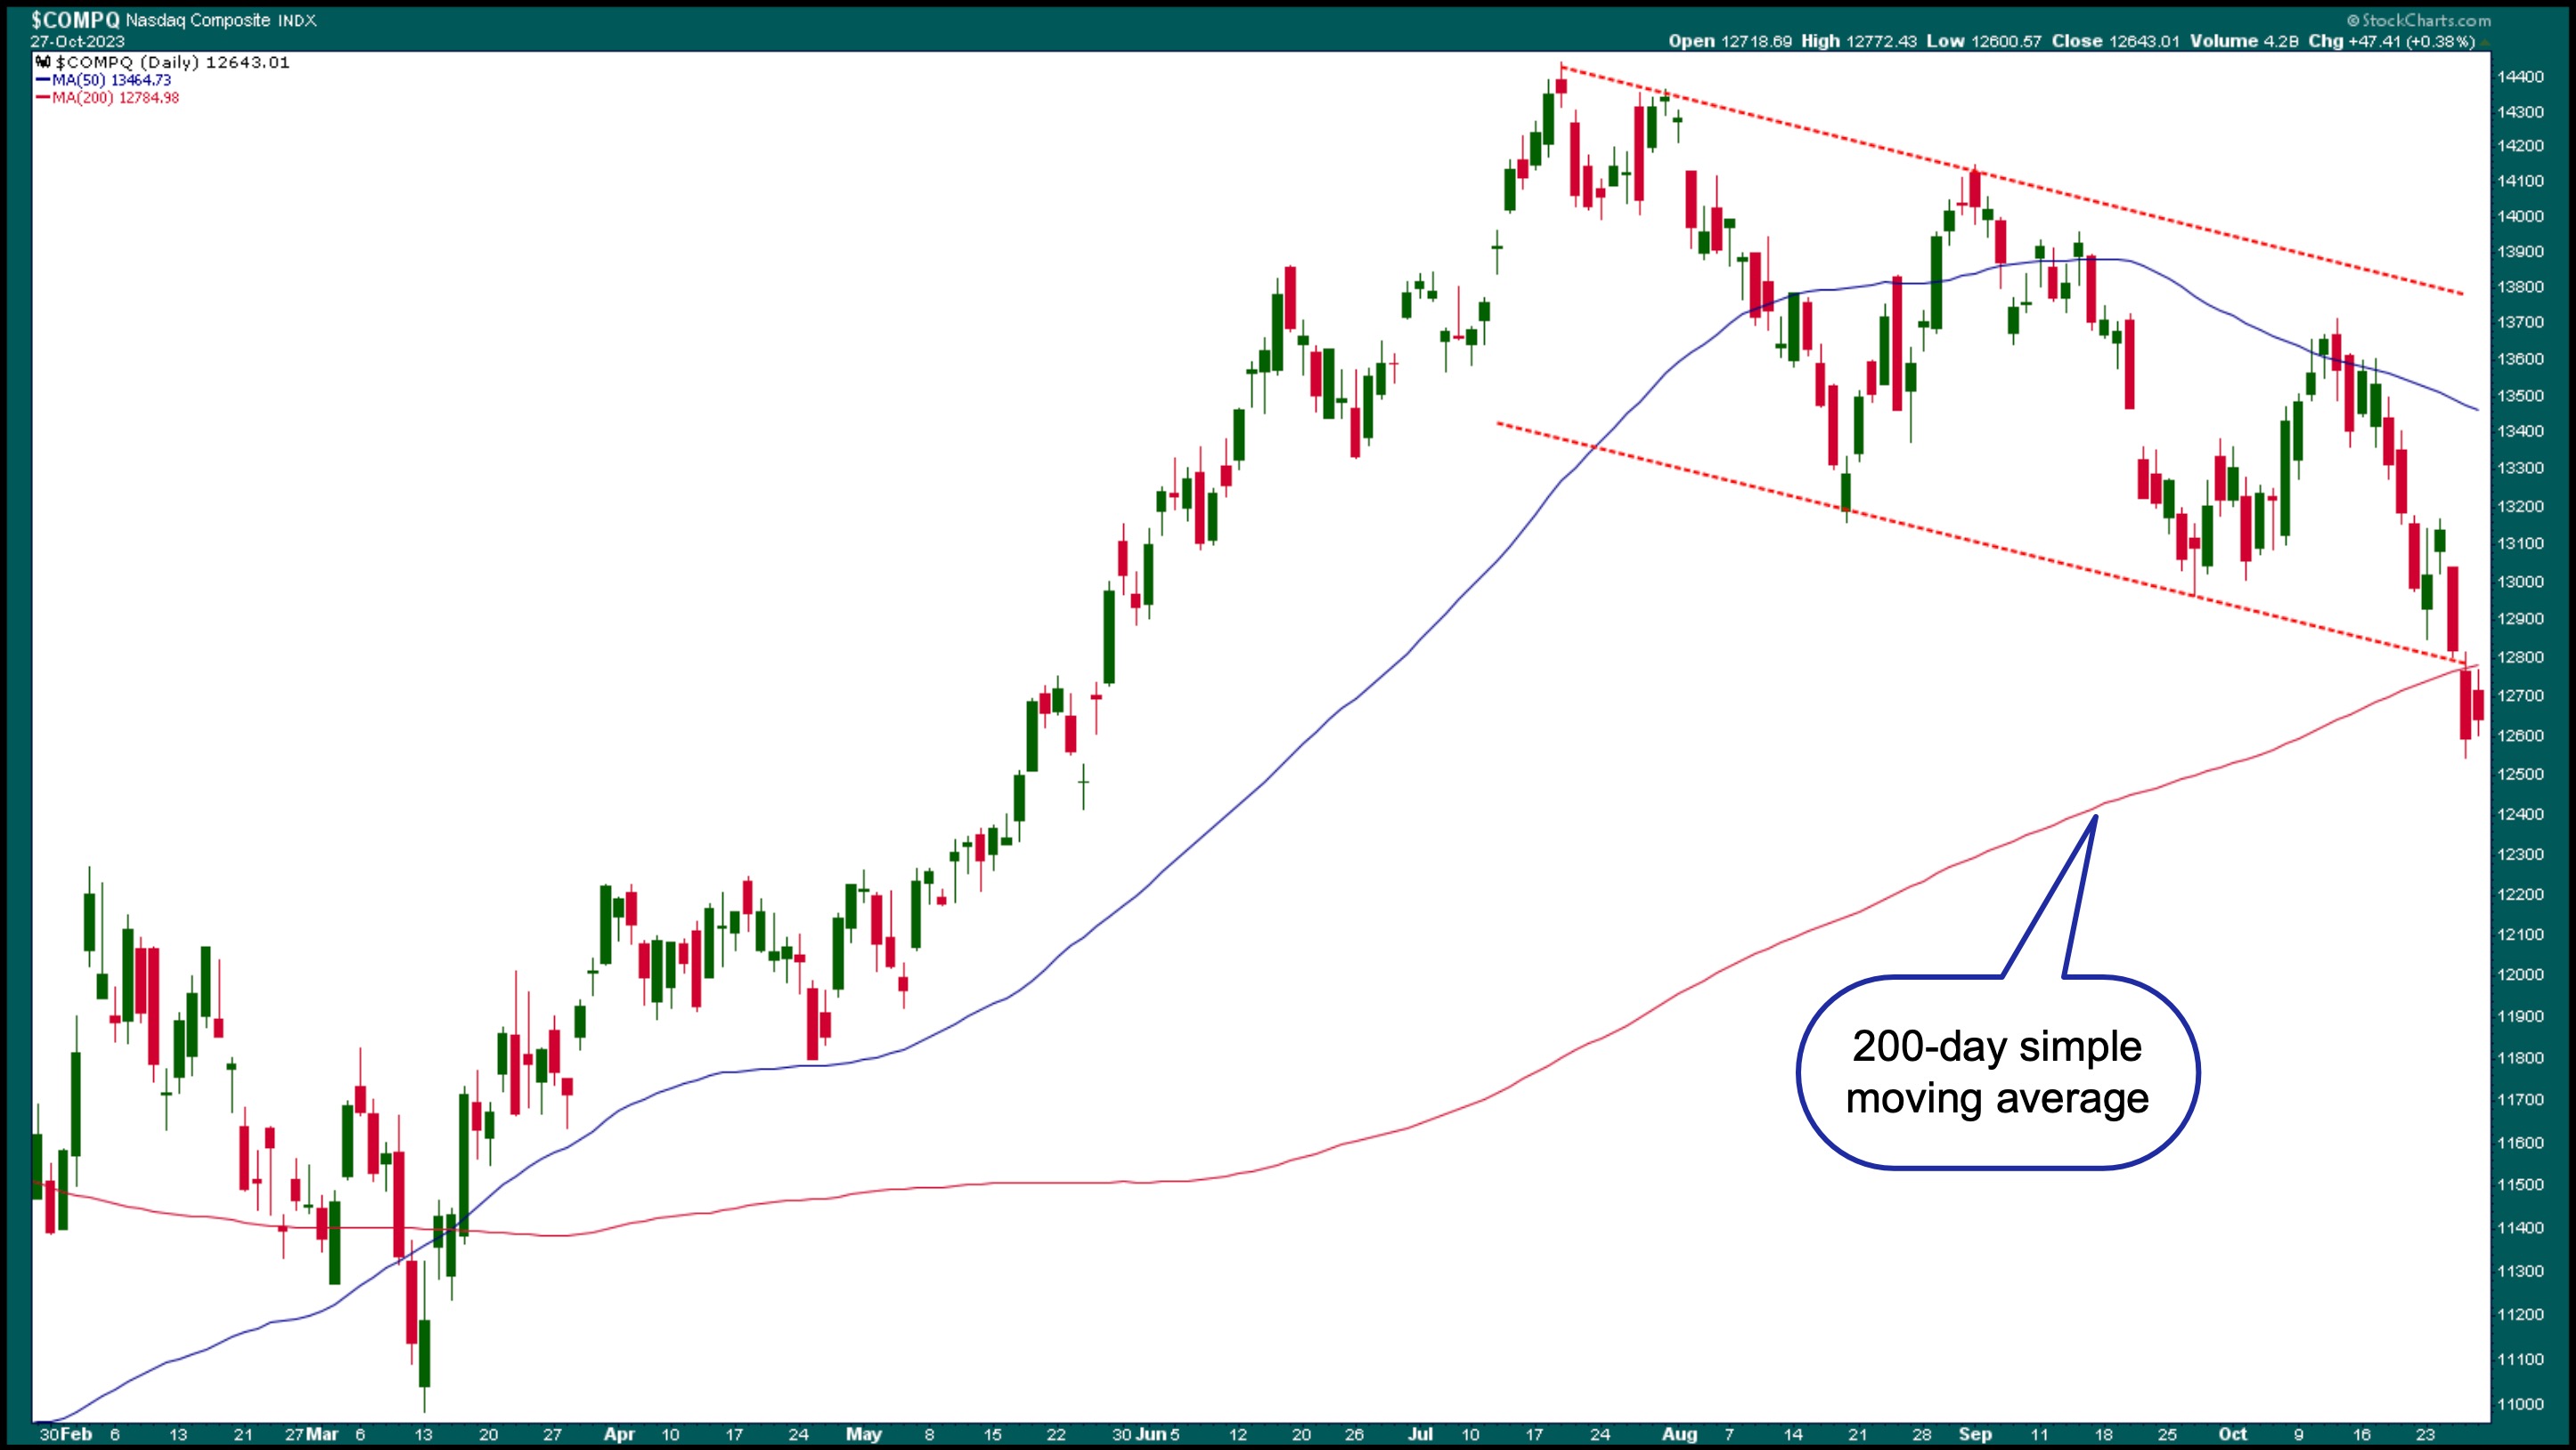
CHART 1: NASDAQ COMPOSITE DAILY CHART. The Nasdaq fell below its 200-day moving average and below a downward-sloping channel. The next support level could be the March lows. Chart source: StockCharts.com. For educational purposes.When the stock market is jittery, it makes it even more difficult for individual investors and traders to make decisions. This increases the probability of making errors, which can be frustrating. So what's an investor to do? Well, it might be a good time to sit back and observe. The last thing you want to happen is to get caught up in the daily up-and-down movement. You want to see a definite trend, and right now, that trend is still pointing down.
If a significant portion of your portfolio comprises tech stocks, you must monitor US Treasury yields. Rising Treasury yields weigh heavily on growth stocks. The daily chart of the 10-year US Treasury Yield Index ($TNX) below shows that yields have risen, although they're looking like they may be close to the top. If we see stability in the bond market, there's a chance of a rally in equity markets.
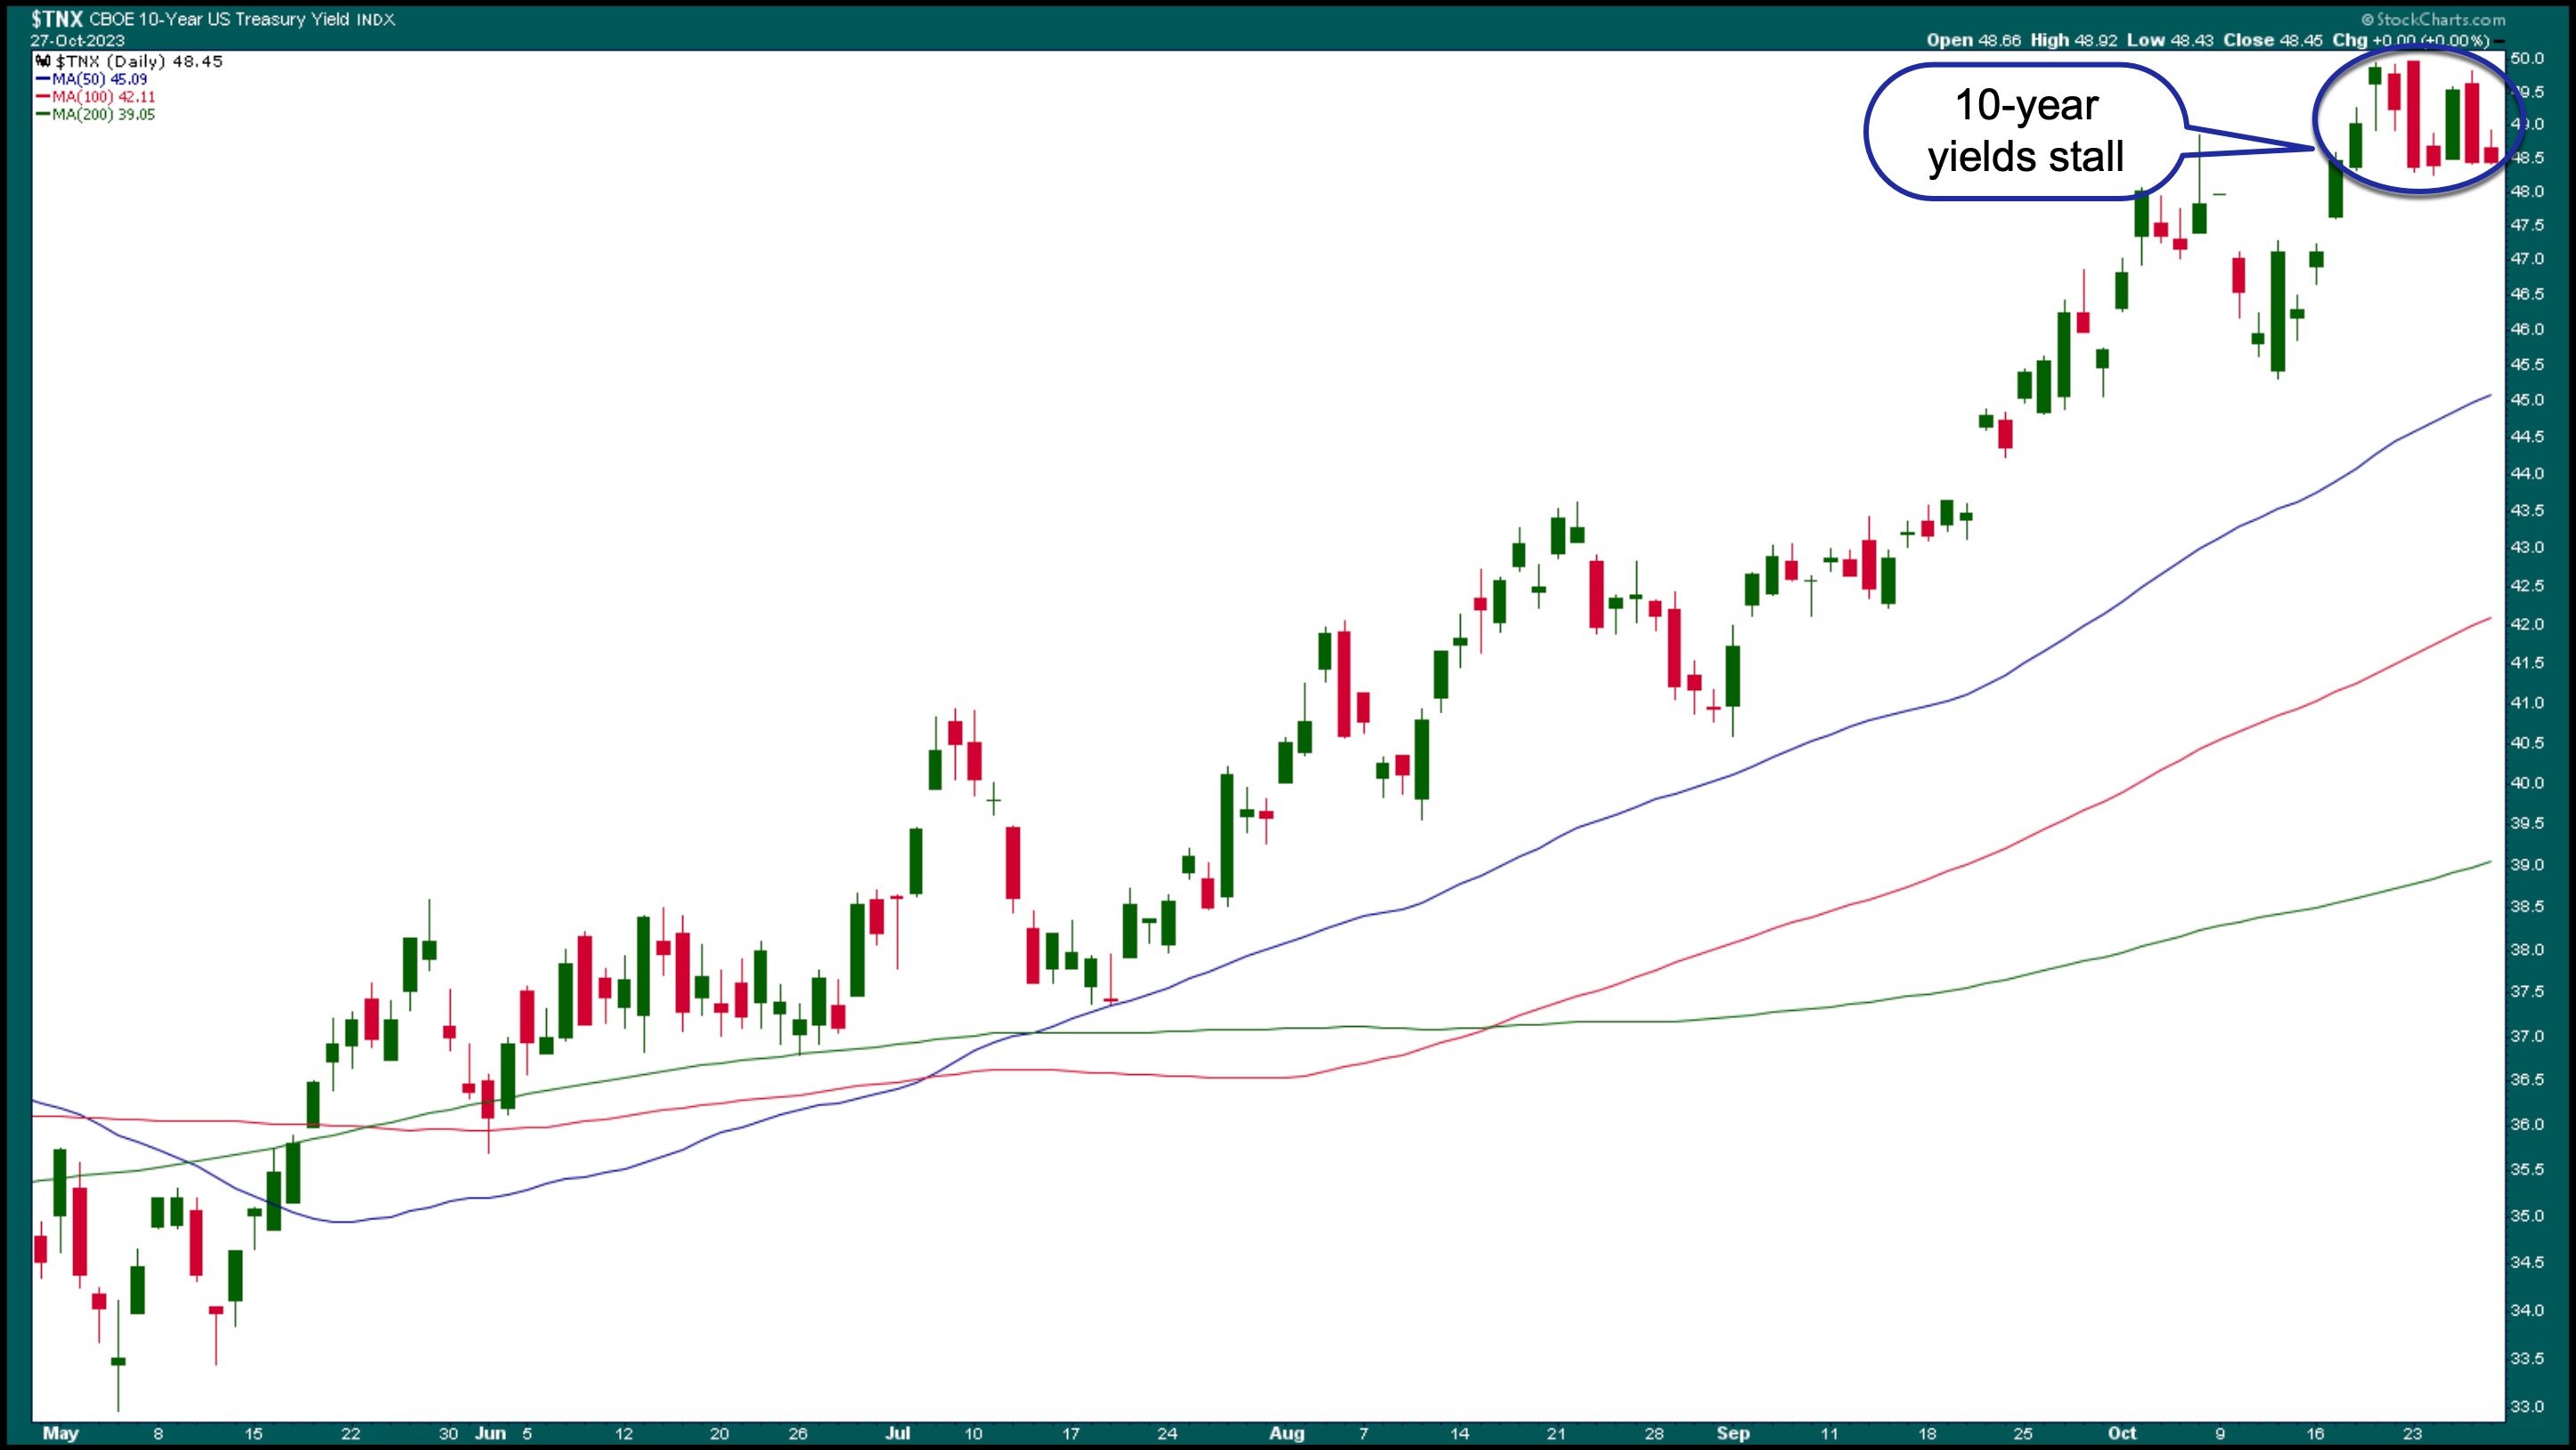
CHART 2: DAILY CHART OF 10-YEAR US TREASURY YIELD INDEX ($TNX). After rising to levels not seen since 2007, 10-year yields are taking a breather. Their direction rides a lot on whether the Fed is still hawkish. Chart source: StockCharts.com. For educational purposes.
Interest rate levels have influenced investor sentiment, especially regarding high-growth stocks. If rates start coming down, it'll be interesting to see how quickly the equity market will react. Remember, investors have sold off a lot of their big tech holdings. Will they jump back into them quickly when rates fall?
But what if yields remain high for longer than expected? Which investments should you be considering? This week, Bitcoin ($BTCUSD) rallied to the upside, rising to its highest level in 2023. The rally was news-driven, and Bitcoin broke from the trading range it has been in since August. But that doesn't necessarily mean Bitcoin should be considered a "safe-haven" investment. It's still a volatile instrument driven mostly by speculation.
What About Gold?
Gold is another speculative investment. Although the general thinking is that gold is a safe haven, there's no obvious correlation between equities and gold. It may be good to move to gold but don't plan to hold it for the long term.
Each day presents a different story; the best you can do is wait for things to turn with momentum. It's likely there won't be much decisive action until after the Fed's interest rate decision on Wednesday.
End-of-Week Wrap-Up
- $SPX down 0.48% at 4117.37, $INDU down 1.12% at 32417.59; $COMPQ up 0.38% at 12643.01
- $VIX up 2.85% at 21.27
- Best performing sector for the week: Utilities
- Worst performing sector for the week: Energy
- Top 5 Large Cap SCTR stocks: Vertiv Holdings, LLC (VRT); Super Micro Computer (SMCI); Applovin Corp. (APP); Splunk Inc. (SPLK); PDD Holdings Inc. (PDD)
On the Radar Next Week
- Earnings from Caterpillar, Inc. (CAT), Pfizer, Inc. (PFE), Advanced Micro Devices (AMD), Apple, Inc. (AAPL), DoorDash (DASH), Marathon Oil (MRO) and many more.
- August home prices
- October PMI
- September JOLTs Job Openings
- Fed Interest Rate Decision
- October Employment Data
Disclaimer: This blog is for educational purposes only and should not be construed as financial advice. The ideas and strategies should never be used without first assessing your own personal and financial situation, or without consulting a financial professional.
Happy charting!
