TAKEAWAYS
- Broader stock market indices are still holding support despite the selloff
- The VIX closed higher but it's still tame relative to past readings
- Gold futures closed above $1900 per ounce indicating that investors may have fled to gold in case geopolitical tensions escalated over the weekend

It's been a challenging week—geopolitical worries, no Speaker in the House of Representatives, hotter-than-expected inflation data—which means the stock market will likely continue its choppy movement. Now, the focus turns to earnings, with JP Morgan Chase (JPM), Citigroup (C), and Wells Fargo (WFC) all reporting better-than-expected figures.
Earnings season could keep the stock market smooth over the next few weeks, but it may end up being more distracting than anything else. Given the larger picture of global events, it's best to tread carefully.
Broader Market Holds Support
When September, a seasonally weak period, came to an end, investors felt a sense of relief, since the worst month was over. It was a dismal month, but, despite the pullback, the broader indices are showing some signs of recovery. The S&P 500 ($SPX) held its 200-day moving average (MA) support. The Dow Jones Industrial Average ($INDU) fell below its 200-day MA and is battling to break above it. The Nasdaq Composite ($COMPQ) held up well above its 200-day MA. The chart below shows how the Nasdaq Composite bounced off its 38.2% Fibonacci retracement level and is now facing resistance from its 50-day MA.
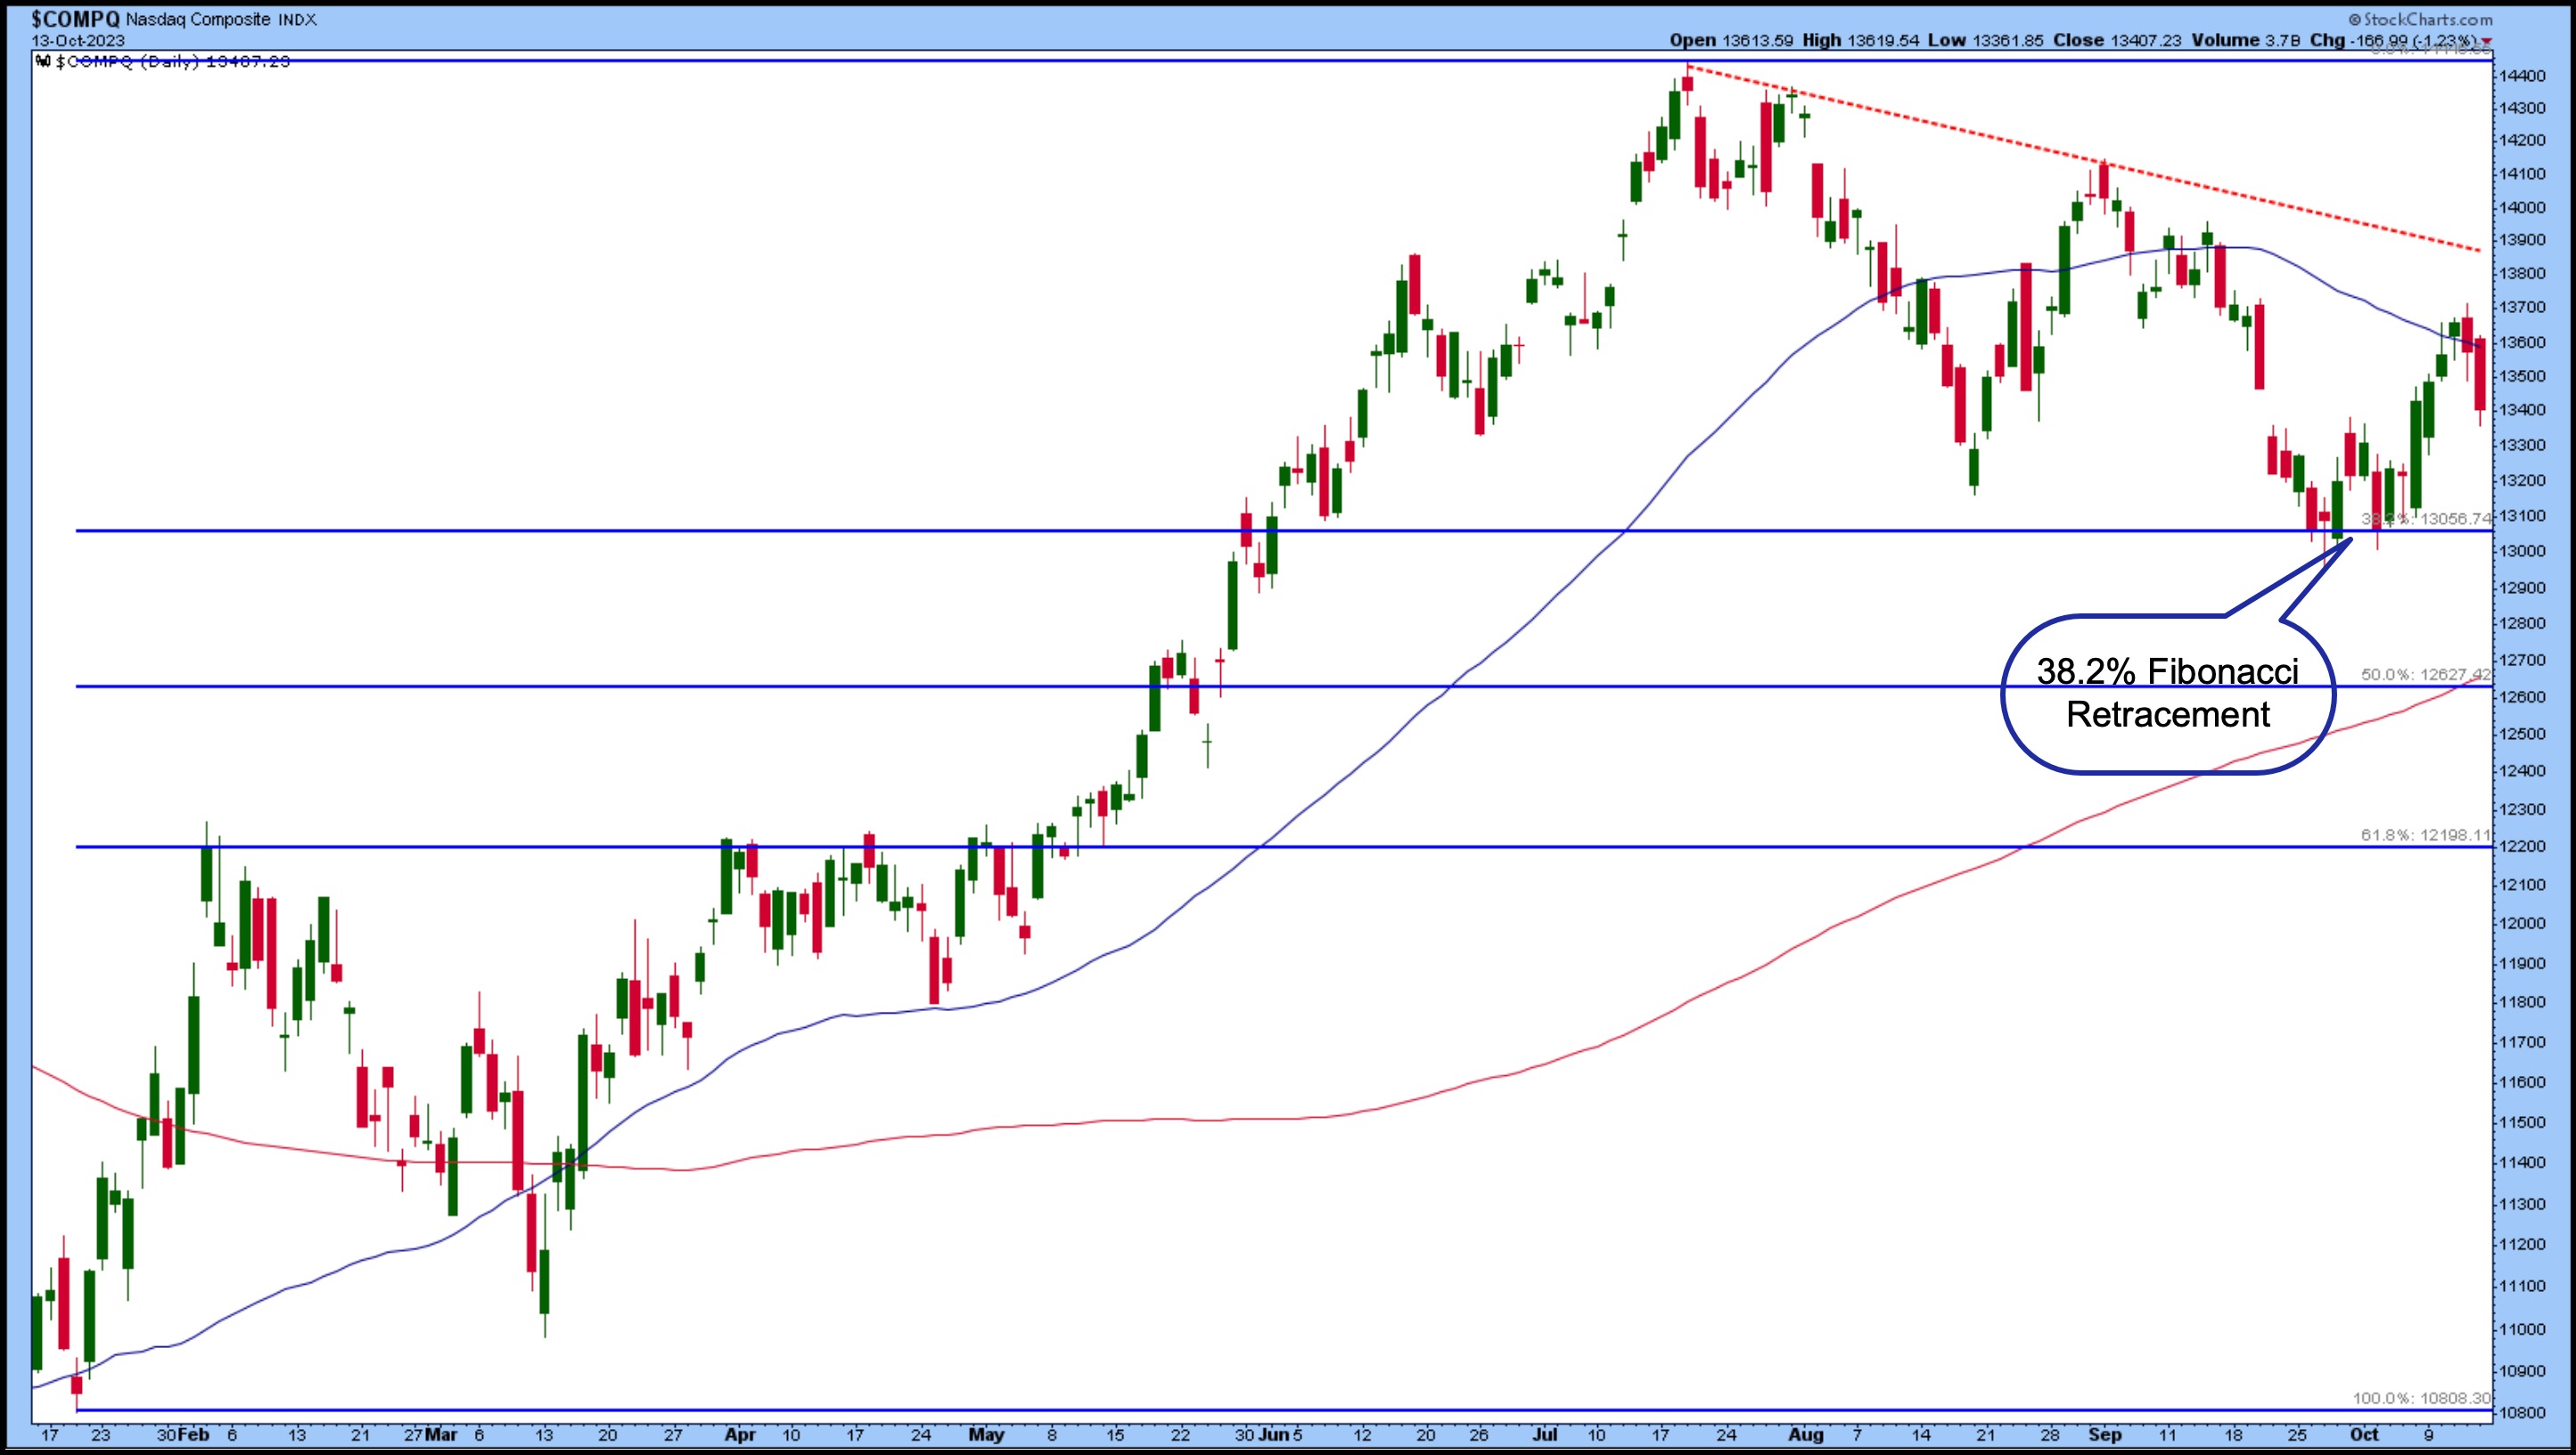
CHART 1: THE 38.2% FIBONACCI RETRACEMENT IS THE SUPPORT LEVEL TO WATCH. The overall trend is still down but if the Nasdaq Composite bounces back and breaks above the downward-sloping trendline (red dashed line), it could be positive for stocks.Chart source: StockCharts.com. For educational purposes.
The series of lower highs and lower lows is still in play, indicating that the market is in a consolidation phase. That must change to higher highs and higher lows to confirm an uptrend. And given that the mega-cap tech stocks hold the line in the Nasdaq Composite, keeping a close watch on the index for any change in investor sentiment is a good idea.
Investors Aren't Panicking Yet
Speaking of investor sentiment, given the rise in uncertainty, it's not surprising to see the CBOE Volatility Index ($VIX) rising. The VIX, considered the market's "fear gauge," has been moving between 12 and 21 for the last few months, within a relatively normal range. Friday's high got pretty close to the high of the range, but pulled back to close at 19.32. It's nowhere close to its massive over-80 spike that occurred when the pandemic hit.
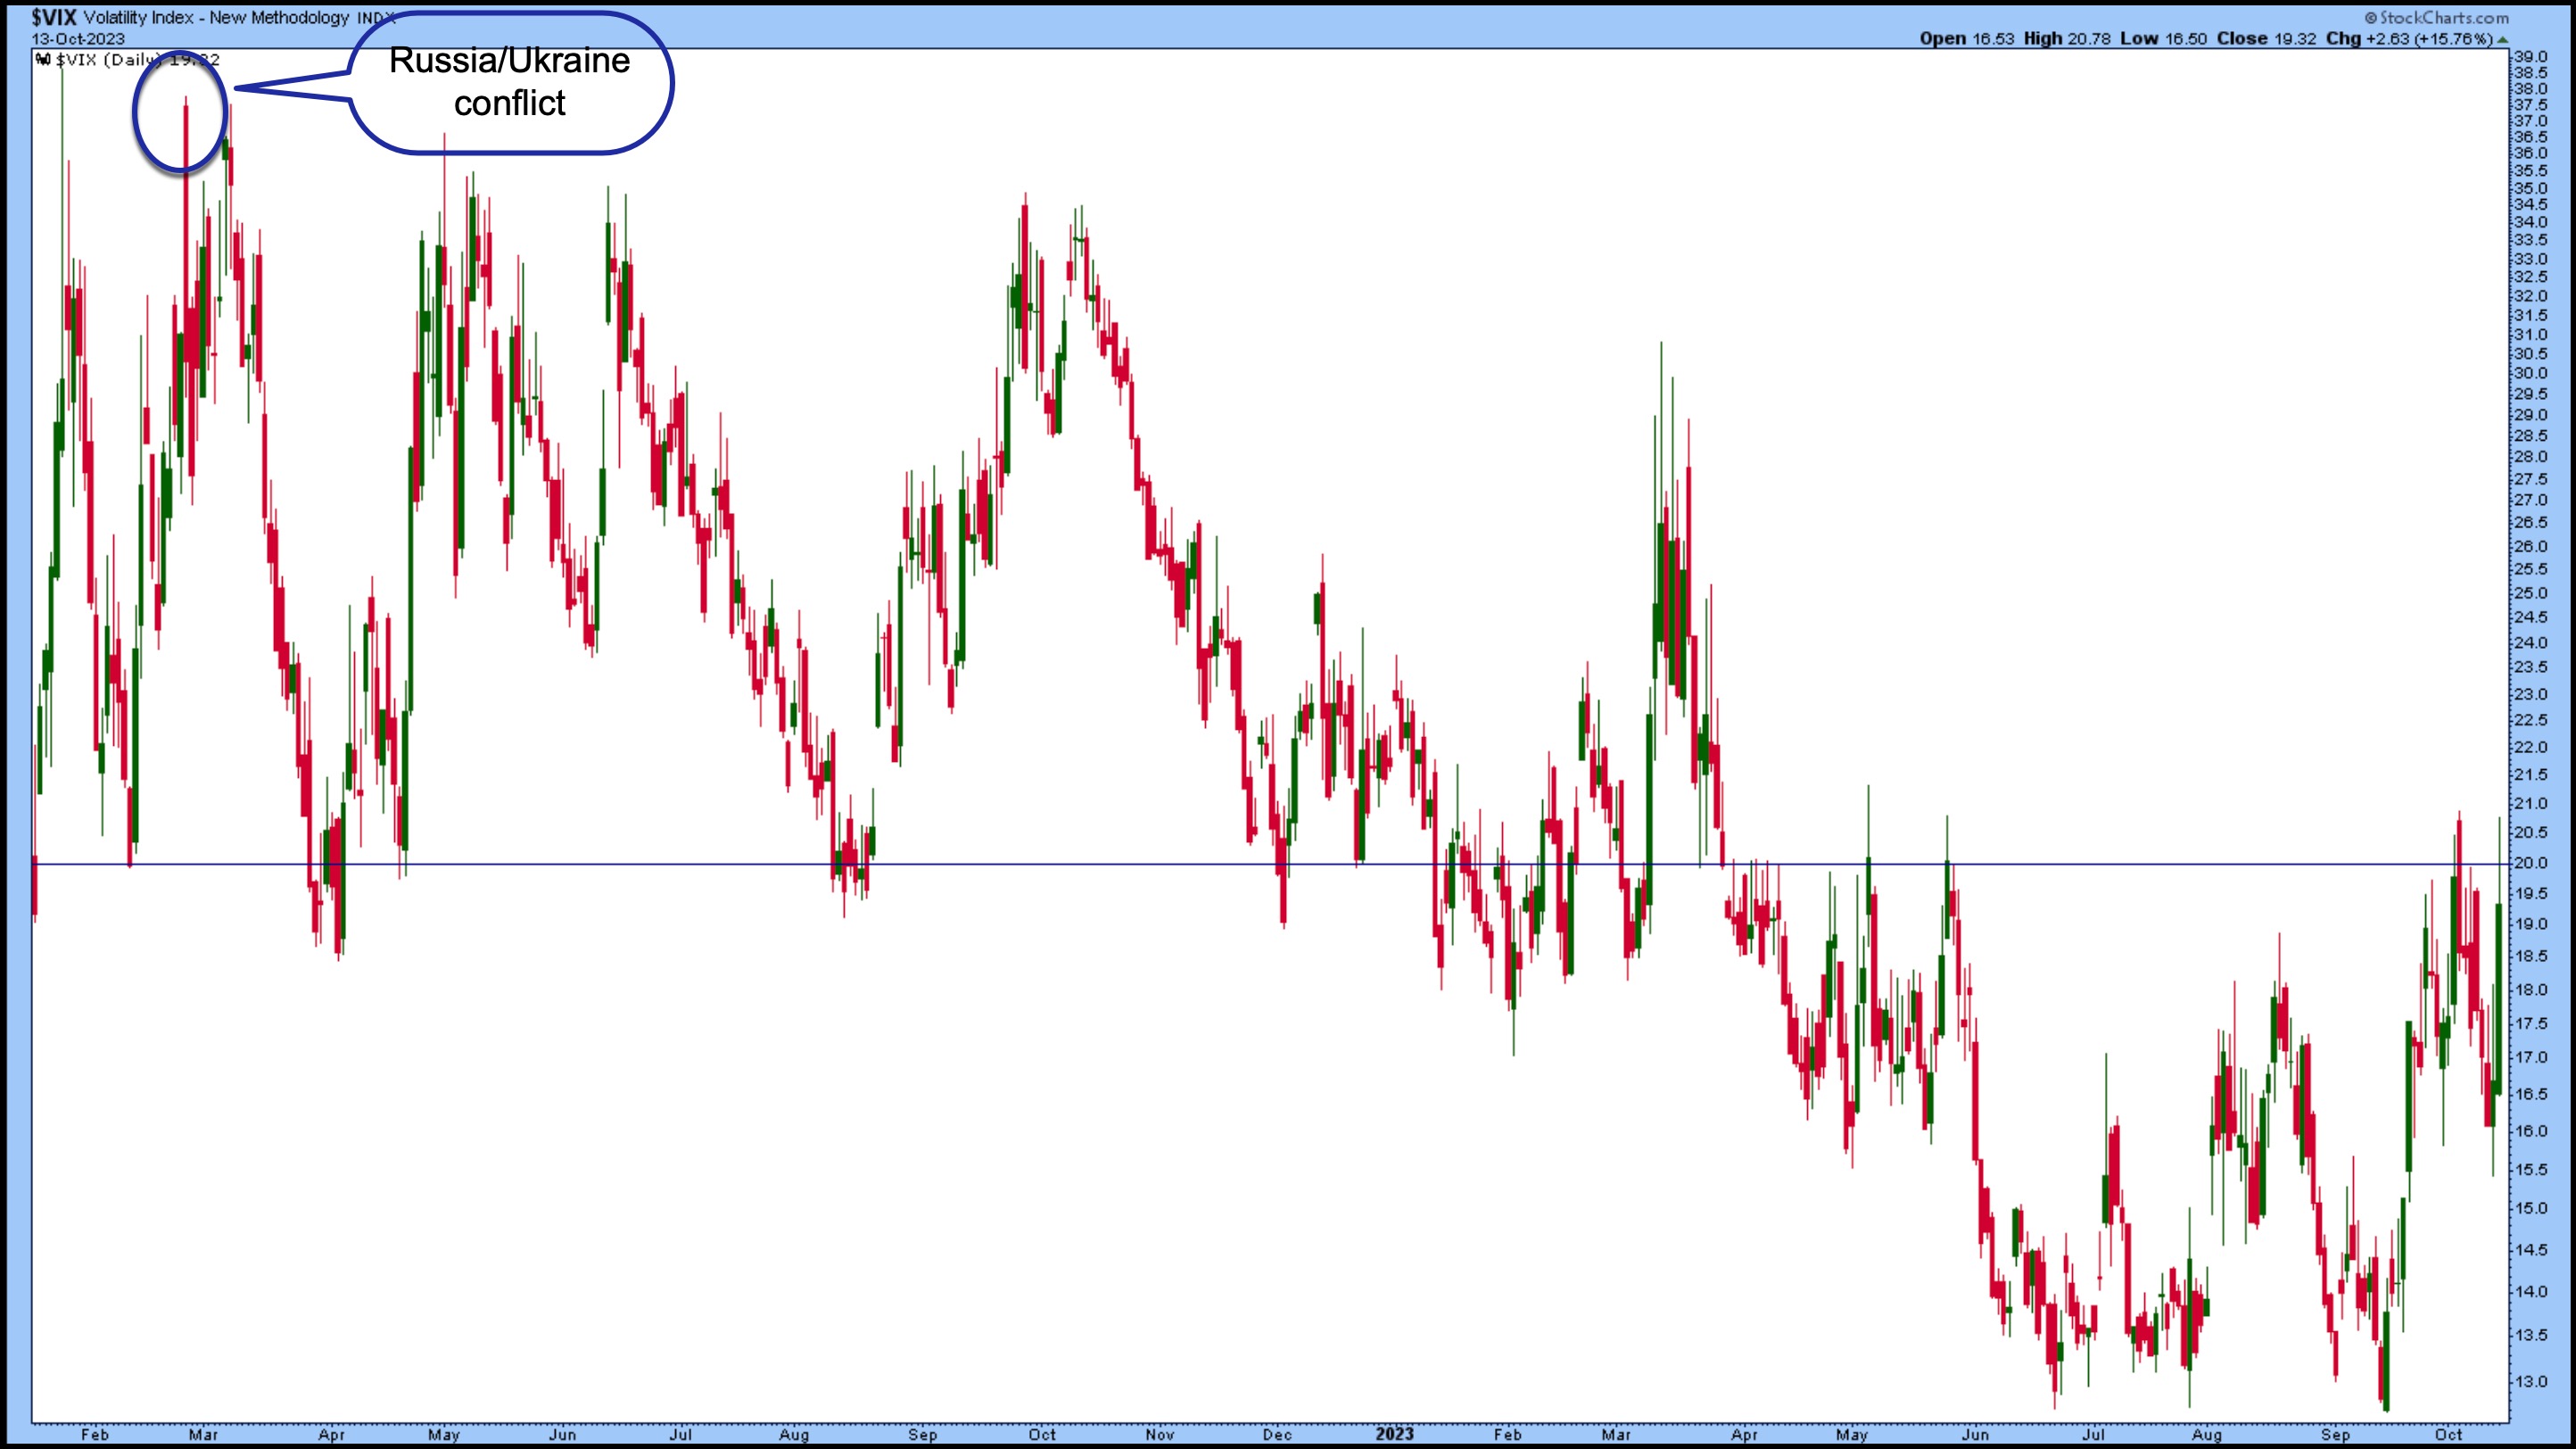
CHART 2: THE CBOE VOLATILITY INDEX ($VIX) IS STILL MEEK, RELATIVELY SPEAKING. Even though the VIX rose in today's trading, it's still not indicating panic among investors.Chart source: StockCharts.com. For educational purposes.
At the onset of the Ukraine-Russia conflict, VIX spiked to around 36, which is high, but relative to 80, it's pretty tame. But that doesn't mean all is complacent. If you see the VIX spike, it's an indication that investors are starting to panic. Have a backup plan in case the stock market goes awry.
How Should You Prepare?
If the VIX shows signs of fear, look at how the "risk-off" sectors, such as Utilities, Consumer Staples, and Real Estate, perform. The type of stocks most exposed to geopolitical winds tends to do worse when volatility ticks up. These can include Industrials, Materials, Technology, and Financials.
When volatility spikes, investors also flee from stocks and into fixed income, gold, the US dollar, and cash. Gold futures rose above $1,900 per ounce on Friday (see chart below), but gold is still underperforming the S&P 500. Investors may gravitate toward gold ahead of the weekend in case tensions escalate. If this were to happen, it wouldn't be surprising to see investors pile into the "risk off" areas.
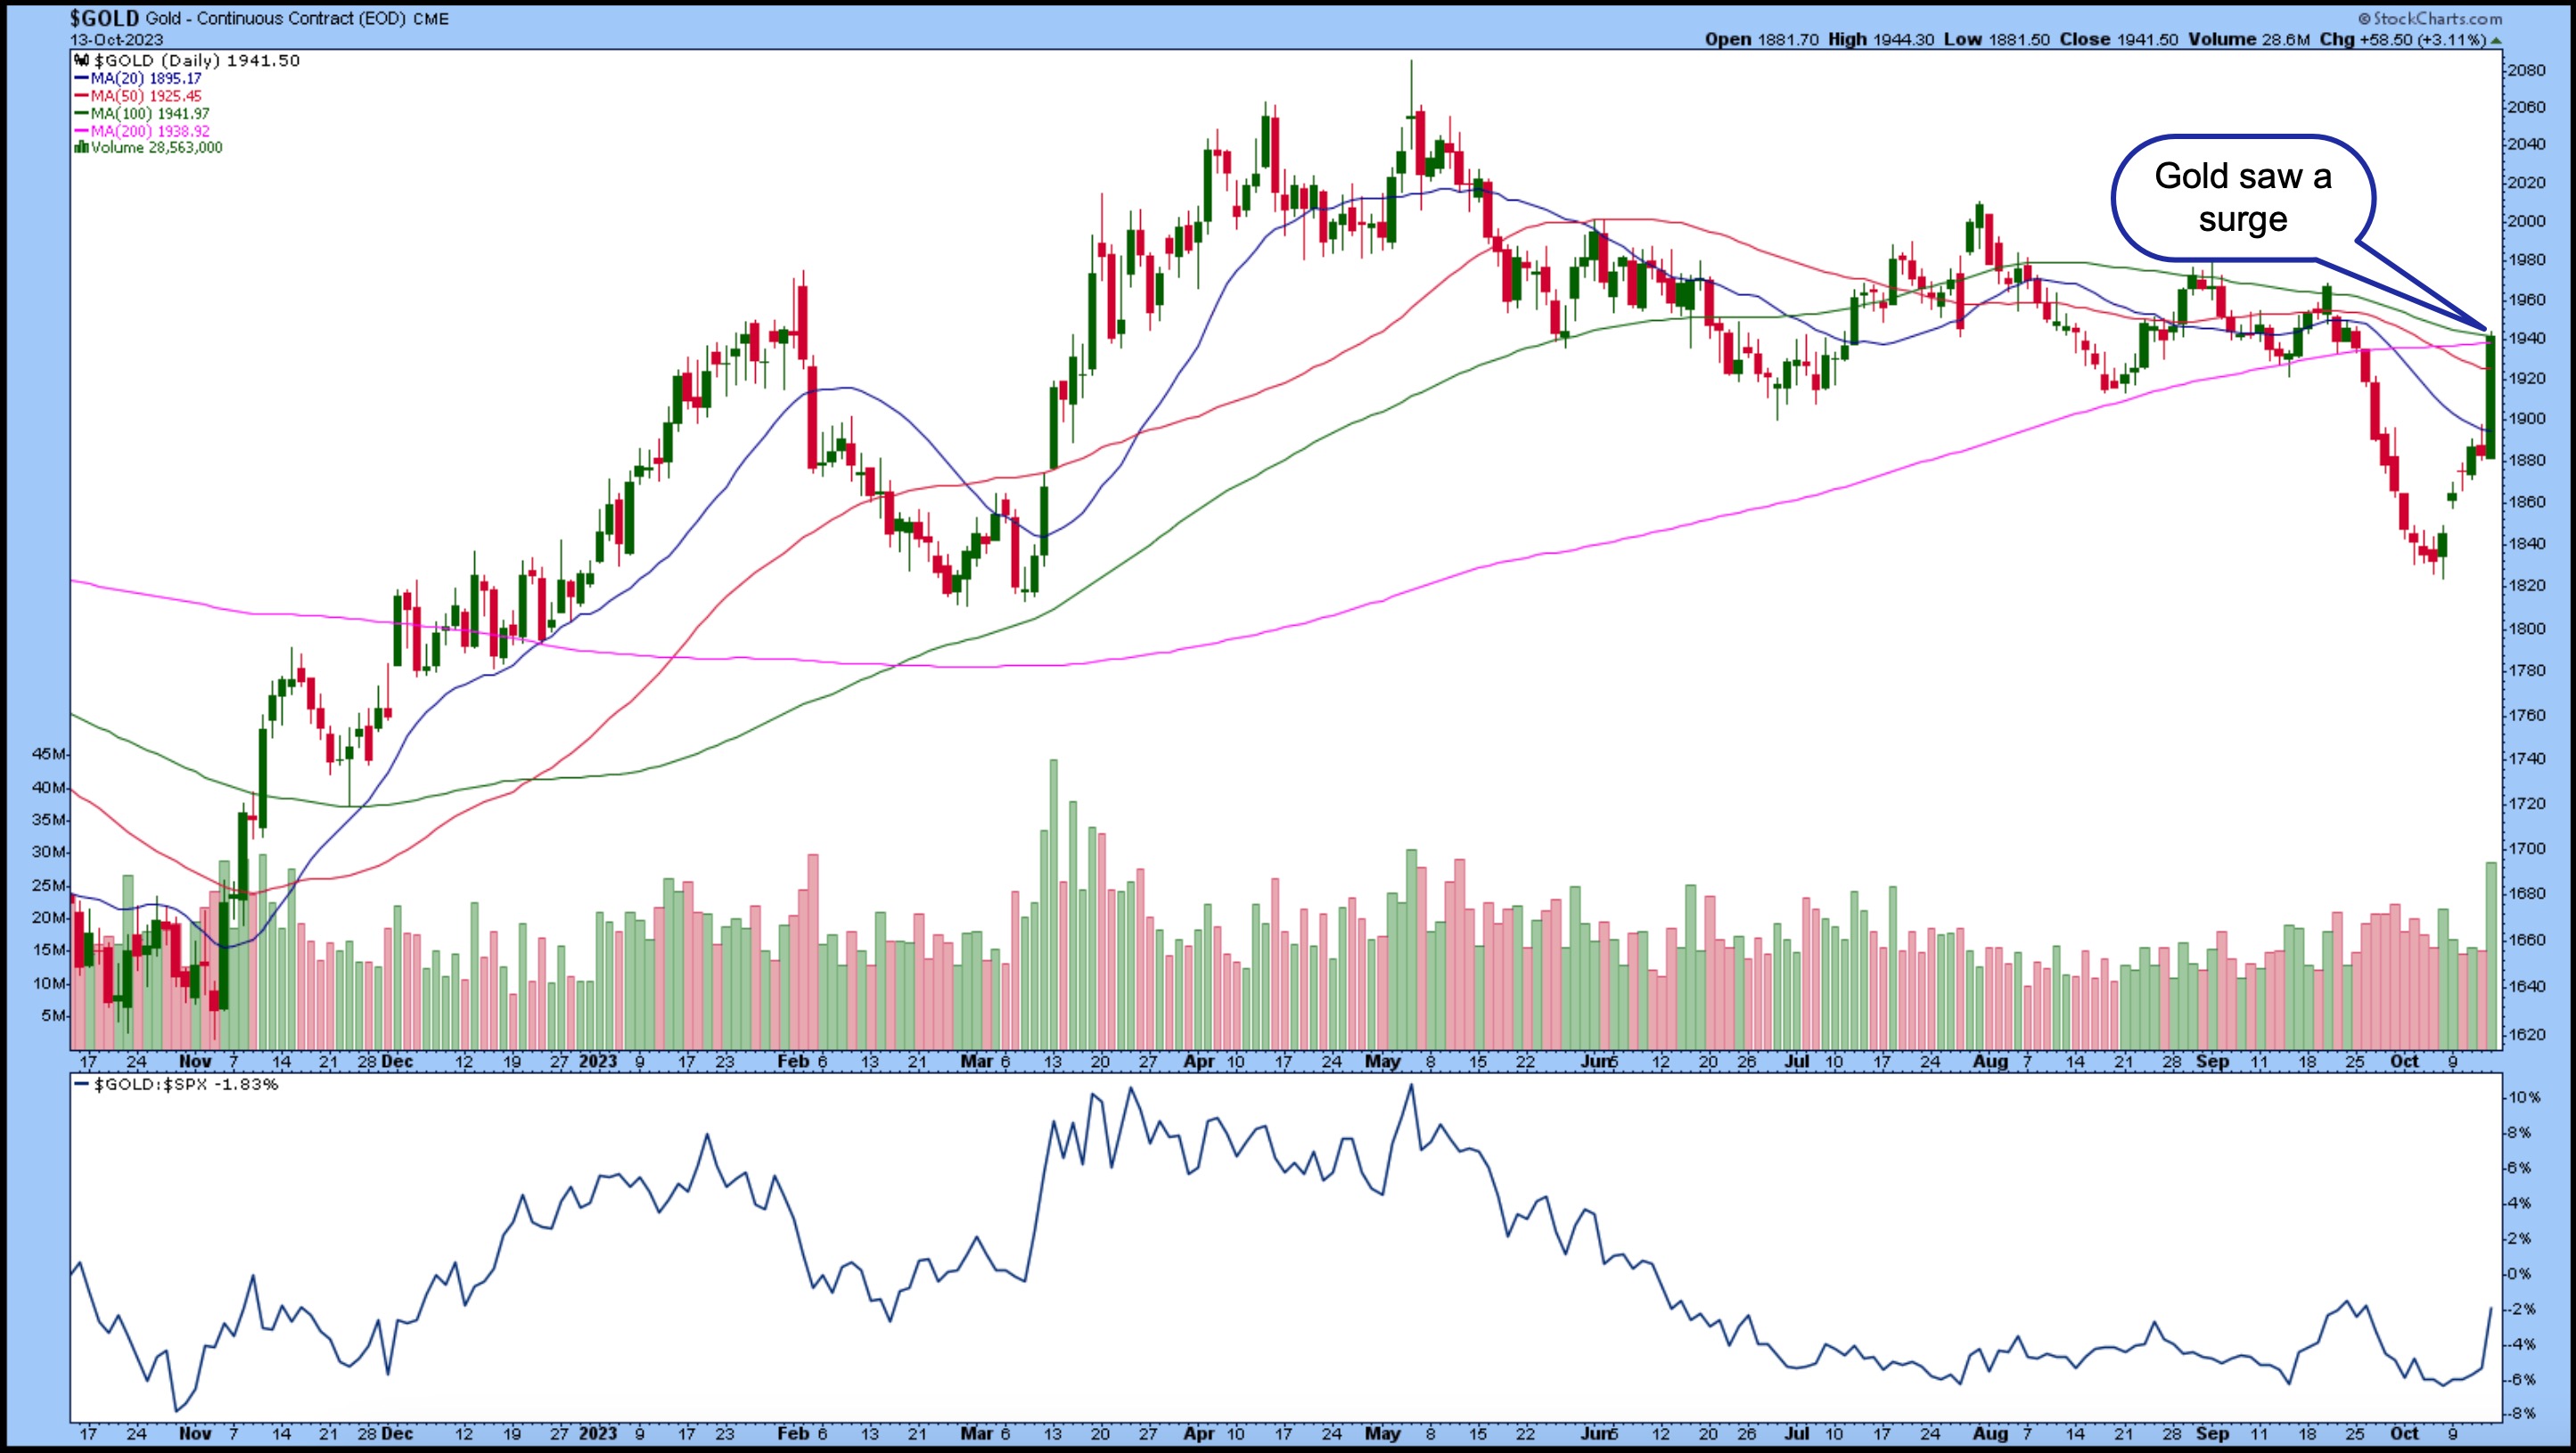
CHART 3: GOLD PRICES SURGE. Investors likely fled to gold ahead of the weekend, in the event of escalation of geopolitical tensions. Chart source: StockCharts.com. For educational purposes.
That doesn't mean you should rush to the "risk-off" type of investments immediately unless you're a short-term trader who gets in and out of assets based on short-term price action. You're better off letting the dust settle and seeing where things end up. So far, despite the selloff, the broader indexes are still holding on to support levels. There's no need to panic just yet.
End-of-Week Wrap-Up
US equity indexes mixed; volatility up

- $SPX down 0.5% at 4327.78, $INDU up 0.12% at 33670.29; $COMPQ down 1.23% at 13407.23
- $VIX up 15.76% at 19.32
- Best performing sector for the week: Energy
- Worst performing sector for the week: Consumer Discretionary
- Top 5 Large Cap SCTR stocks: Vertiv Holdings, LLC (VRT); Super Micro Computer (SMCI); Applovin Corp. (APP); Plantir Technologies, Inc. (PLTR); Jabil, Inc. (JBL)
On the Radar Next Week
- Earnings from Bank of America (BAC), Goldman Sachs Group, Inc. (GS), Johnson & Johnson (JNJ), Lockheed Martin Corp. (LMT), United Airlines (UAL), Netflix, Inc. (NFLX), Tesla, Inc. (TSLA), American Airlines Group (AAL), and many more.
- September retail sales
- Fed speeches
- September housing starts
Happy charting!
