TAKEAWAYS
- The stock market makes major gains with the S&P 500 and Nasdaq Composite closing above previous highs
- The 10-Year Treasury yield retested its 4.5% level and reversed to the upside
- Bitcoin rallied to close the week above 37,000

It was quite the week in the stock market.
Things started out well, with the broader market indexes rallying higher. By Thursday, investors were gearing up for the S&P 500 index ($SPX) to notch a nine-day winning streak. Alas, that didn't happen, and instead the index gave up all its weekly gains.
The Nasdaq Composite ($COMPQ) also snapped its winning streak. But Friday saw the stock market regain strength, with the S&P 500 and Nasdaq Composite closing above their previous highs. The Nasdaq saw its best trading day since May.
If you look beneath the surface of this week's action, you can see that market breadth was weak earlier on, but, by Friday, showed slight improvement (see chart below). However, it was still not at a level that would confirm the bullish move in the broader indexes.
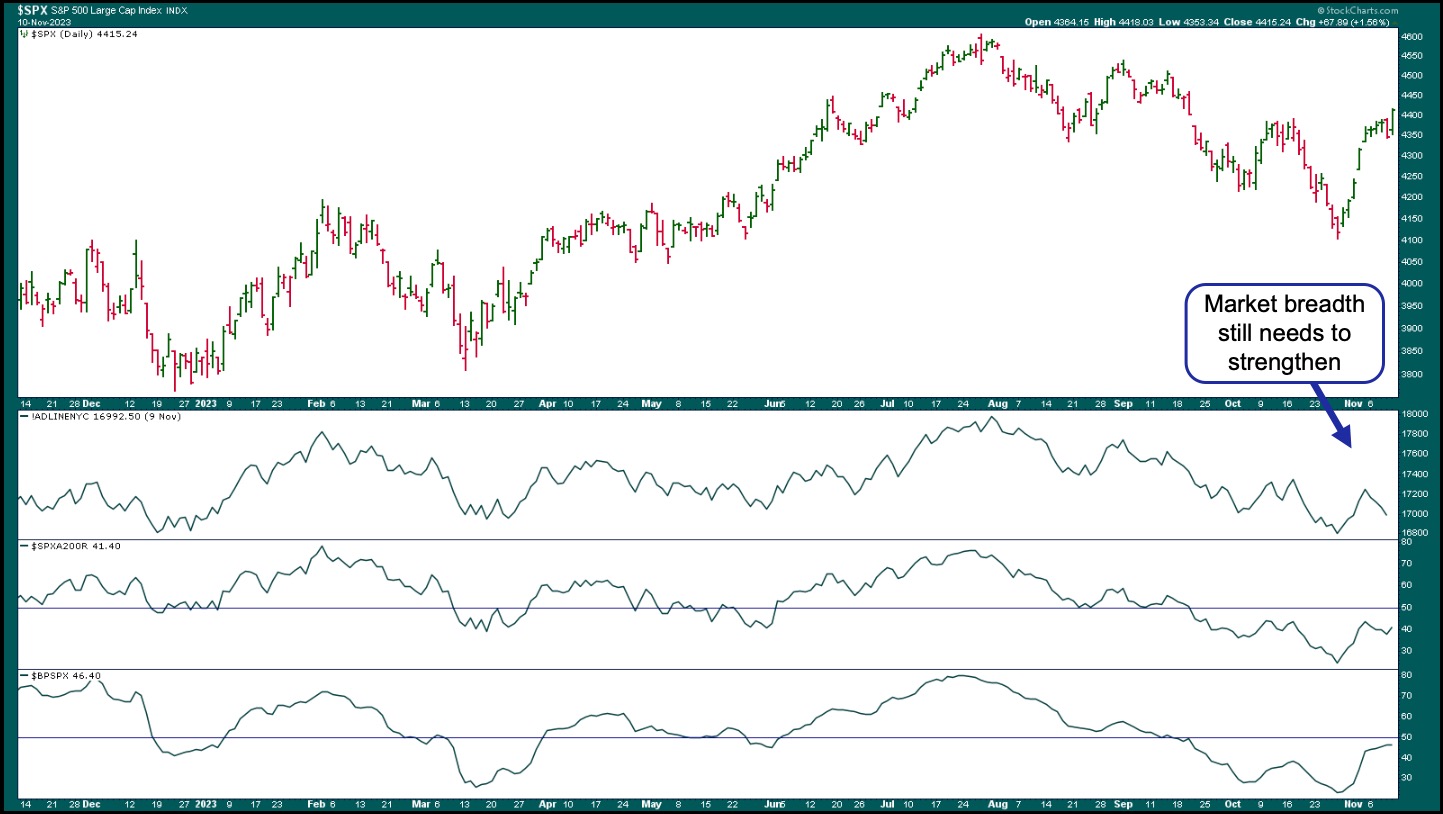
CHART 1: S&P 500 RALLIES, BUT BREADTH NEEDS TO CATCH UP. Although the S&P 500 closed above its previous high, breadth is still weak. Watch the advances-declines, percentage of stocks trading above the 200-day moving average, and bullish percent index. Chart source: StockCharts.com. For educational purposes.
The NYSE Common Stock Advance-Decline Issues ($NYAD) is still trending lower, the percentage of stocks above their 200-day moving average shows slight improvement, and the S&P 500 Bullish Percent Index is getting close to the 50-level threshold.
Small- and mid-cap stocks, which couldn't hold on to their short-lived up moves, gained a little strength, but not enough to confirm a broad market rally. Materials, Consumer Staples, Health Care, and Energy are still weak. If those areas start showing strength, it would be much more optimistic.
What About Bonds?
Fed Chairman Powell's comments this week suggested that more work needs to be done to lower inflation. His more hawkish tone could have been the main reason the market fell on Thursday. Another reason was the weak Treasury auction, indicating that demand for US Treasuries has weakened in the US and abroad.
Treasury yields are a major focus among investors, so it's natural to focus on the 10-year Treasury yield chart. After rallying close to 5%, the 10-Year US Treasury Yield Index ($TNX) pulled back, tested the 4.5% level, and reversed (see chart below). It's now trading at its 50-day moving average.
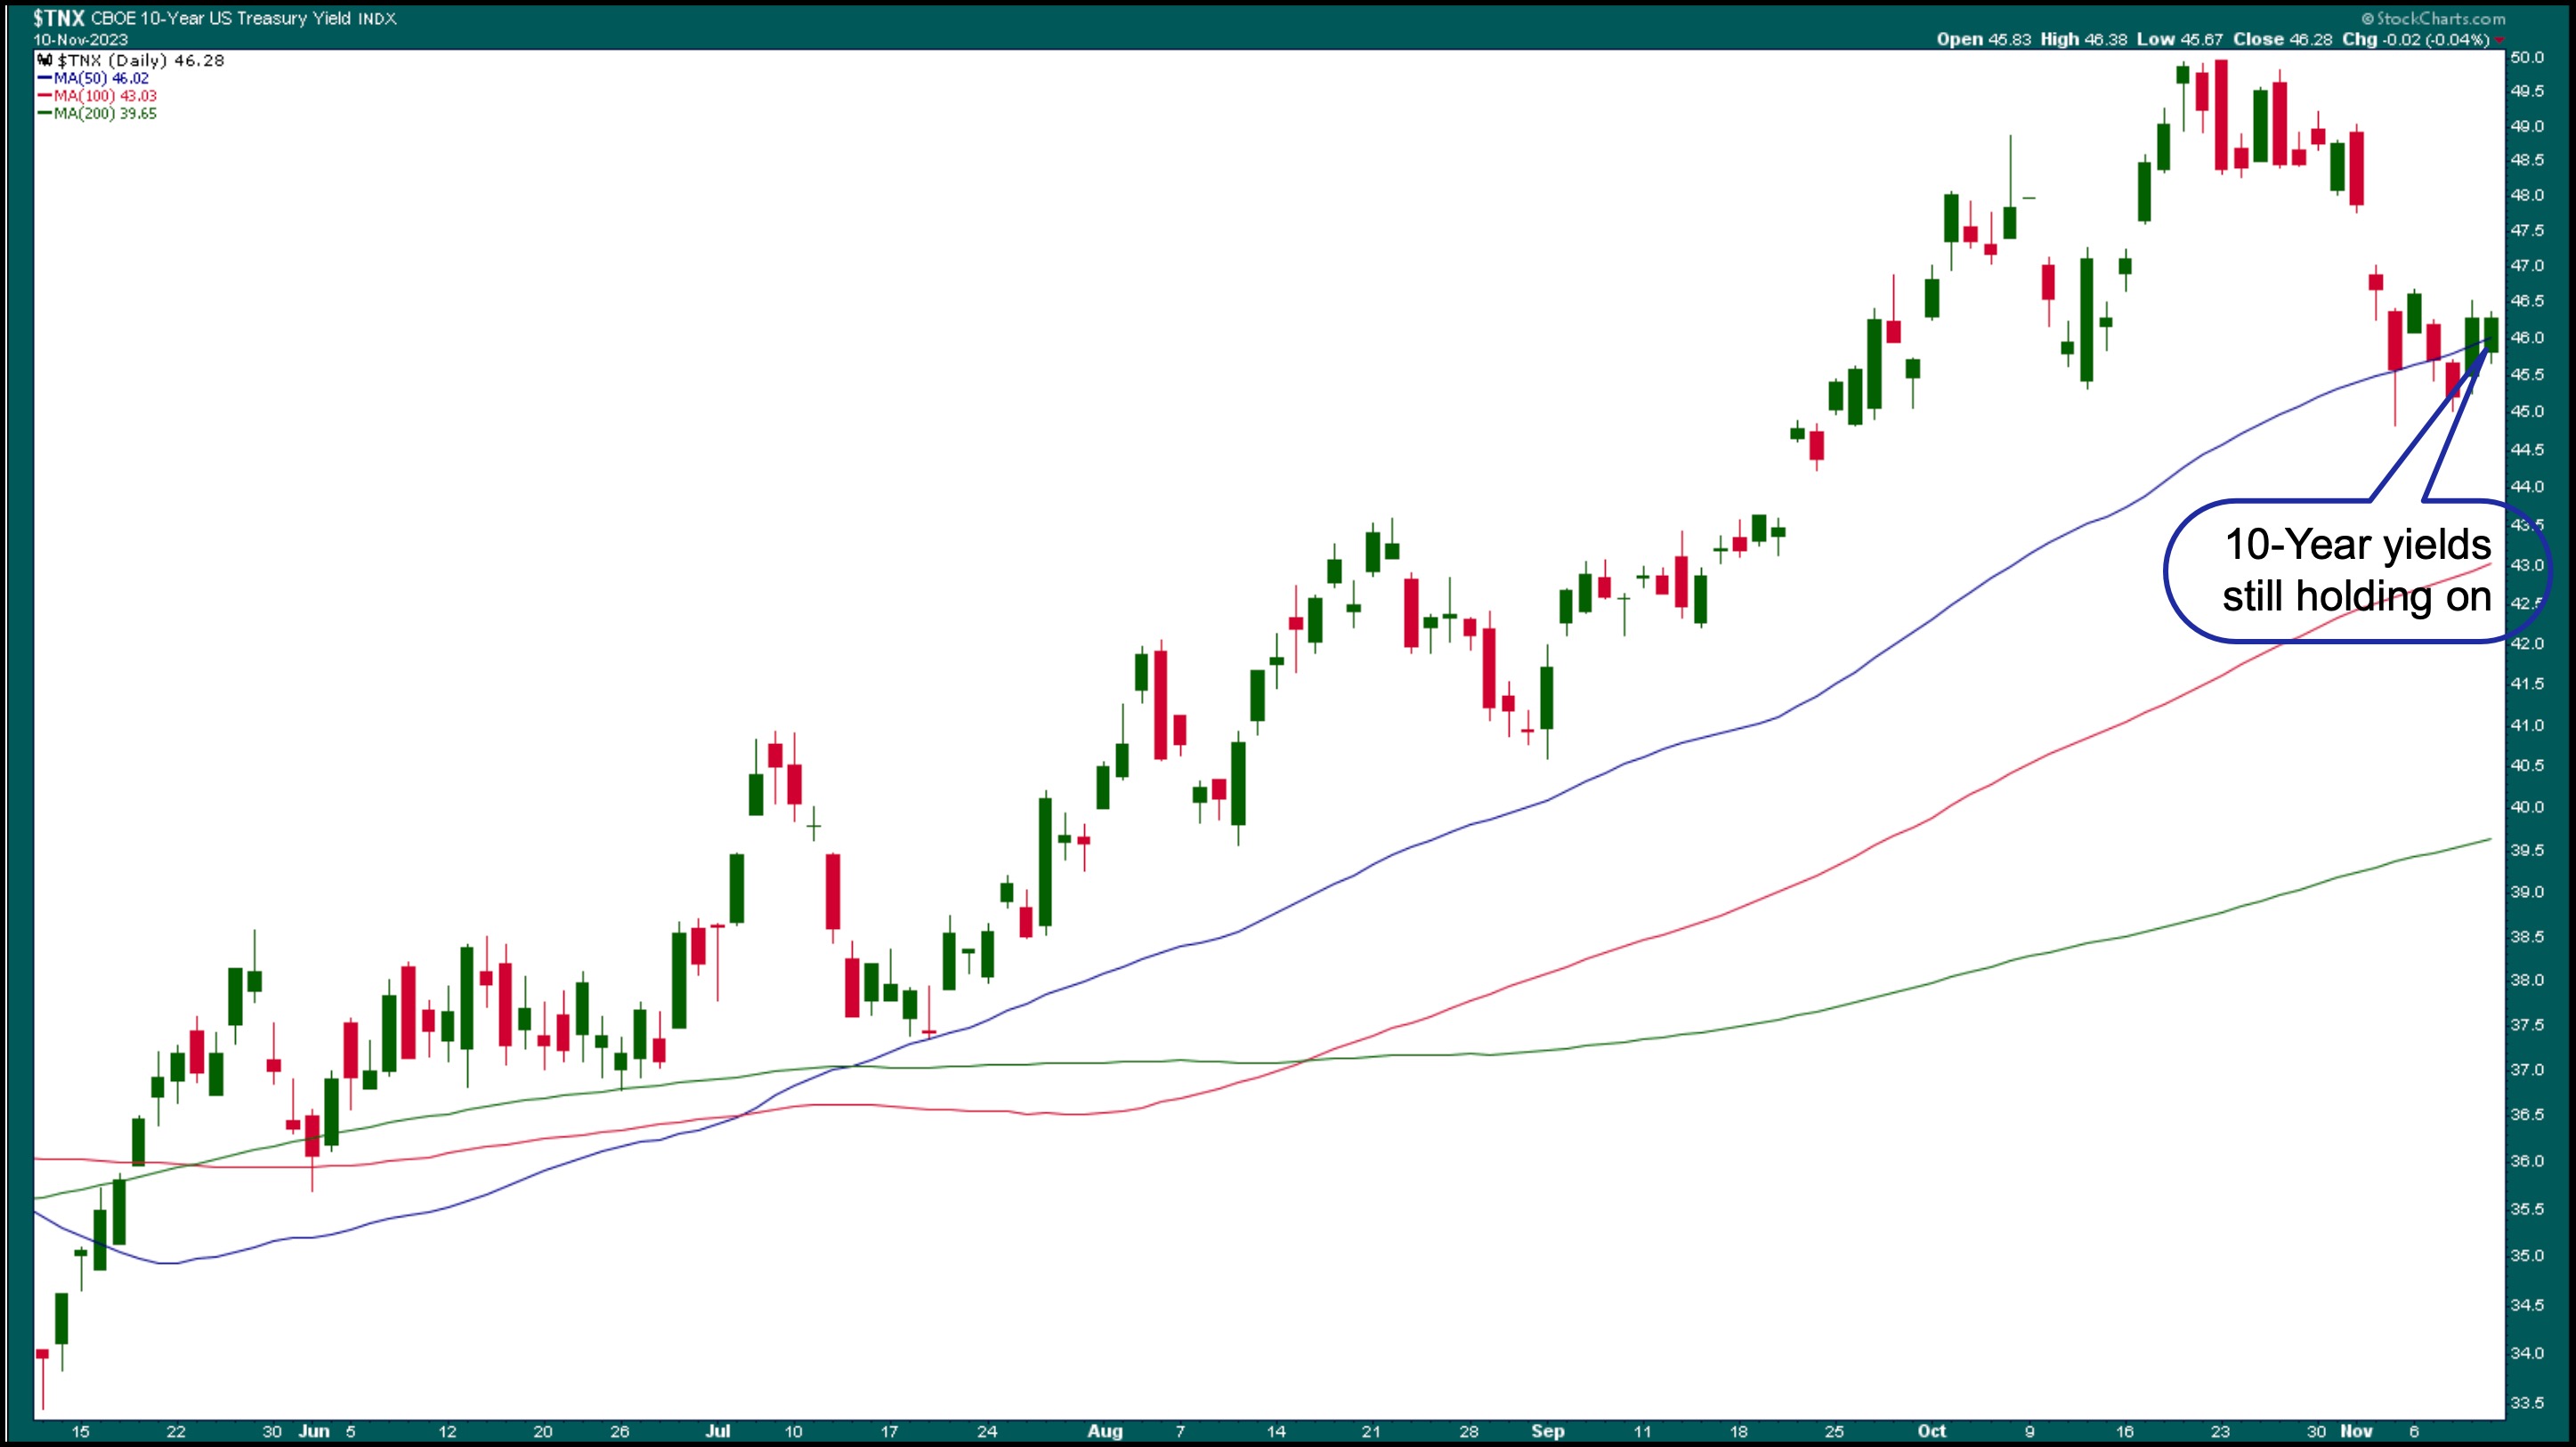
CHART 2: THE 10-YEAR TREASURY YIELDS AT 50-DAY MOVING AVERAGE. The 10-year yields tested 4.5% and reversed. Chart source: StockCharts.com. For educational purposes.
Rising yields tend to instill fear among investors, especially in the Tech sector. So, when yields pulled back, investors gravitated towards the larger, safer big tech stocks. But remember, fear can flip the stock market on a dime, and we're seeing a lot of flip-flopping going on in the stock market right now.
And Let's Not Forget Bitcoin
No discussion of this week's stock market would be complete without touching on Bitcoin. The daily chart of $BTCUSD below shows a dramatic rise in the cryptocurrency. 37,000 is considered a significant threshold, so a close above this level could mean more bullish movement. As of now, Bitcoin is not correlated to any other asset, which makes it a potential asset for diversification.
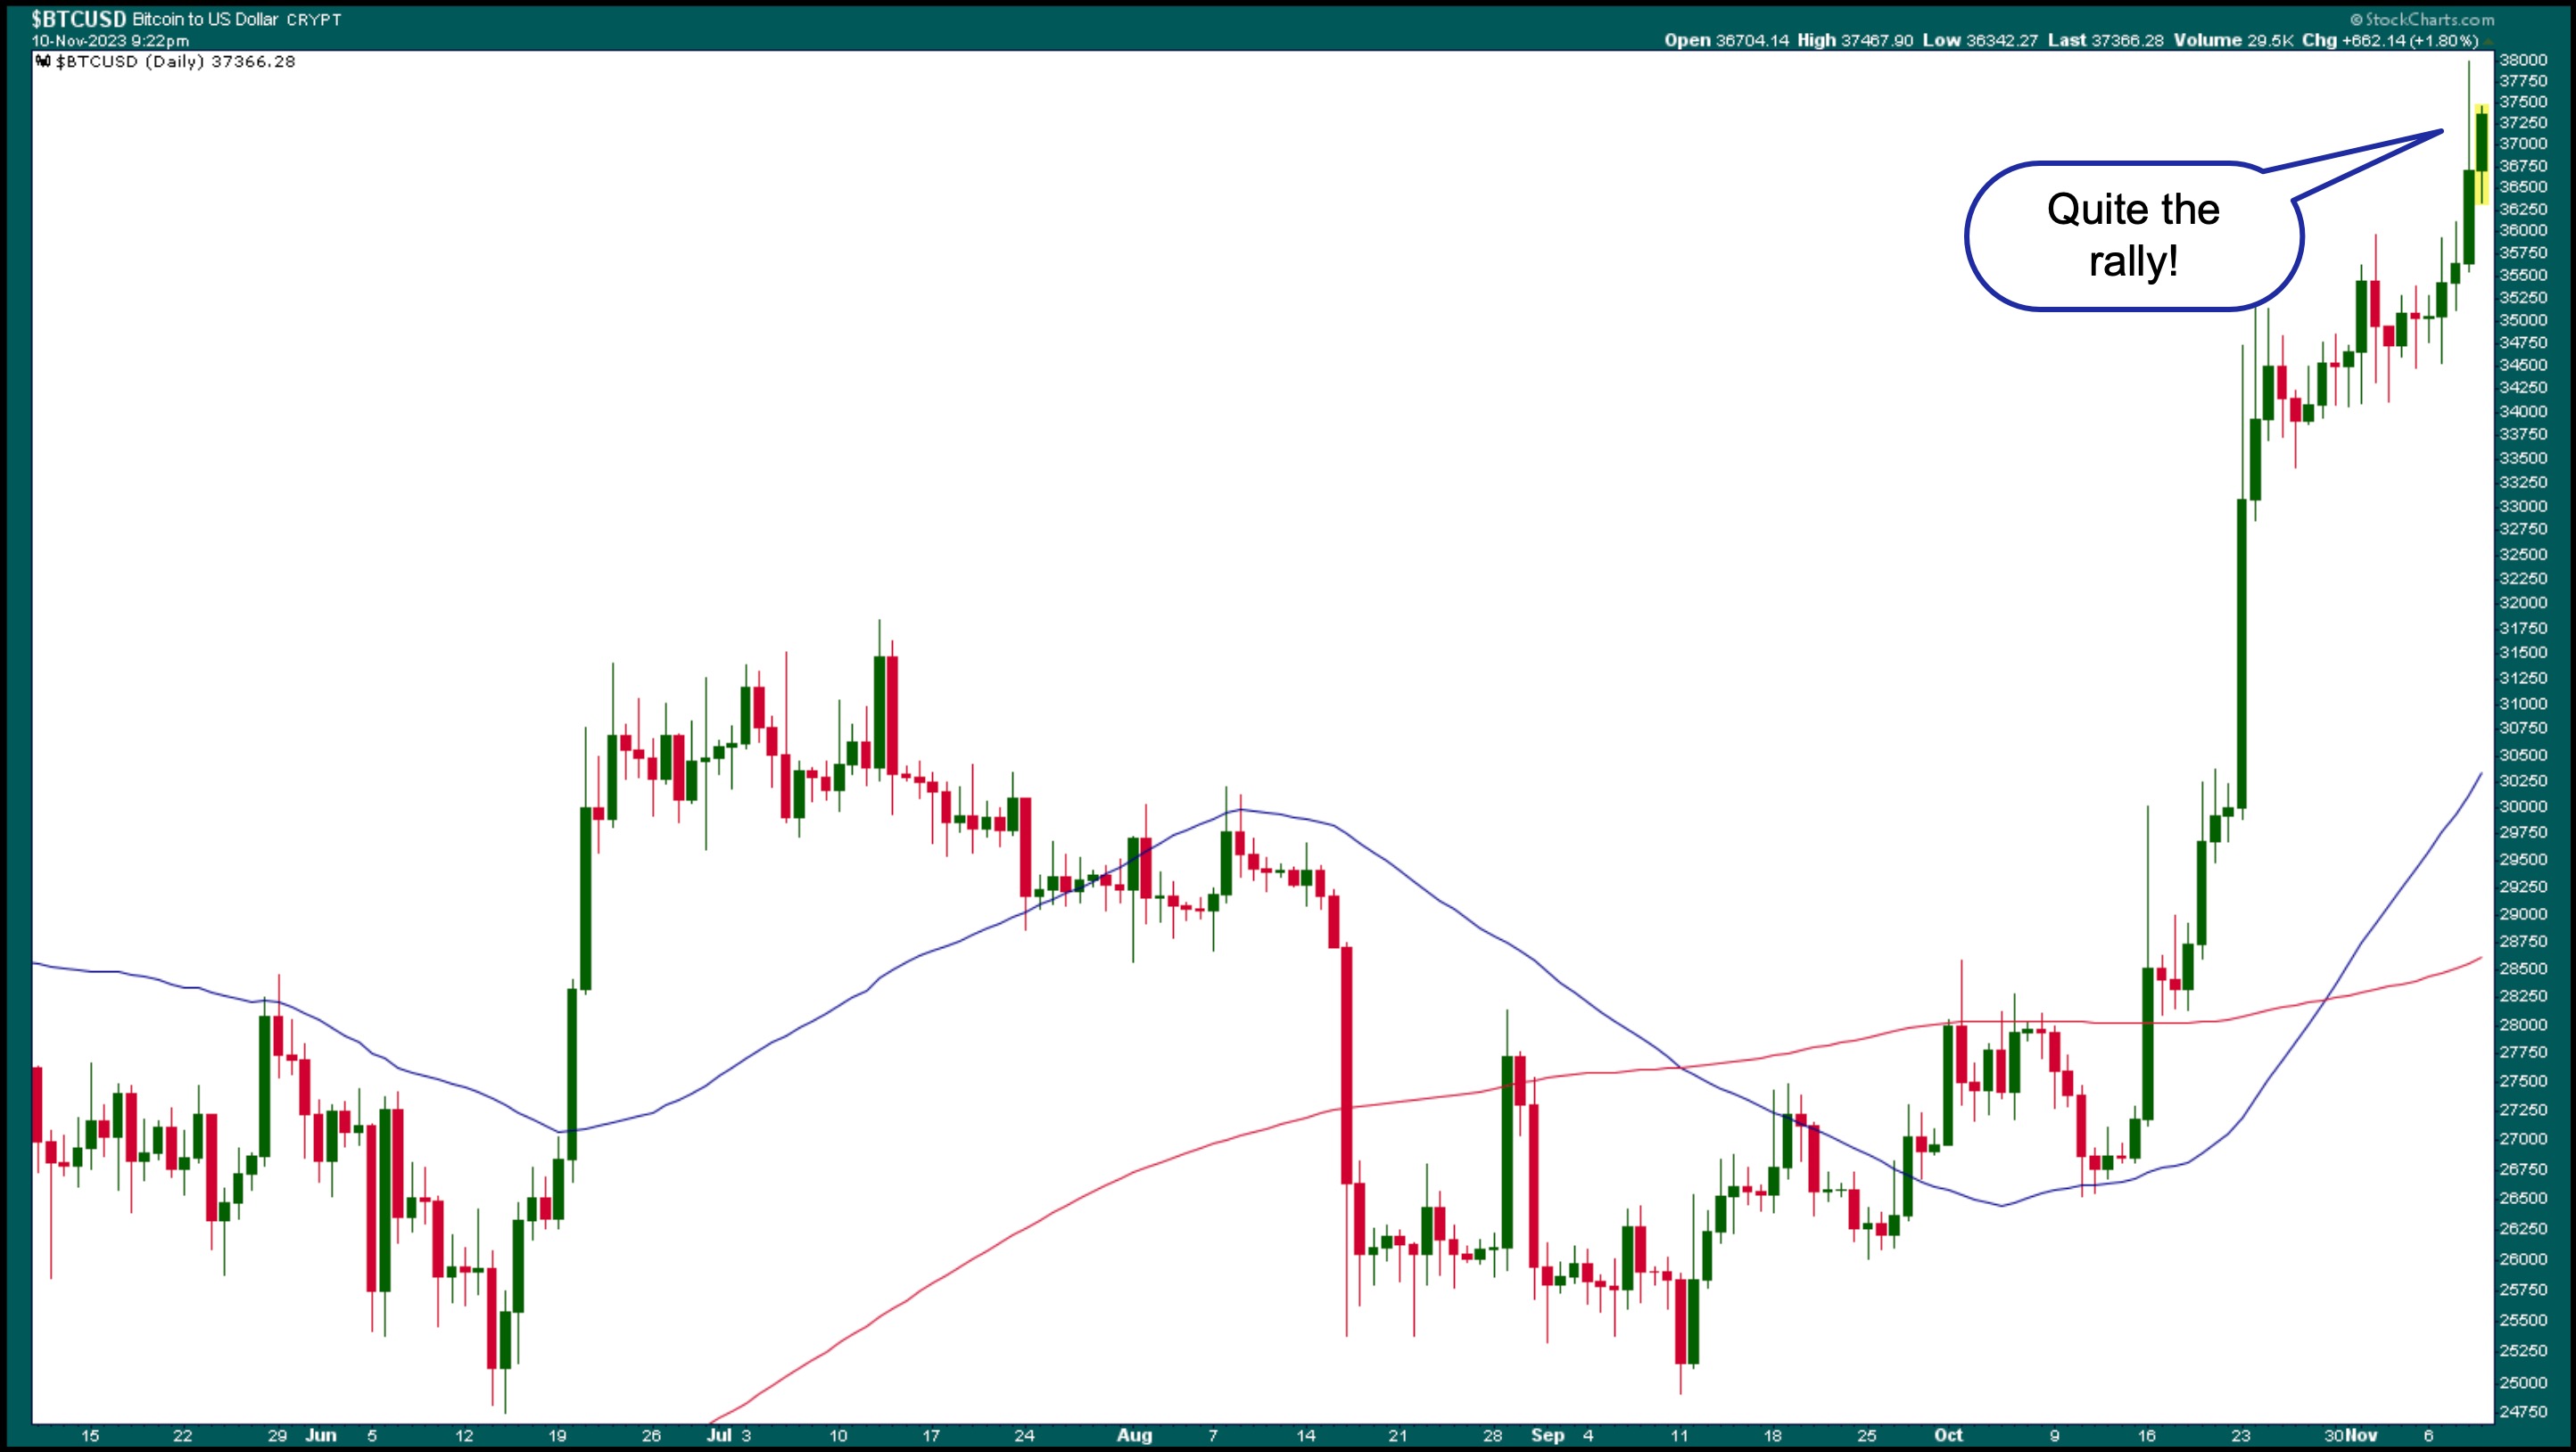
CHART 3: DAILY CHART OF BITCOIN TO US DOLLAR. Bitcoin rallied and ended the week higher than the 37,000 threshold level. Where to next? Chart source: StockCharts.com. for educational purposes.
So, what was behind the massive move in Bitcoin? The catalyst could be the hope that regulators would approve a spot Bitcoin exchange-traded fund. But with any fast move up, you want to identify how far it could keep moving higher. Looking at a weekly chart, the next possible resistance level would be at the 47,000 level, which is quite a bit higher than where Bitcoin is trading.
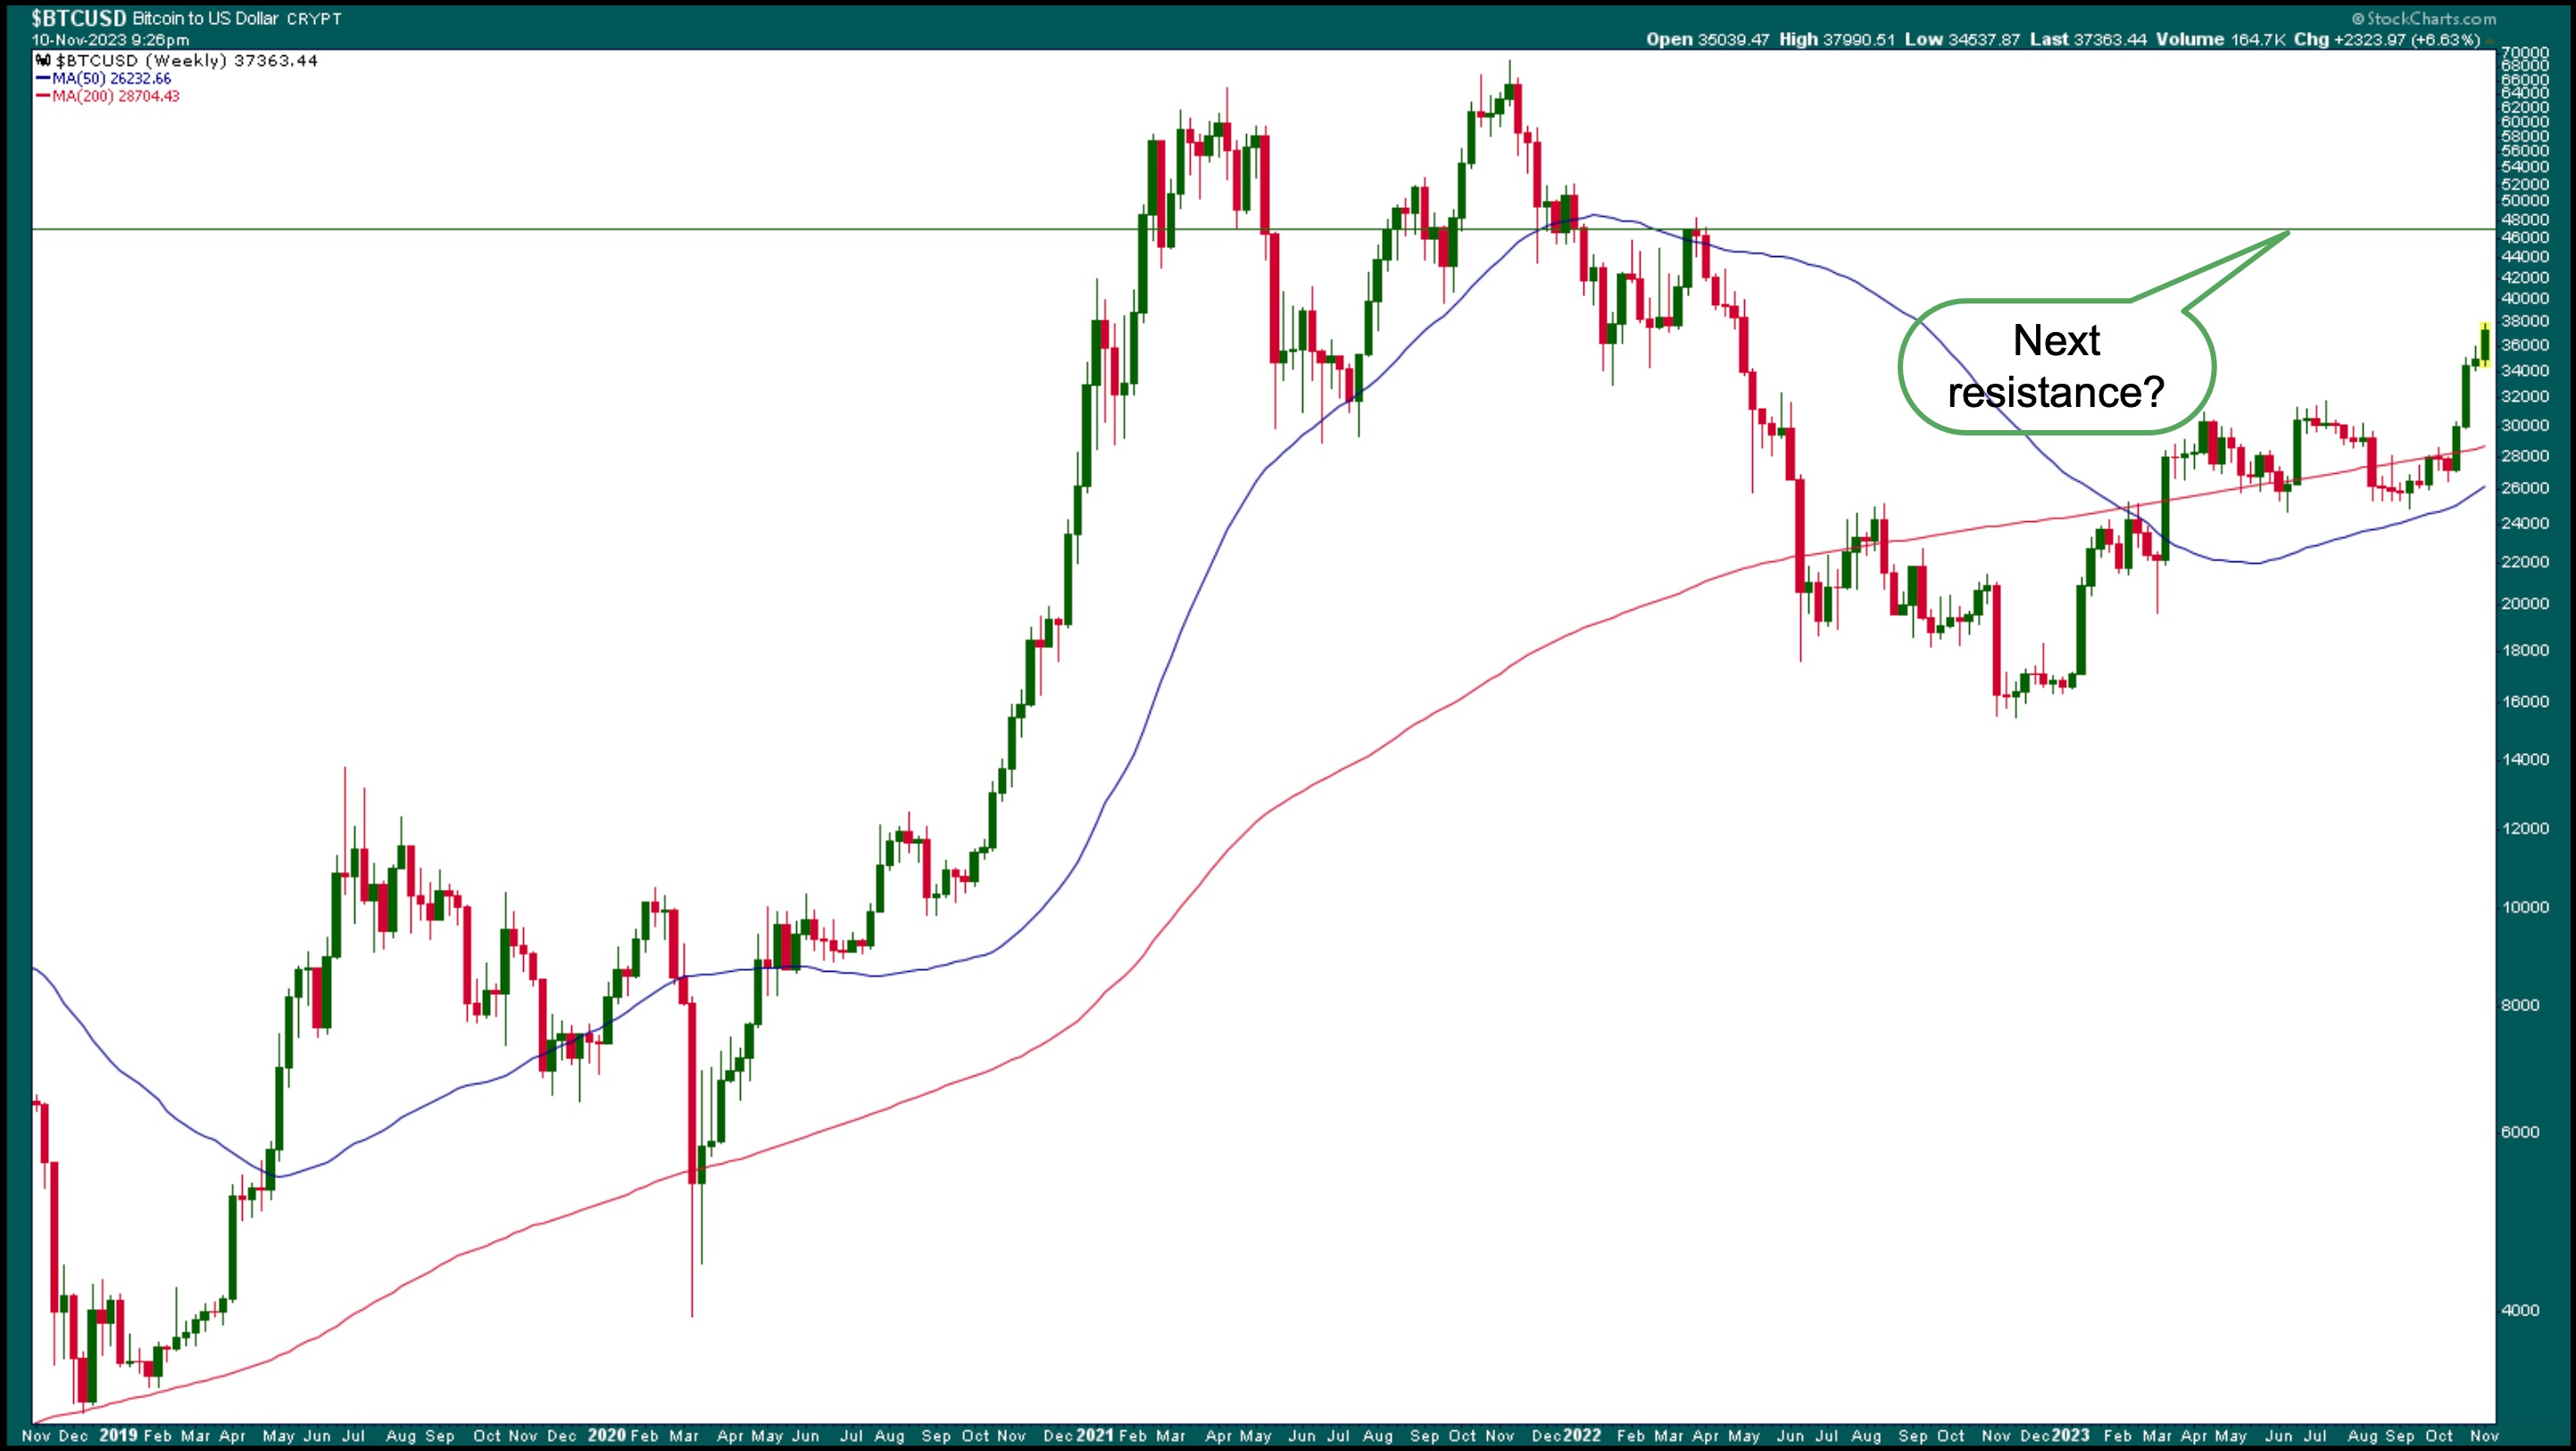
CHART 4: WEEKLY CHART OF BITCOIN TO US DOLLAR. Looking at the weekly chart, the next possible resistance level for the cryptocurrency could be around the 47,000 level. Chart source: StockCharts.com. For educational purposes.
What's On Deck?
Next week, investors will find out October's inflation CPI and PPI numbers. These data points have had an impact on the stock market's direction. Hotter-than-expected inflation numbers usually cause a selloff in equities. In an environment where investors are unsettled, not knowing whether the Fed will raise rates at least one more time, it's not unusual to see wild swings in either direction. But generally, investors aren't fearful, as can be seen in the chart of the CBOE Volatility Index ($VIX).
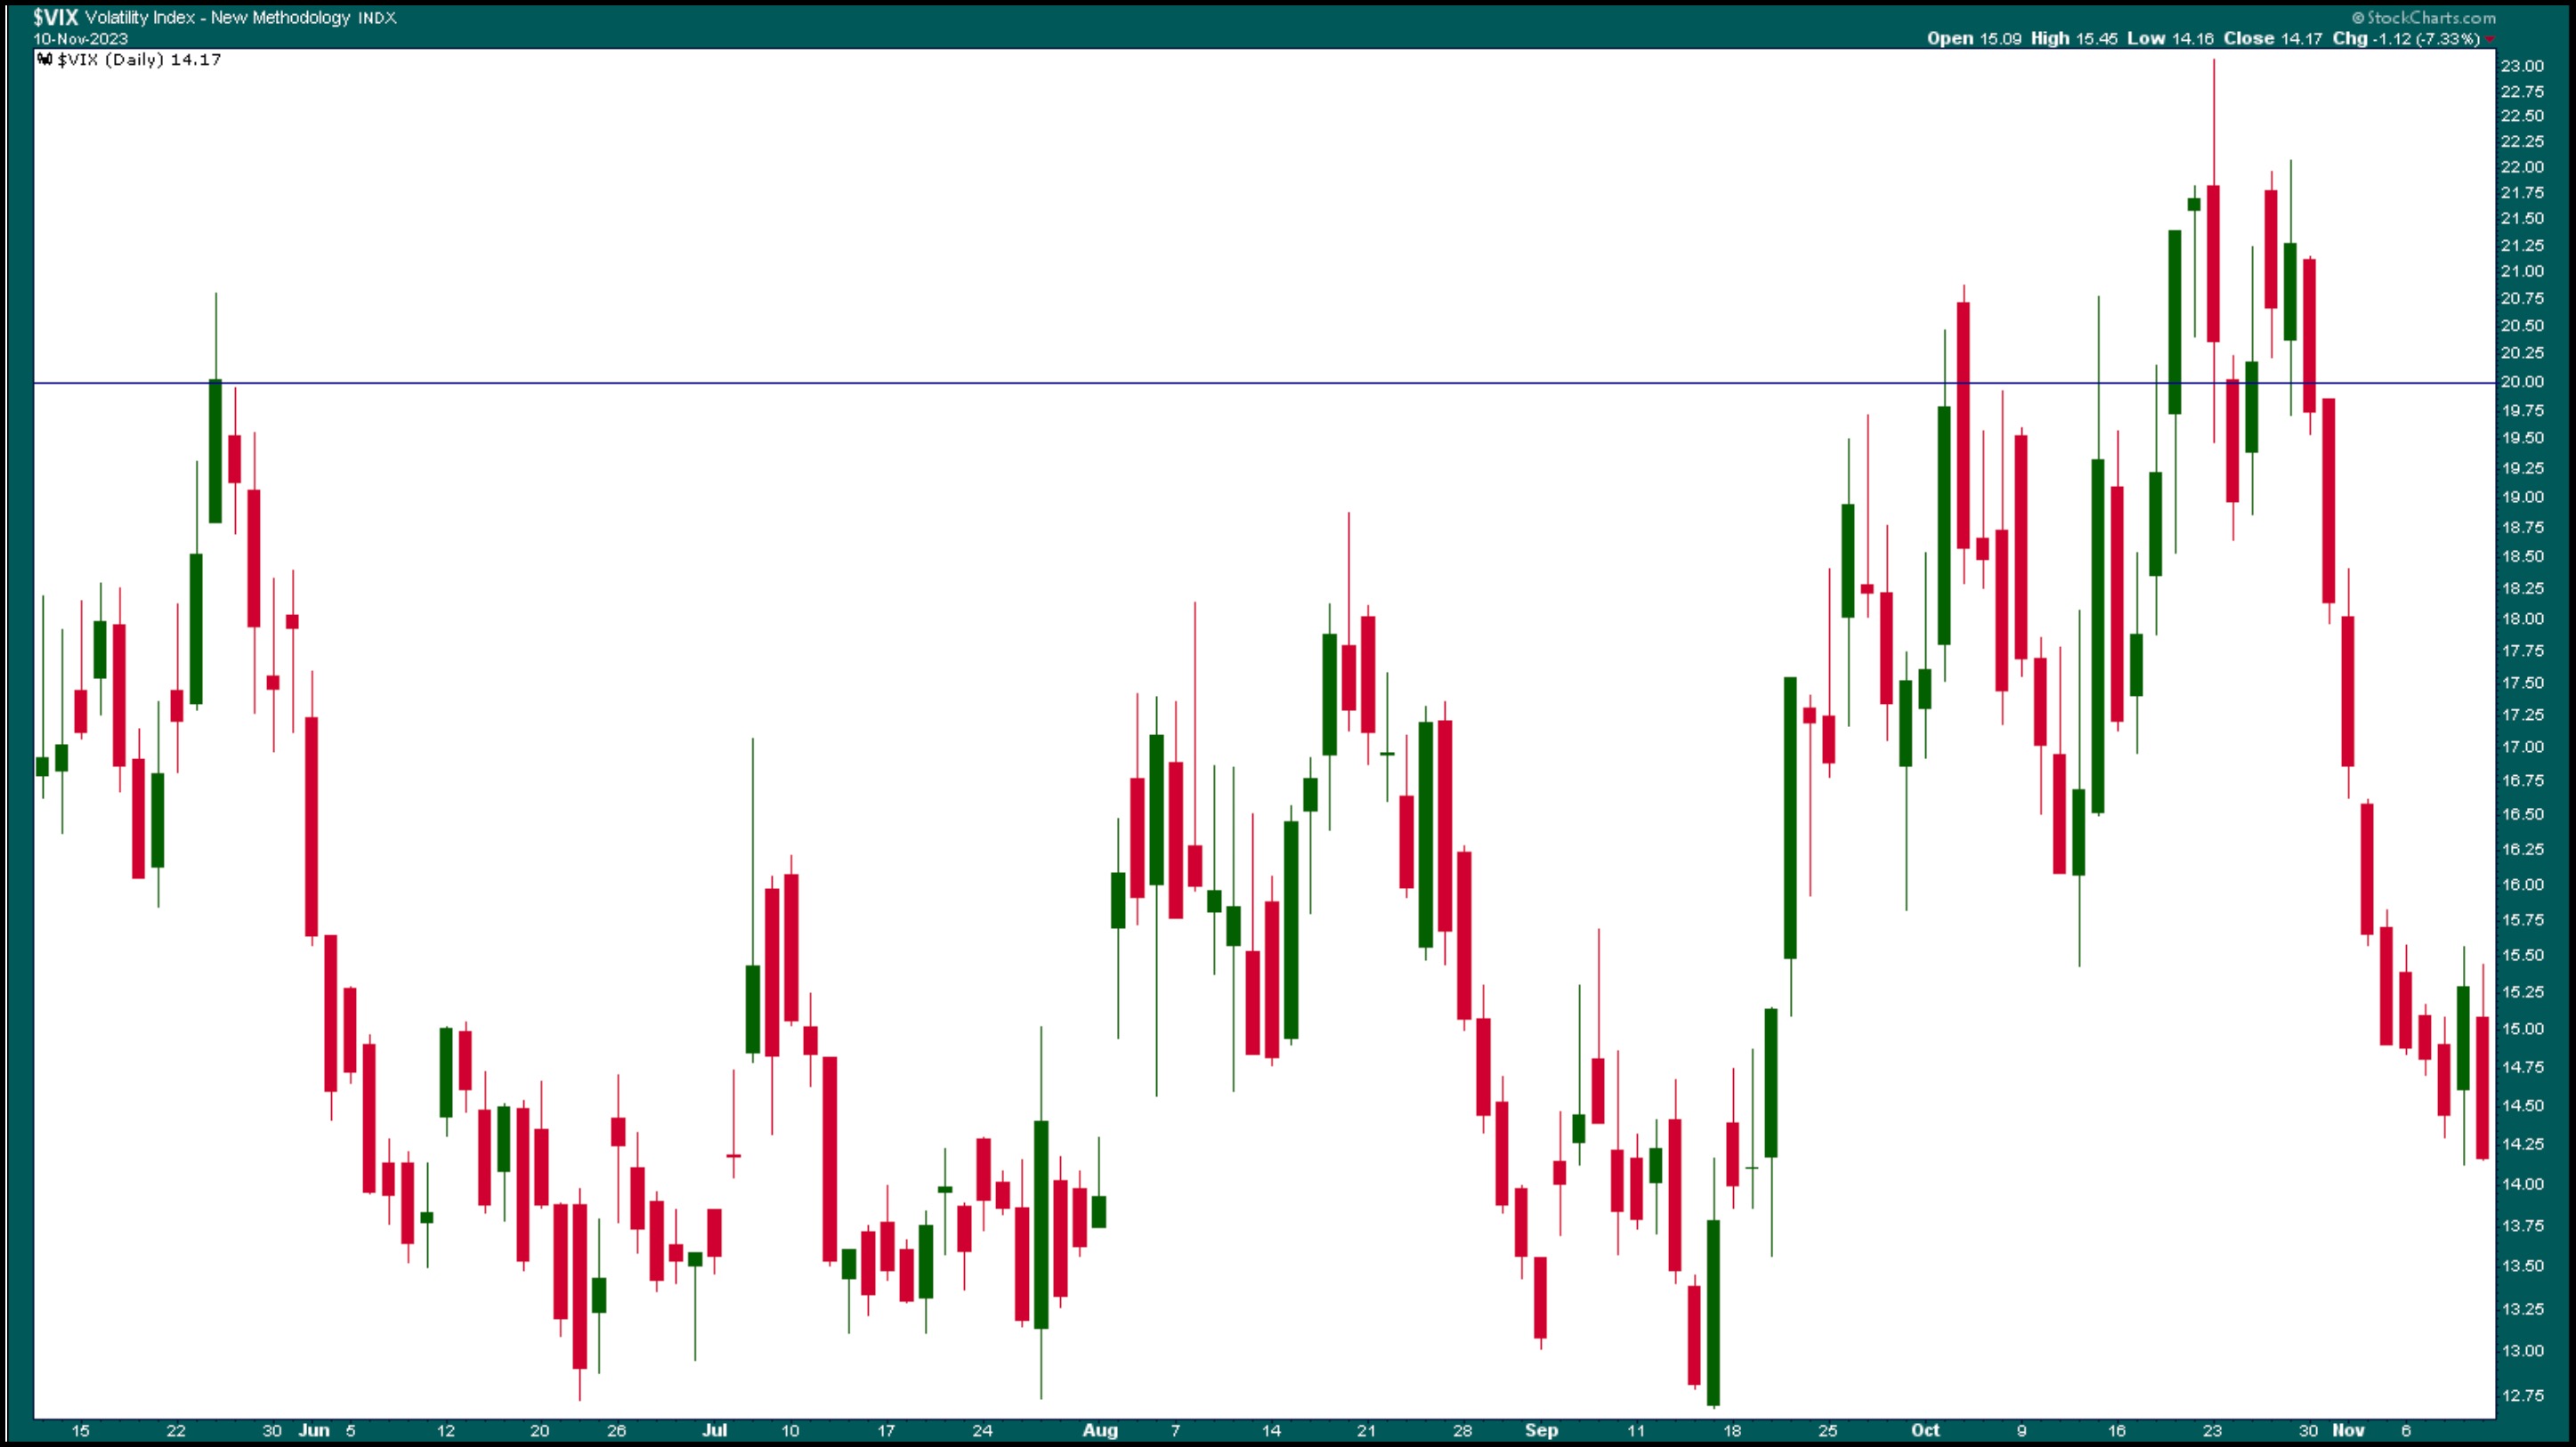
CHART 5: VIX KEEPS GOING LOWER. Investors aren't showing any signs of fear in spite of the indecisiveness. Chart source: StockCharts.com. For educational purposes.
Anything can bring back investor nervousness, but until that happens, it may be safe to reenter the market with small positions and be prepared to offload them if signs of fear resurface.
End-of-Week Wrap-Up

US equity indexes up; volatility down
- $SPX up 1.56% at 4415.24, $INDU up 1.15% at 34283.10; $COMPQ up 2.05% at 13798.11
- $VIX down 7.33% at 14.17
- Best performing sector for the week: Technology
- Worst performing sector for the week: Energy
- Top 5 Large Cap SCTR stocks: Vertiv Holdings, LLC (VRT); Palantir Technologies, Inc. (PLTR); Applovin Corp. (APP); New Oriental Education & Technology Group, Inc. (EDU); Super Micro Computer, Inc. (SMCI)
On the Radar Next Week
- October CPI
- Fed speeches
- October PPI
- October Retail Sales
- October Housing Starts
Disclaimer: This blog is for educational purposes only and should not be construed as financial advice. The ideas and strategies should never be used without first assessing your own personal and financial situation, or without consulting a financial professional.
Happy charting!
