TAKEAWAYS
- The stock market exhibited tentative behavior this week probably due to uncertainty about inflation and geopolitical developments
- S&P 500 index touched a high but pulled back to close slightly higher
- Crude oil prices broke above $75 but pulled back and is holding support at its 200-week simple moving average

Earnings, Bitcoin ETFs, inflation data, geopolitical tensions—lots of activity at the tail end of the trading week. And the pesky S&P 500 ($SPX) stopped short of closing at a new high.
Earnings season kicked off this week with JPMorgan Chase (JPM), Citigroup (C), Wells Fargo (WFC), and Bank of America (BAC) reporting Q4 results. Overall, earnings were a mixed bag with some misses and some beats, but that was because of Q4 charges some of the banks faced. Beneath the surface, the earnings may not be as bad as they appear. However, there is concern about how banks will perform in a lower interest rate environment. C shares closed higher.
Delta Airlines (DAL) also announced earnings, and although its earnings came in better than expected, weak forward guidance brought the stock lower. The stock fell over 8% on Friday, and the effects of this report rippled through the airline industry.
Another notable event this week was the SEC's approval of spot Bitcoin exchange-traded funds (ETFs). These ETFs will give investors more access to the cryptocurrency. When the news broke out, Bitcoin rallied, hitting a high of $49,435, but pulled back since then, ending the week at around $43,600. Many traders expected a "buy the rumor, sell the news" scenario to play out, so the pullback in Bitcoin isn't surprising.
We also got inflation data this week. December CPI came in higher than expected, suggesting that inflation is still hot. But the PPI fell 0.1% and came in below expectations, which calmed investors, though they still seem hesitant. Wages are still rising, but energy and raw material costs are declining. The 10-year Treasury Yield ($TNX) pulled back after hitting resistance at its 200-day moving average (see chart below).
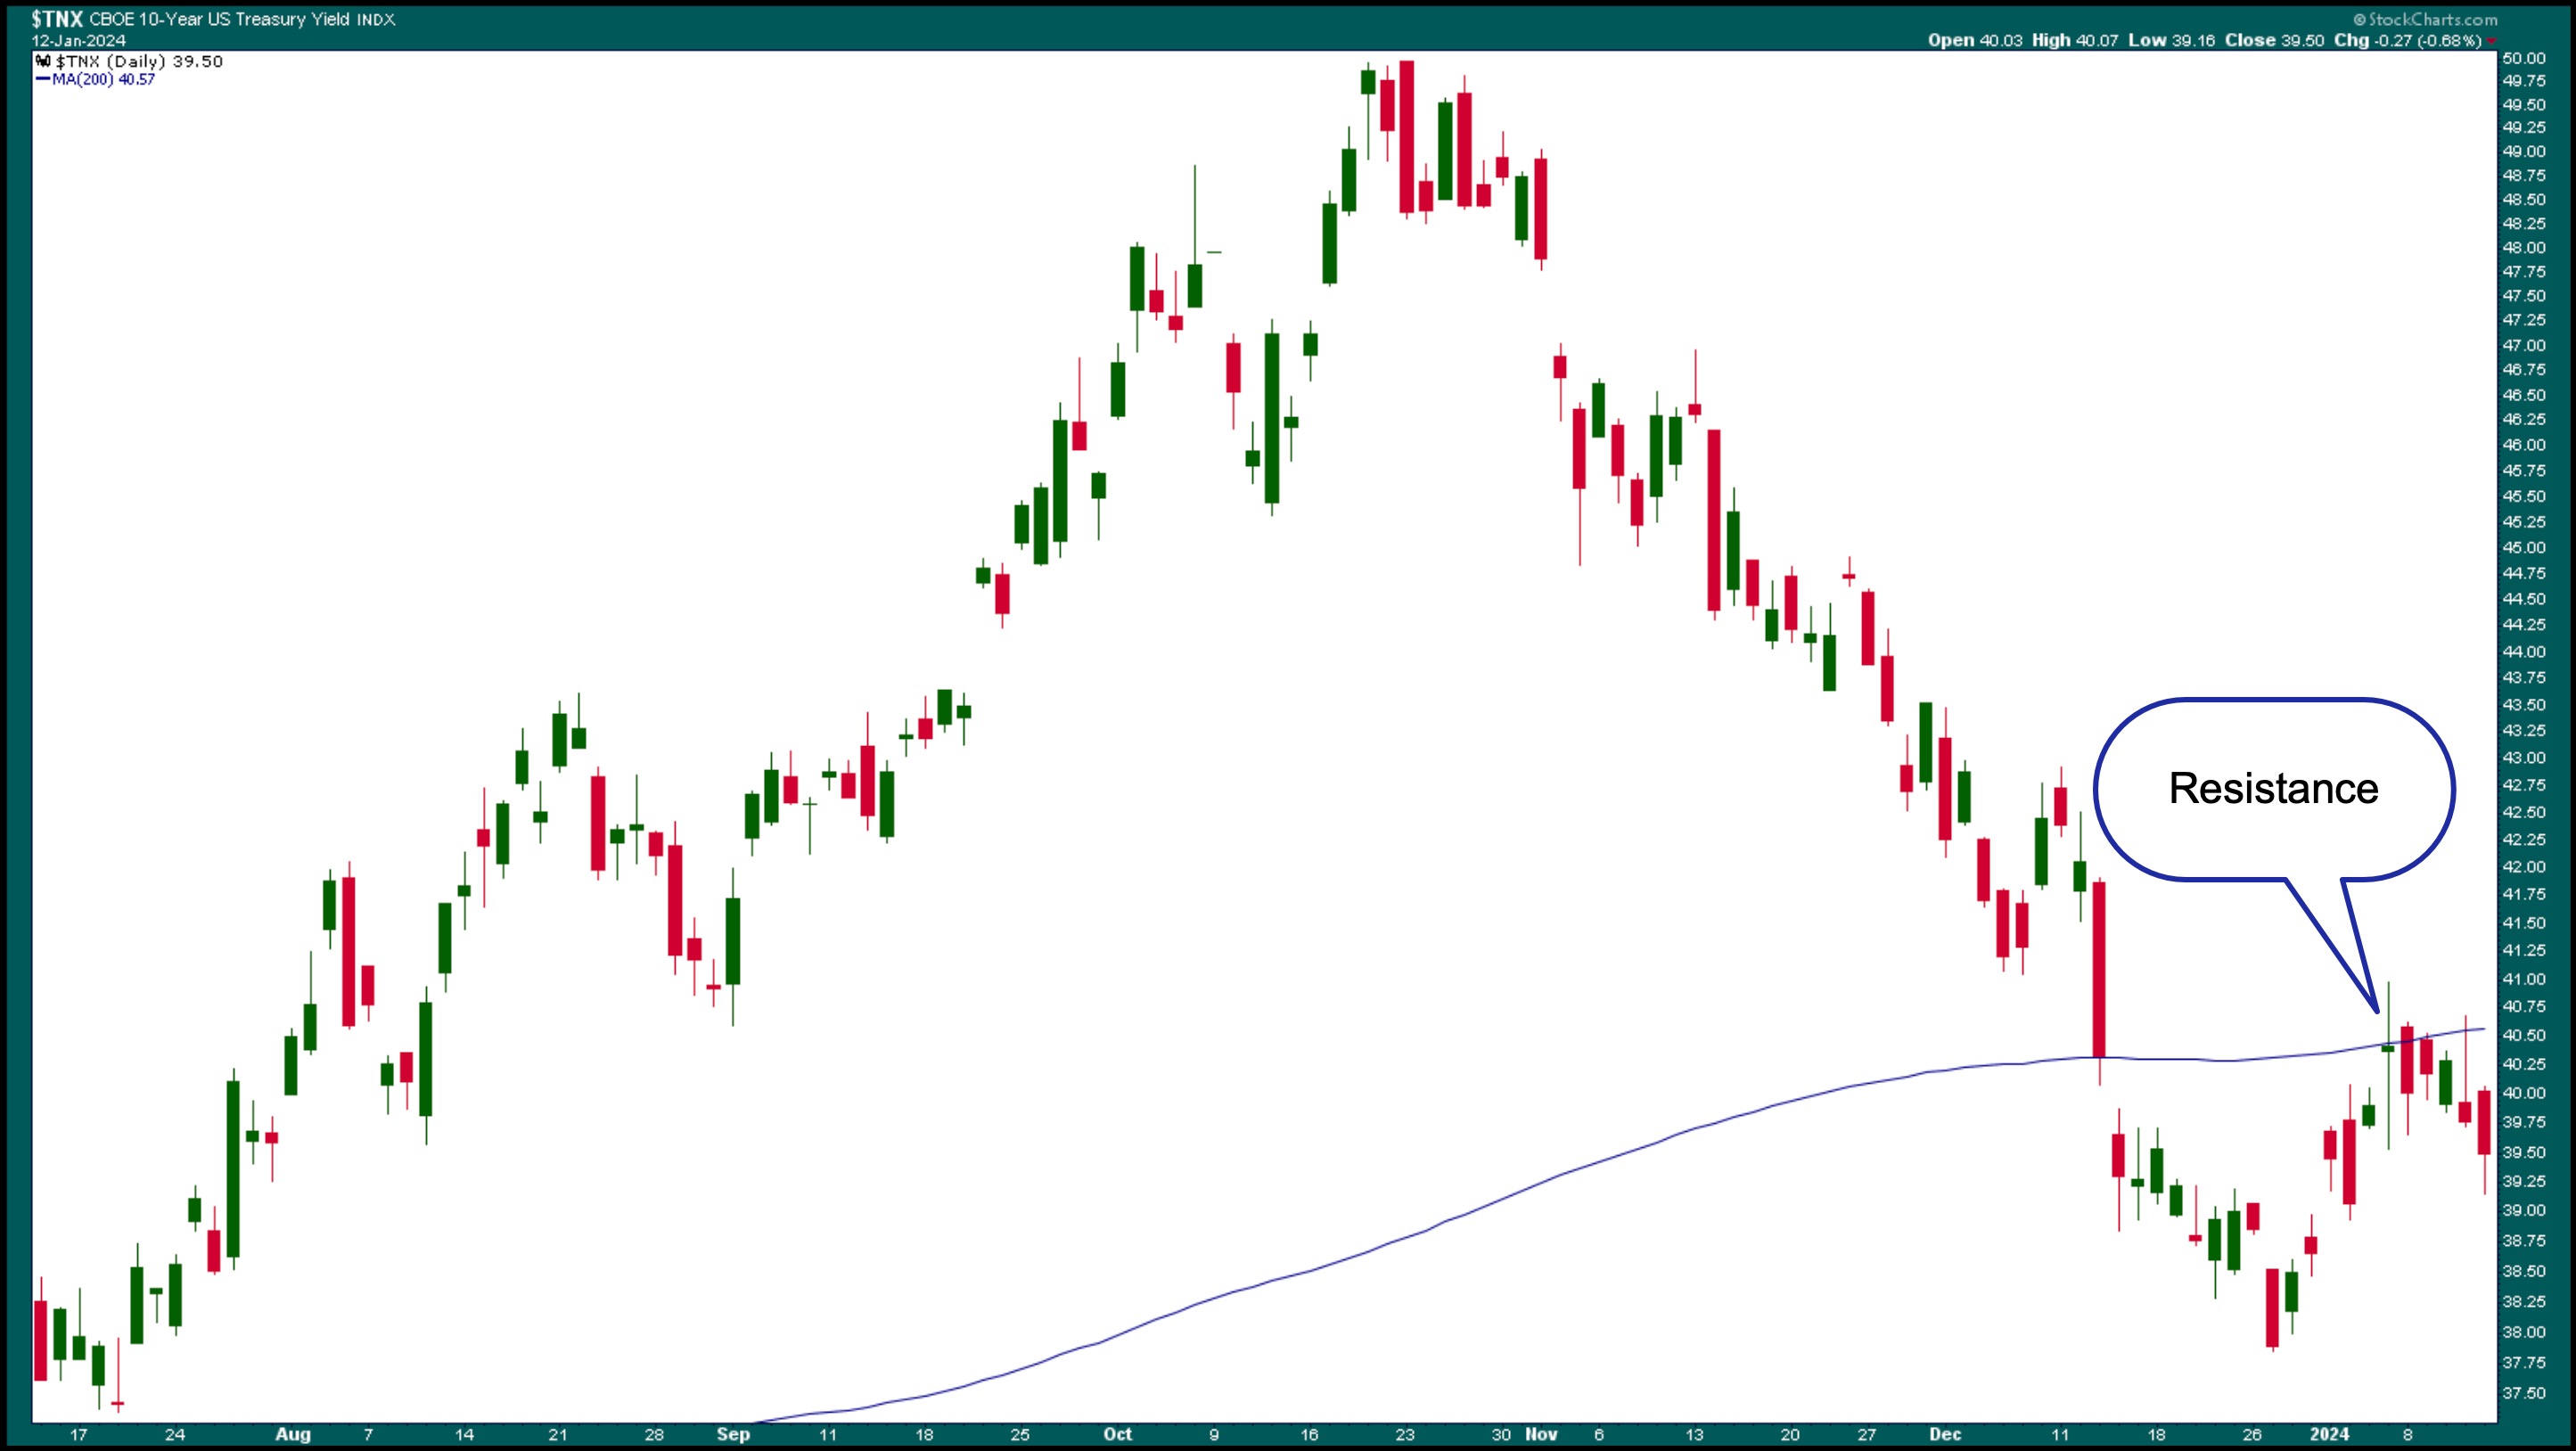
CHART 1. TREASURY YIELD PULLS BACK. The 10-year Treasury Yield moved higher, but pulled back after hitting resistance at its 200-day simple moving average.Chart source: StockCharts.com. For educational purposes.
So far this year, there's been some up and down movement in the stock market, but if you look at a daily chart of the S&P 500 ($SPX), it has held on to the support of its 21-day exponential moving average (EMA) and is close to reaching its all-time high. During Friday's trading, the S&P 500 hit a high above 4800, but pulled back. It isn't unusual for an index like the S&P to test a key resistance level. If earnings come in strong next week, there's a chance the index could close at an all-time high.
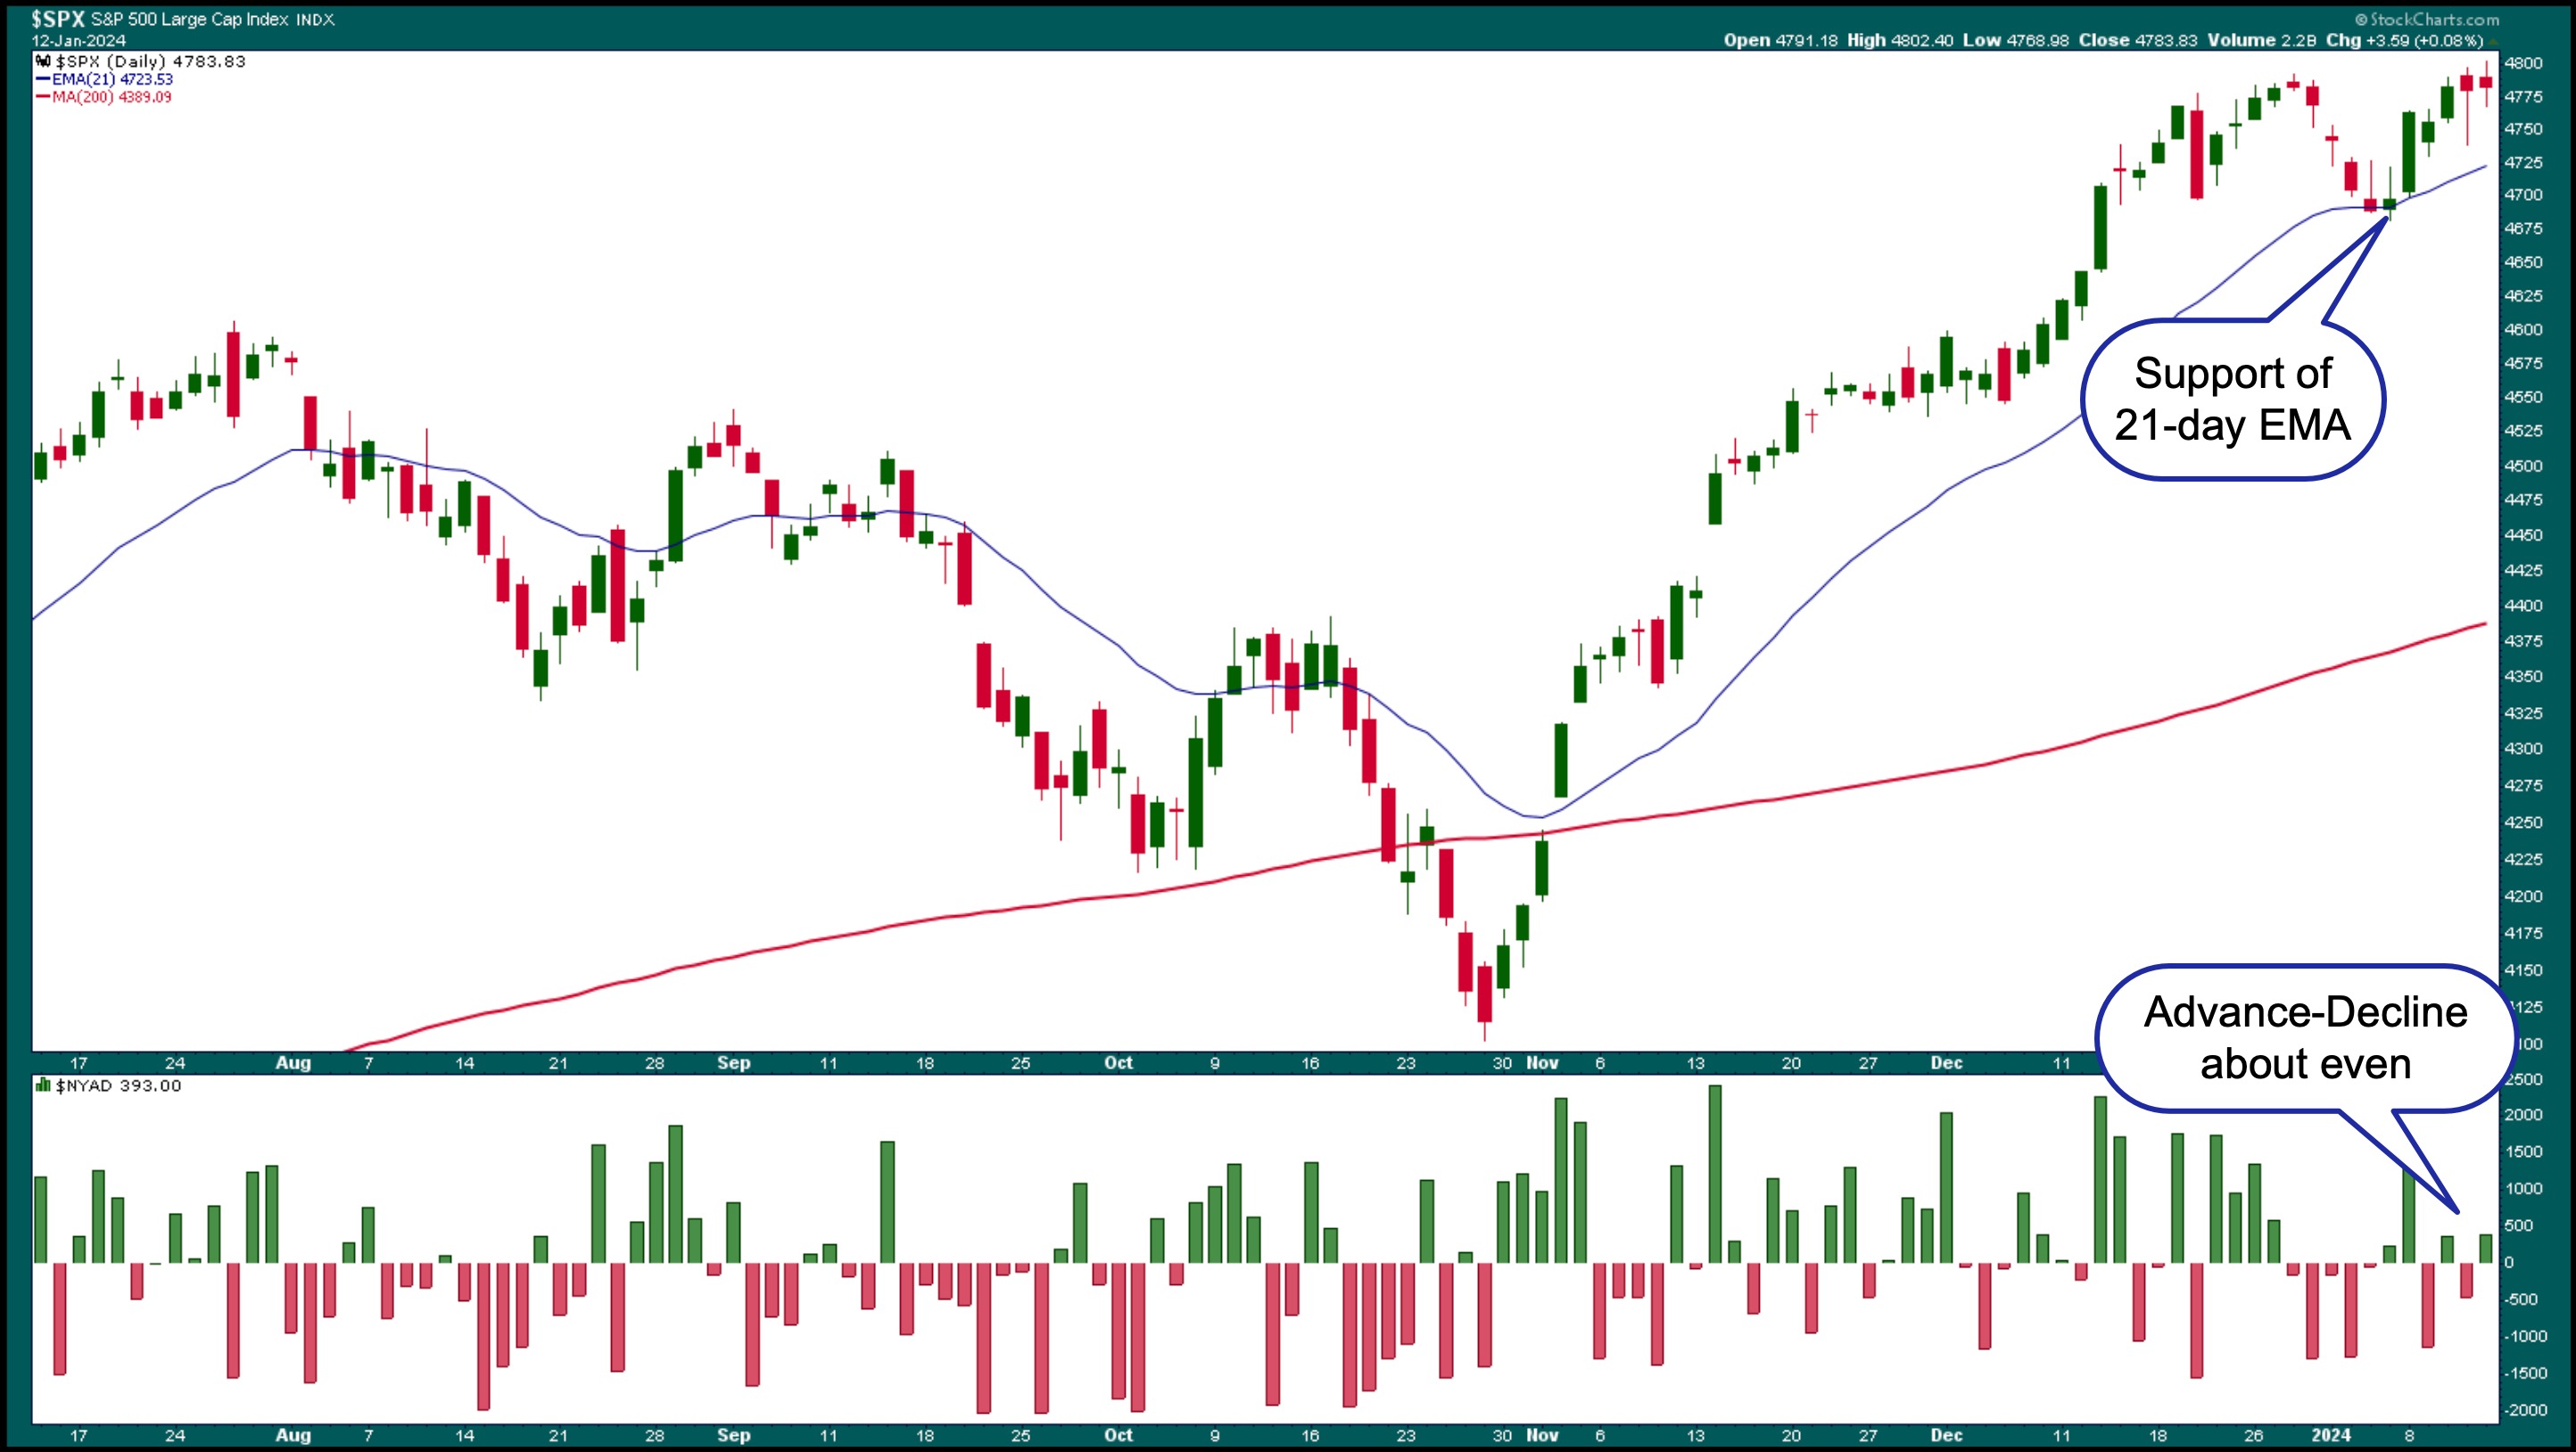
CHART 2. S&P 500 HOLDS SUPPORT. Even though the S&P 500 didn't close at a new high, it's still holding support, and the NYSE advance-decline line is showing even sentiment between bulls and bears.Chart source: StockCharts.com. For educational purposes.
The market internals are also holding steady. In the above chart, the NYSE Advance-Decline Line in the lower panel indicates that the number of advances vs. declines is pretty balanced. The CBOE Volatility Index ($VIX) climbed higher the first week of the month, but the index has settled back to below 13. This indicates that investors are still calm.
Given the further escalation of geopolitical tensions in the Red Sea, it wouldn't be out of reach for investors to be hesitant to add positions ahead of the holiday weekend. Crude oil prices moved higher and broke above $75 per barrel on this news, but pulled back. Looking at the weekly chart of crude oil below, it's holding support at the 200-week simple moving average (SMA).
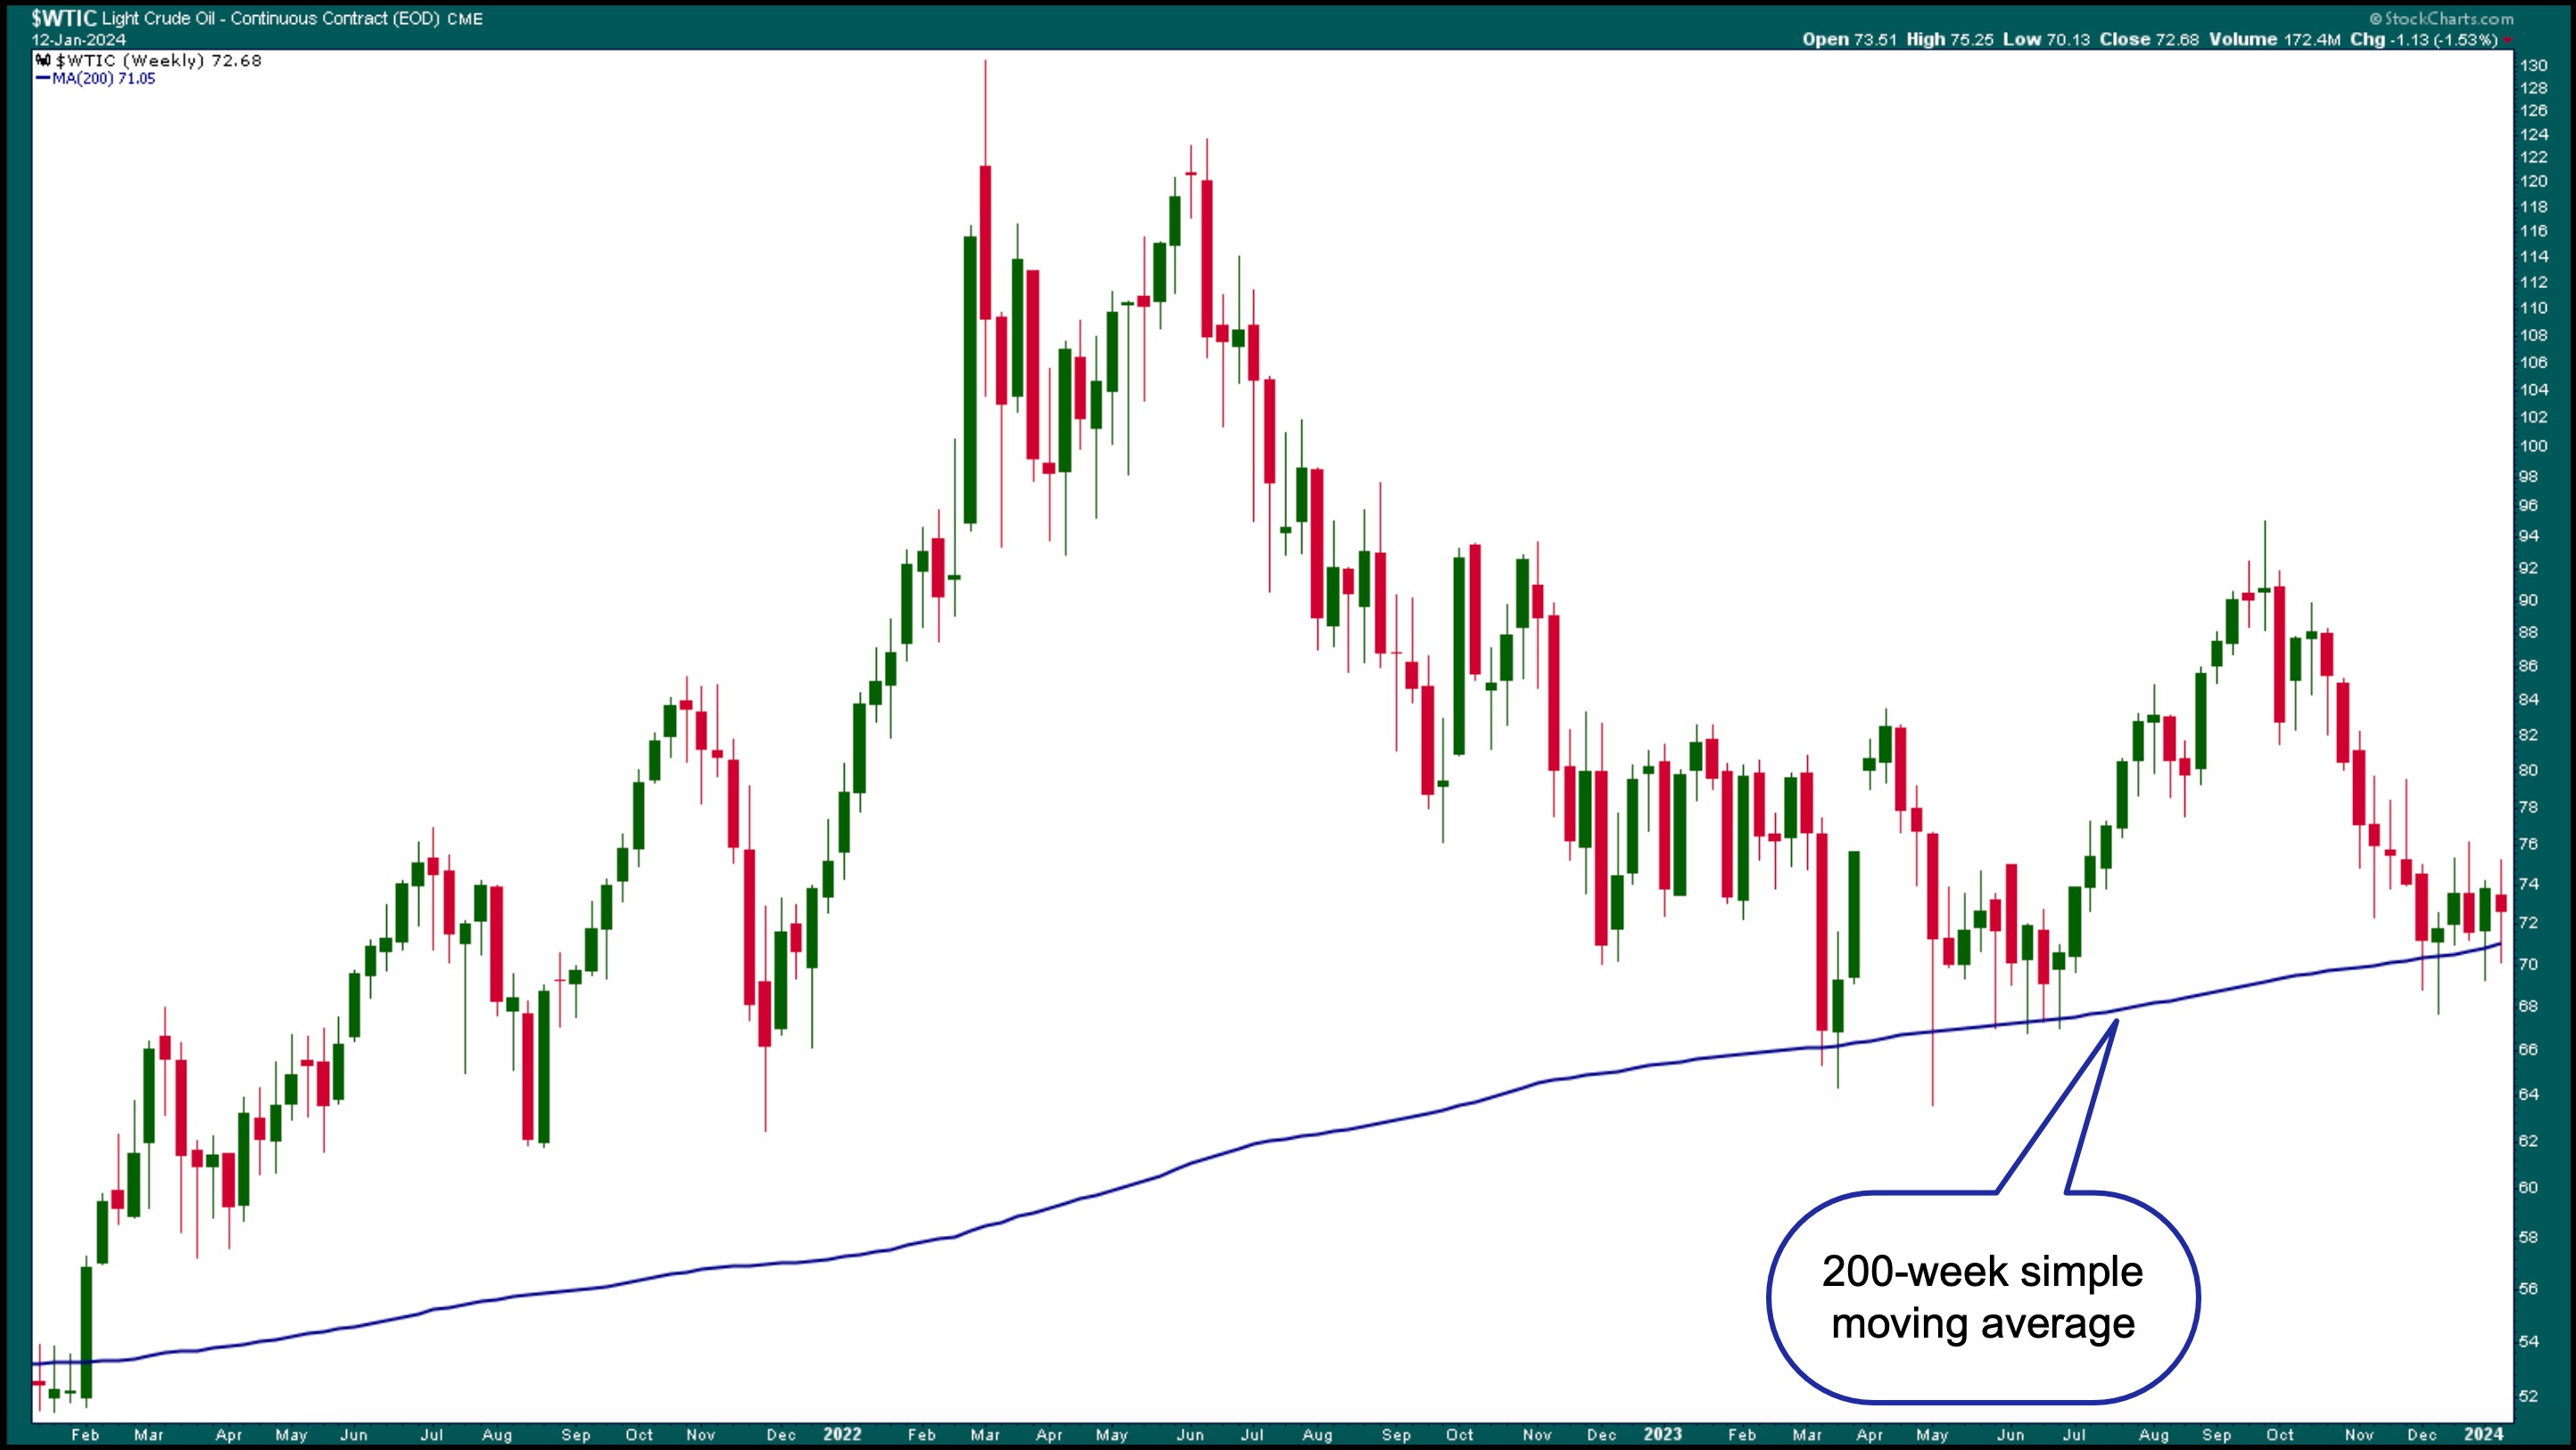
CHART 3. CRUDE OIL HOLDS SUPPORT AT 200-WEEK MOVING AVERAGE. Crude oil prices rose on news of tensions in the Red Sea, but pulled back.Chart source: StockCharts.com. For educational purposes.
Shipping stocks also rose today on the news. Many shipping exchange-traded funds (ETFs) such as SonicShares Global Shipping (BOAT), US Global Sea To Sky Cargo (SEA), and Breakwave Tanker Shipping (BWET) gapped higher on Friday.
The S&P 500 is getting a little toppy, so it's not surprising that investors are extra cautious. If conditions are stable and the stock market moves higher next week, it may be time to keep your eyes peeled for any signs of market weakness. Even the stock market can't anticipate geopolitical tensions, so it's best to stay alert.
End-of-Week Wrap-Up

- $SPX up 0.08% at 4783.83, $INDU down 0.31% at 37592.98; $COMPQ up 0.02% at 14972.76
- $VIX up 2.09% at 12.70
- Best performing sector for the week: Technology
- Worst performing sector for the week: Energy
- Top 5 Large Cap SCTR stocks: Affirm Holdings (AFRM); USX-US Steel Group (X); Crowdstrike Holdings, Inc. (CRWD); Karuna Therapeutics, Inc. (KRTX); Vertiv Holdings (VRT).
On the Radar Next Week
- Earnings week continues, with Goldman Sachs (GS), Morgan Stanley (MS), Charles Schwab (SCHW), Taiwan Semiconductor (TSM), and American Airlines (AAL) reporting.
- December Housing Starts
- December Existing Home Sales
Disclaimer: This blog is for educational purposes only and should not be construed as financial advice. The ideas and strategies should never be used without first assessing your own personal and financial situation, or without consulting a financial professional.
Happy charting!
