What's New
SPRING PRODUCT RELEASE | JUNE 2023
Spring is in full bloom here at StockCharts with a huge collection of dynamic new tools and features that just rolled out around the site as part of our latest sitewide product release. We've put together some highlights below to help you learn more about all that's included in our recent update.
AND THAT'S NOT ALL . . .
We're giving you an early sneak peek at what else is coming soon to StockCharts. While our team puts the finishing touches on these new charting features, powerful trading tools and exciting enhancements across the entire site, we're pulling back the curtains now to give you an inside look. CLICK HERE to see more!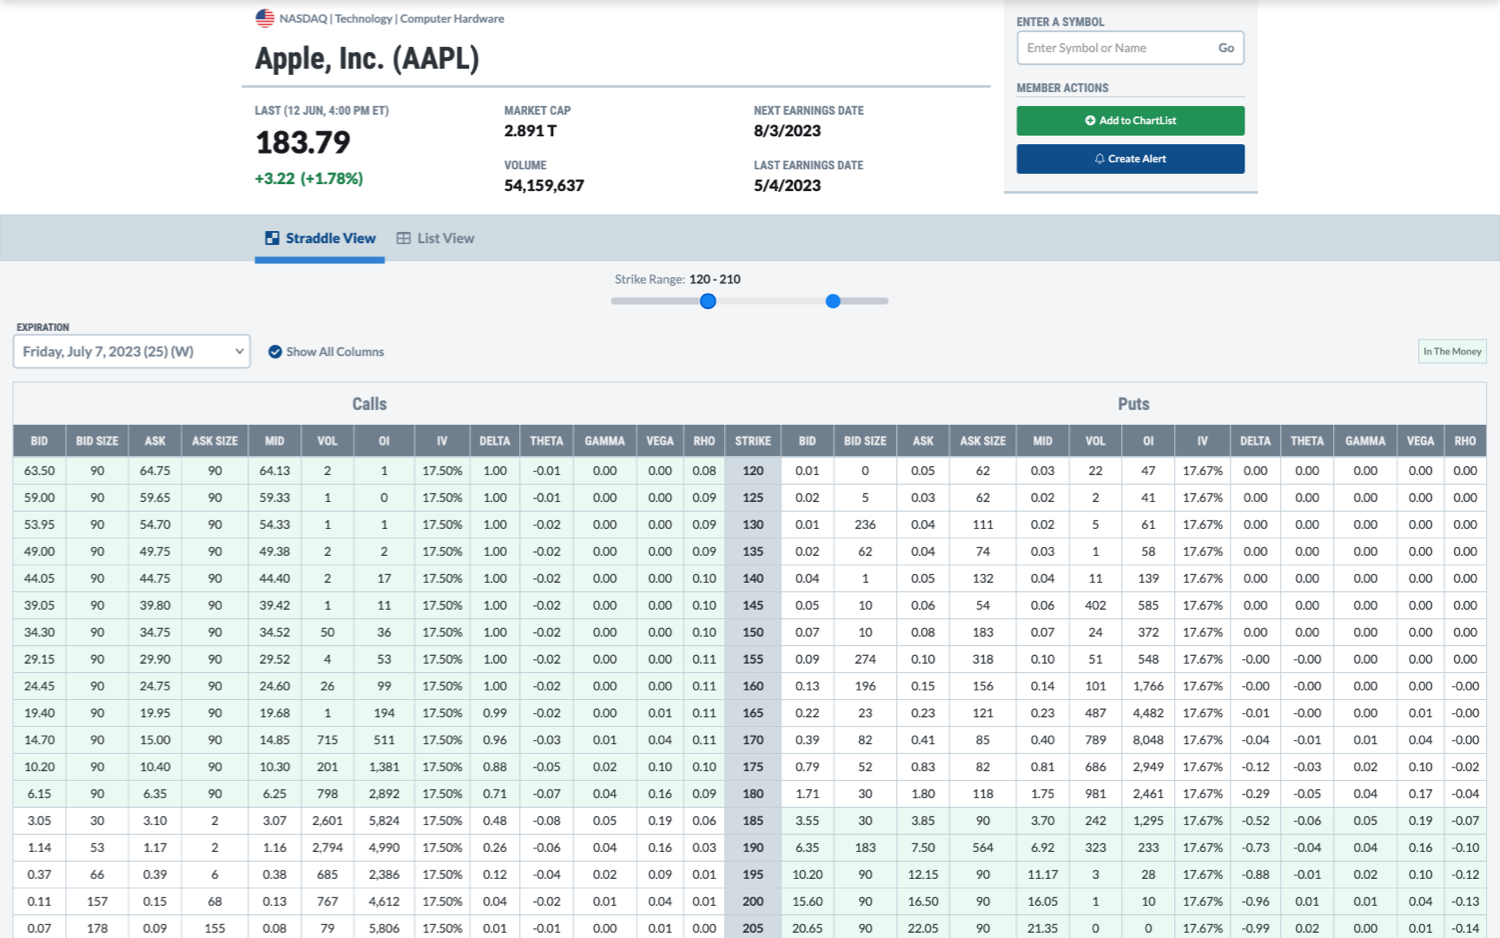
OPTIONS
Expanded Options Quote Tools, Now With Greeks Data
In partnership with Tony Zhang and the team of experts at OptionsPlay, we've greatly expanded our options data support.
The options summary page now includes full Greeks coverage for delta, theta, gamma, vega and rho values, plus improved column customizations for both the Straddle View and List View. A new "strike range" slider also gives you more control over the options quotes you see. And of course for StockCharts Members, all of these exciting updates are also available for your ChartLists with the "Options View".
MOBILE APP
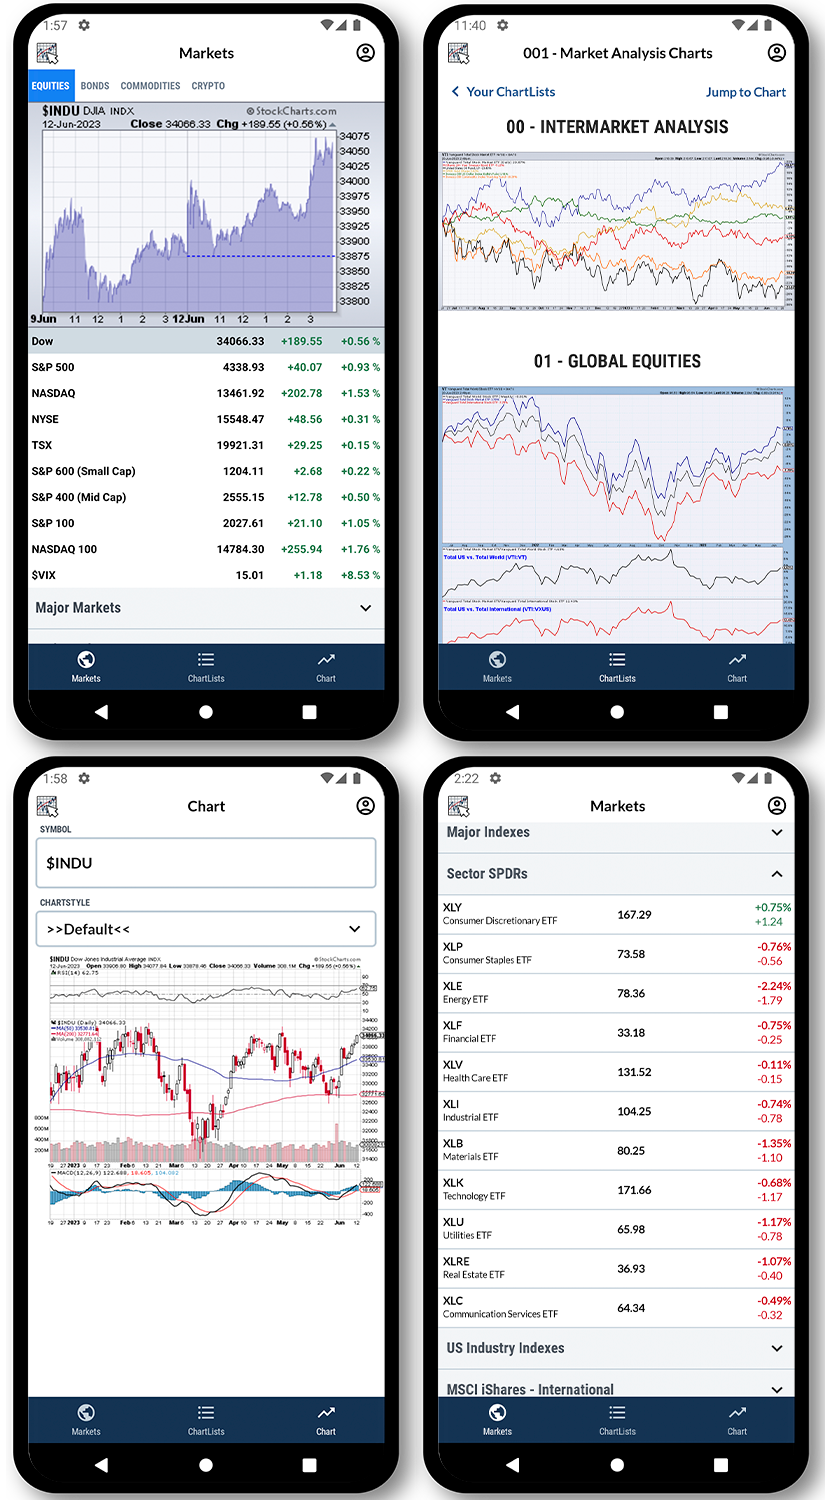
The StockCharts Mobile App For Android Devices
The official StockCharts mobile app for Android devices is now available, bringing you easy access to the markets and your charts anywhere, anytime.
See a detailed summary of the current markets, including stocks, bonds, commodities, major indexes, sectors, cryptocurrencies and much more. Access all of your ChartLists and quickly swipe through your saved charts within the app. Plus, view advanced real-time charts for any symbol with any of your saved ChartStyles to easily apply different indicators and settings.
TO INSTALL OUR MOBILE APP: Open the Google Play Store on your phone or tablet and search for "StockCharts app", or use the QR code below:


EARNINGS
Earnings And Revenue History Now On The Symbol Summary Page
Our Symbol Summary page is now equipped with earnings and revenue data for US stocks. Track top and bottom line quarterly results and compare against consensus estimates, or view annual results for the past four years. You can even choose your display format by toggling between Chart View and Table View.
ALERTS
Add Custom Messages To Any Of Your Technical Alerts
No more forgetting with that alert was for! With the new "Message" feature for both Price Alerts and Advanced Alerts, you can include your own custom note alongside any technical alert.
Leave yourself a reminder or add some context to enhance this powerful trading tool. When the alert is triggered, your message will appear in the email notification and on the results page for your alert.
DATA
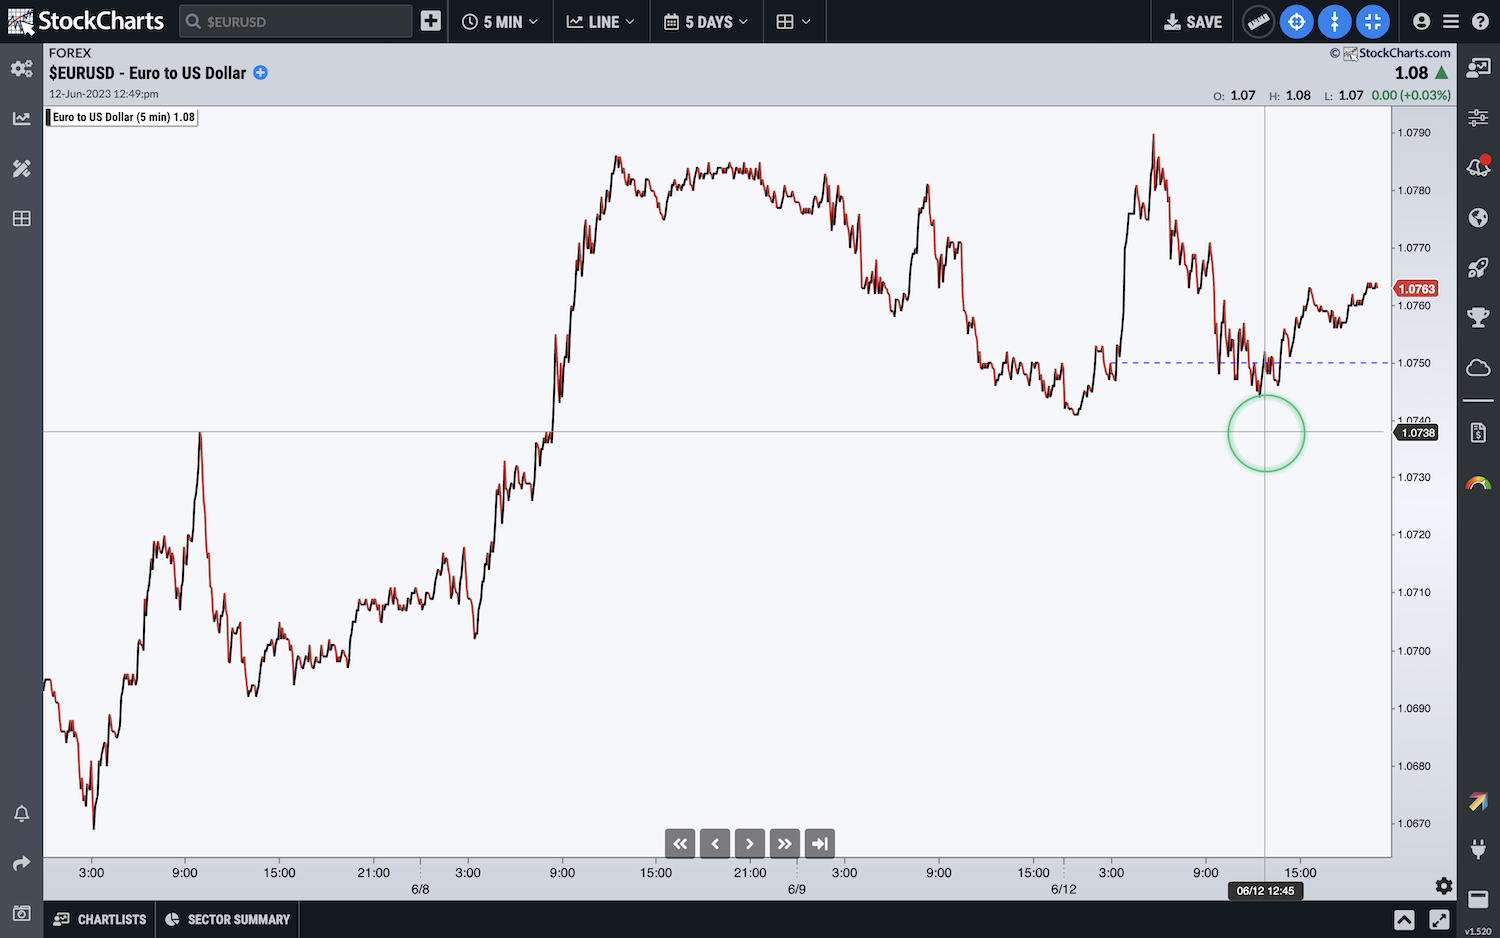
Intraday FOREX Data Now Available
Currency traders rejoice! We've bolstered our data coverage with official real-time intraday data for forex pairs. You can now track and chart a wide range of global currencies with this enhanced support.
ACP
Sector Summary Tool Integrated Directly Into The ACP Drawer
Our Advanced Charting Platform has been further enhanced with the "Sector Summary" tool, a favorite amongst StockCharts users and one of the quickest, easiest, most effective ways to find strong stocks and funds in just a few simple clicks. By drilling into the strongest sectors and then the strongest industry groups within, you can quickly find a list of promising stocks in leading groups.
You'll now find the Sector Summary tool built directly into the drawer at the bottom of ACP. Click through the sectors, industry groups and stocks and quickly chart any symbol along the way.
ACP
Dynamic Measurement Tool Brings More Data And New Insights To Your Chart Analysis
In addition to the crosshairs, you can now turn on "measurement mode" in ACP and put even more charting power at your fingertips. Hover over your charts and click to measure price changes, percentage gains and losses, bar counts and indicator moves in any direction - all on the fly and with pinpoint accuracy.
ACP
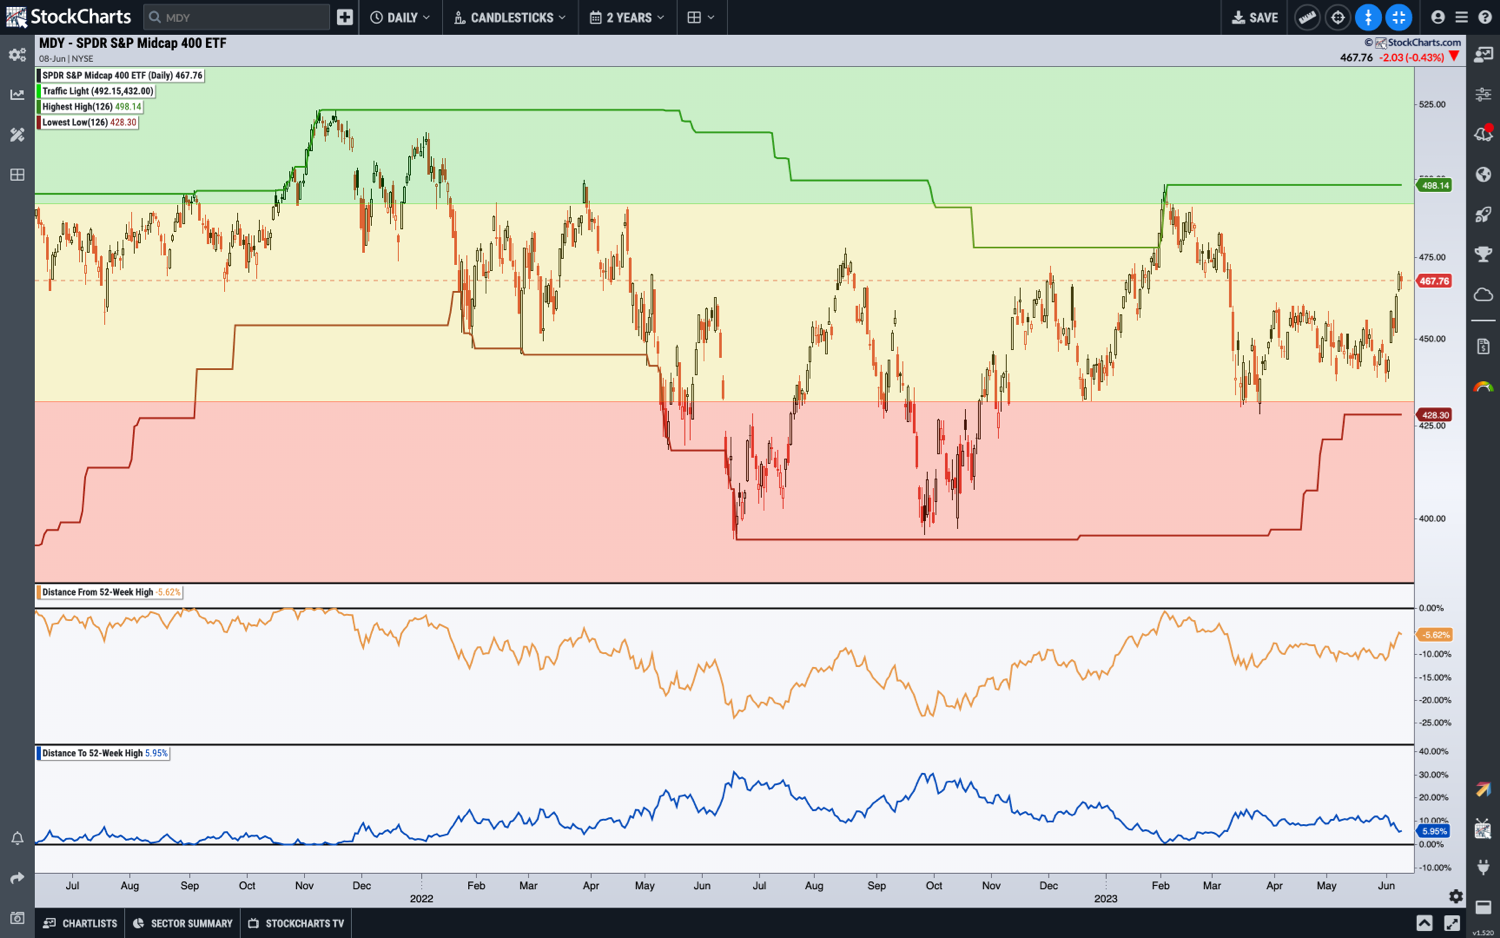
7 New Technical Indicators To Help You Chart Highs, Lows, And Other Key Price Levels
We've added a unique collection of technical indicators designed to help you identify crucial support and resistance levels and more easily determine how far any security is trading from new highs or lows.
- Traffic Light: shades the chart based on the bullish, bearish and neutral zones that you set
- Highest High Value: displays the security's highest trading level over a specific number of periods
- Lowest Low Value: displays the security's lowest trading level over a specific number of periods
- Distance From Highs: displays how far a symbol is trading from its 3, 6, 9 or 12-month highs as a percentage
- Distance To Highs: charts the percentage move necessary for a symbol to reach new 3, 6, 9 or 12-month highs
- Distance From Lows: displays how far a symbol is trading from its 3, 6, 9 or 12-month lows as a percentage
- Distance To Lows: charts the percentage move necessary for a symbol to reach new 3, 6, 9 or 12-month lows
ACP
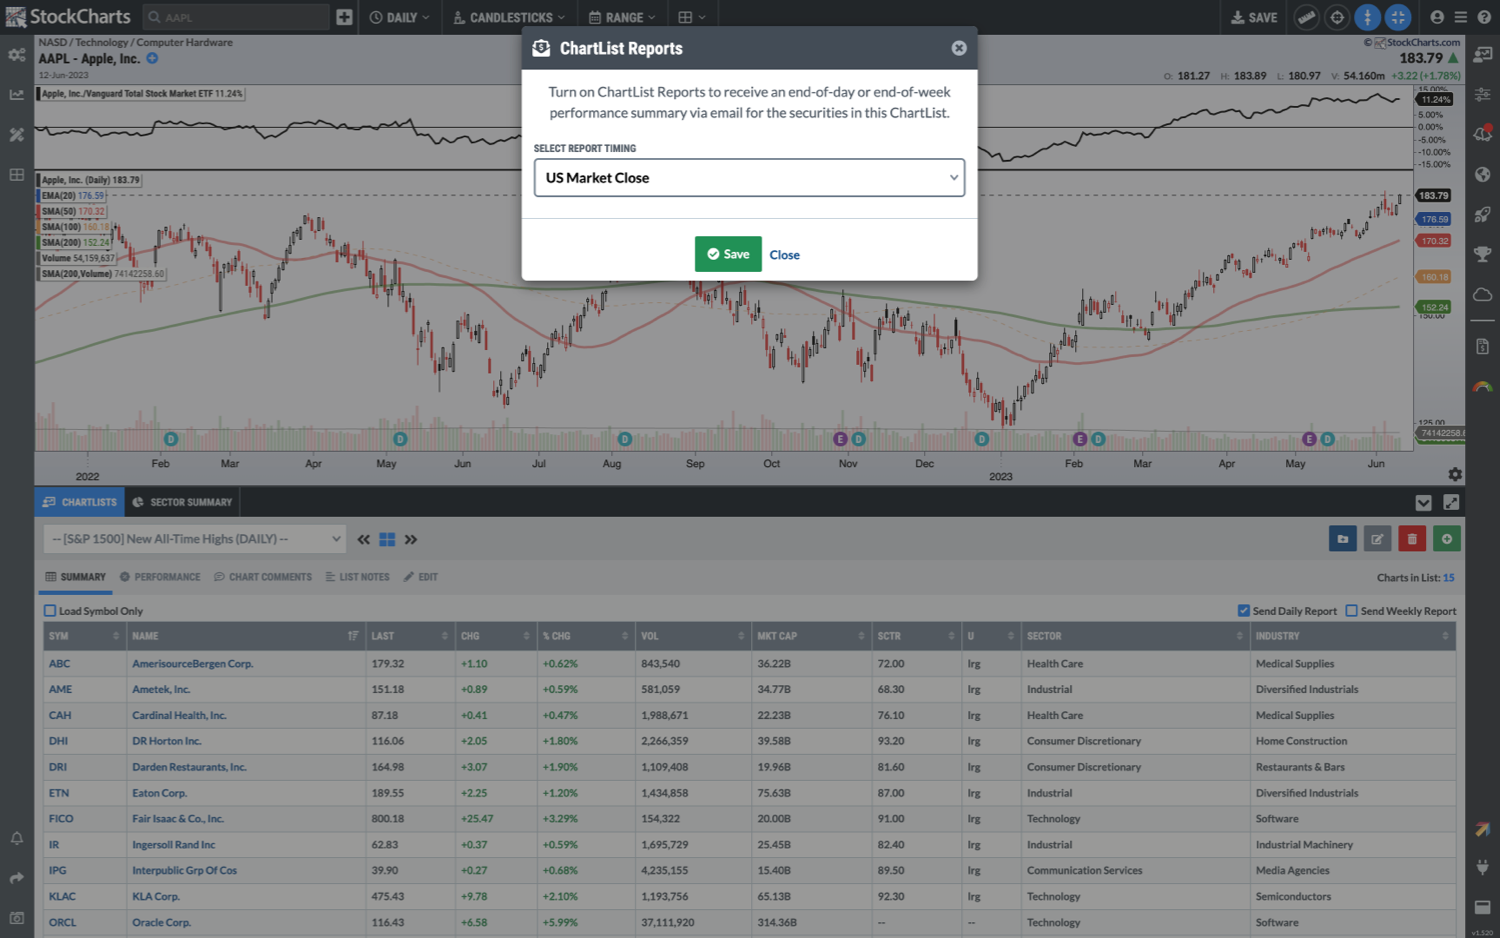
Daily & Weekly ChartList Reports Now Available For Your ACP Lists
To further enhance your ChartLists, one of ACP's most important features, we've added a powerful new tracking tool called "ChartList Reports".
With the simple click of a checkbox, you can now turn on daily or weekly ChartList Reports for any of your saved lists and we'll automatically email you a performance summary for all the stocks, funds, indexes or other securities saved in that ChartList after the market closes.
ACP
8 New Annotation Tools For ACP
The drawing capabilities in ACP have been expanded to include the following new annotation tools:
- Volume Profile
- Speed Resistance Arc
- Gann Fan
- Tirone Levels
- Crossline
- "Focus" Shape
- "Heart" Shape
- "Cross" Shape
EARNINGS CALENDAR
Helpful Group Filters For The Earnings Calendars
In addition to filtering over different time periods, you can now limit the Earnings Calendar to show only stocks from specific groups. See members of key indexes like the Dow, S&P 500 or NASDAQ 100, choose from different SCTR universes or focus on stocks in specific sectors like Technology, Financials or Health Care.
And Those Are Just The Biggest Ones...
Other new features and improvements you'll see around StockCharts include:
-
✅ More pre-built Sample Scans and Sample Charts
If you're looking for a great way to boost your StockCharts workflow, this is it! Our Sample Scan Library and Sample Chart Gallery let you browse extensive collections of pre-created scans and charts, ready to use right out of the gate or perfect as a starting place for you to customize and make your own. We've expanded both with more technical scans for common price highs and new charts like the Moving Average Ribbon, Intermarket Analysis, David Keller Market Trend Model and the ever-popular "Offense vs. Defense" chart.
-
✅ Run any of your custom scans as advanced technical alerts
No more need to copy and paste. On the Advanced Alert Workbench, you can now use the "Your Scans" menu in the Alert Components to select any custom scan from you account and use it as a technical alert. You can also do the same in reverse, running any of your custom alerts as scans by using the "Your Alerts" menu on the Advanced Scan Workbench.
-
✅ Quicker, easier access to your custom multi-chart layouts in ACP
A handy new menu at the top of ACP lets you quickly load any of your saved multi-chart layouts without having to open the sidebar on the left hand side of the platform.
-
✅ Enhanced permalinks give you more control when sharing your ACP charts
When sharing a link to a chart from ACP, you can now choose to share either the active chart or the entire layout if multiple charts are on the screen.
-
✅ More display style options for dozens of indicators, including Area and Histogram
You have more control over the look of your ACP charts than ever before with new style options for line type and thickness.
-
✅ Sector and industry data now included in "Slim Quote" header for your ACP charts
Even when viewing the "slim" header type in ACP, you'll now see sector and industry group classifications for the stocks you're charting.
-
✅ Historical price data now accessible in the ACP right-click menu
Looking to the past? Simply right click on your charts to access a link directly to the historical data for that symbol - all the way back to 1900 when relevant!
-
✅ Easier access to chart comments for your saved charts in ACP
When viewing a saved chart in ACP, you can now conveniently launch and edit your chart comments right from the top navigation bar. Look for the "comments" icon next to the save button at the top of the platform.
-
✅ New option to extend vertical line annotations across all chart panels in ACP
When using the vertical line tool in ACP, you now have the option to extend the line across all panels on the screen.
-
✅ Track and save changes to your ACP charts with improved messaging as you go
Helpful messaging and coloring throughout ACP now make it more clear when you've got unsaved changes to the charts in your account.
-
🐛 Bug fixes and stability enhancements
...and plenty of other behind-the-scenes improvements around the site.