What's New
WINTER PRODUCT RELEASE | FEBRUARY 2024
The new year is off to a HUGE start here at StockCharts with a monster collection of dynamic new tools and features that just rolled out around the site as part of our latest sitewide product release - one of our BIGGEST and most important releases EVER! We've put together some highlights below to help you learn more about all that's included in our recent update.
SHARPCHARTS
NEW SharpCharts Workbench: The Next Evolution Of Our Classic Charting Platform
SharpCharts users rejoice! The next generation of our SharpCharts charting platform has arrived.
The all-new, totally re-imagined layout brings you features like quick access to your chart settings right at the top of the page, dynamic controls for chart resizing, and easy access to your saved charts. Most excitingly, the new workbench includes some of our most important trading tools built right into the page. Below your charts you'll find access to your ChartLists, your ChartStyles, dozens of sample charts, historical price data and even options data for the symbols you're charting. Plus, you'll soon see more features like the full Symbol Summary tool, Seasonality charts and much more.
MARKETCARPET
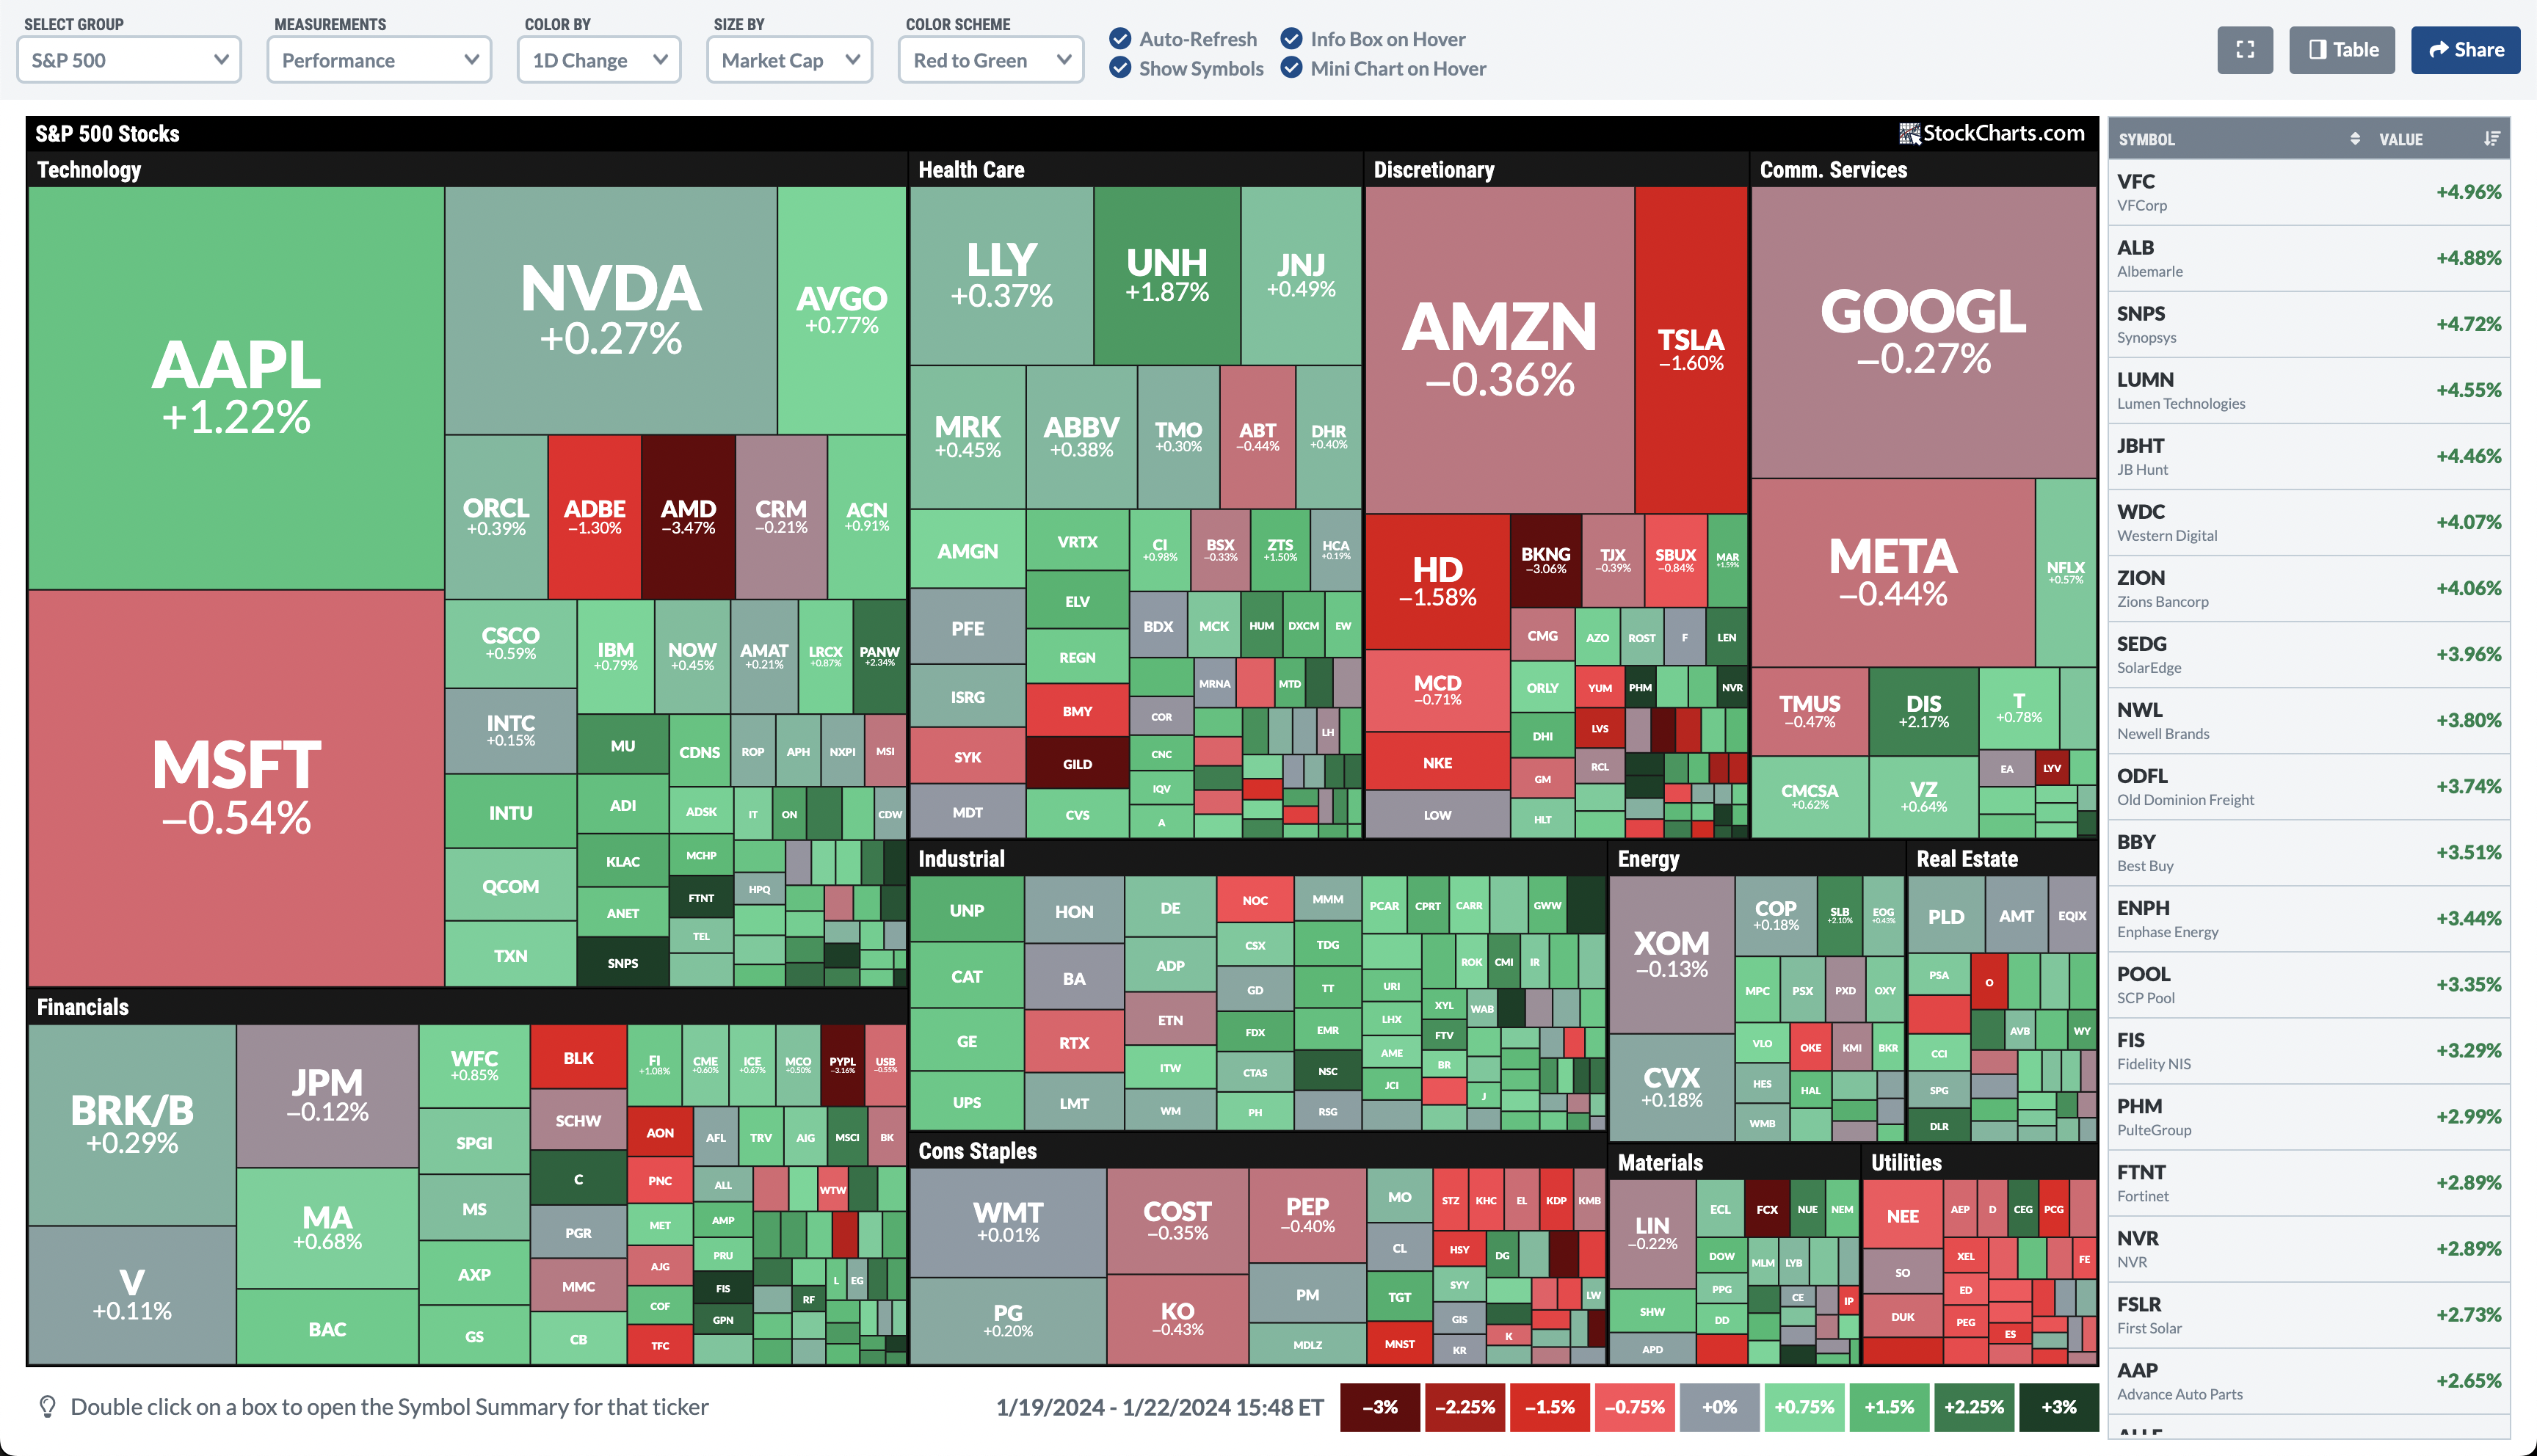
Entirely Redesigned MarketCarpet Heat Maps With New Visuals And Enhanced Interactivity
Our popular market heat map tool just got a major overhaul.
MarketCarpets let you visually scan large groups of securities for actionable, emerging trends and technical developments. With a totally new look, more interactivity and tons of new data options, the new MarketCarpet tool will take your top-down analysis to the next level.
MARKET DATA
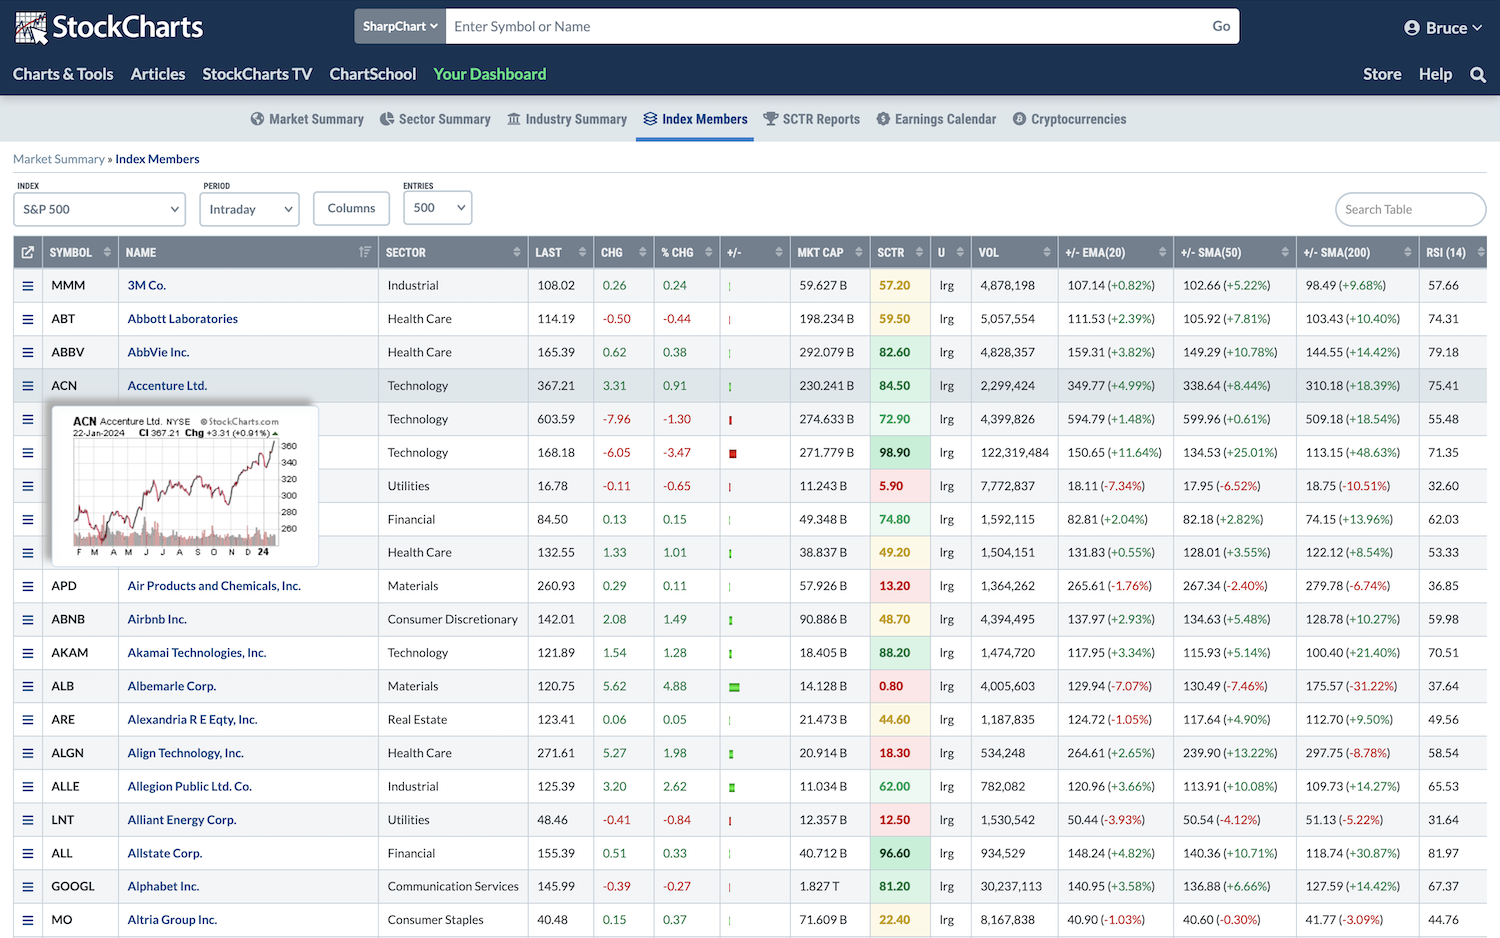
New Index Members Summary Page Lets You Research Stocks In Key Indexes
Looking for the largest stocks in the S&P 500 or the top performers in the Dow? Or perhaps you want to see the strongest stocks with the highest SCTR scores in the Financial sector. Well, our new Index Members summary page is the tool for you.
Select from any of the major US indexes or sectors to quickly see a complete summary of all stocks within. Sort by the criteria of your choice and click on any symbol to see a full SharpChart for that security.
SCANS
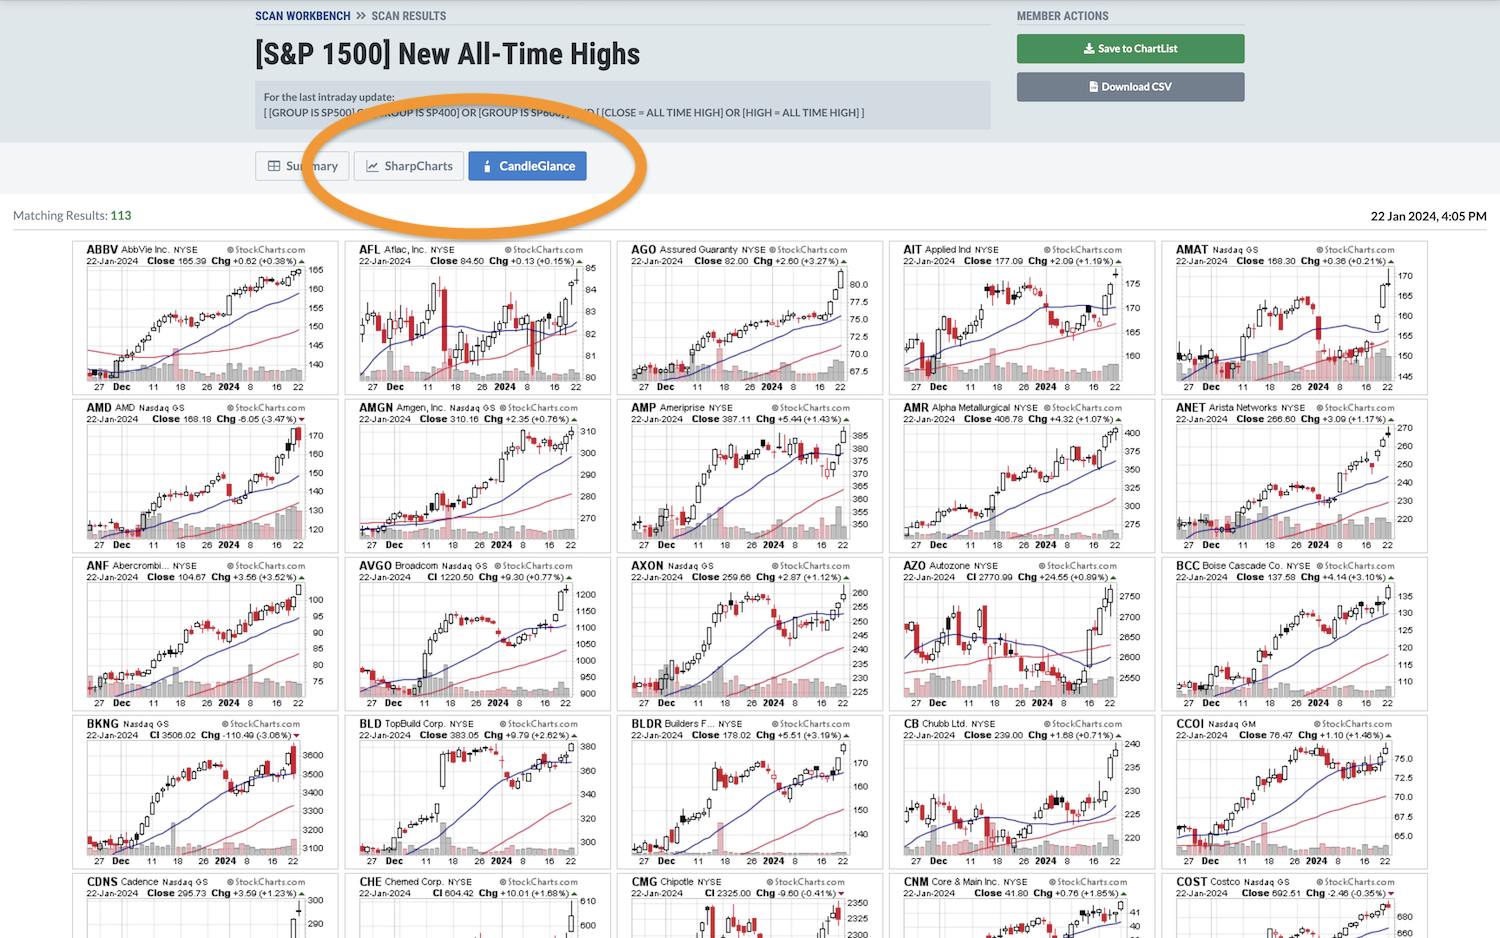
Enhanced Scan Results Now Include Full-Sized SharpCharts And CandleGlance Views
Reviewing your scans just got a powerful visual upgrade with new charting views built right in.
You'll now find two new chart view tabs at the top of the results page anytime you run a scan. See full-sized SharpCharts for every security that meets your criteria, or browse mini-charts for the entire group with the CandleGlance view.
SCANS + ALERTS
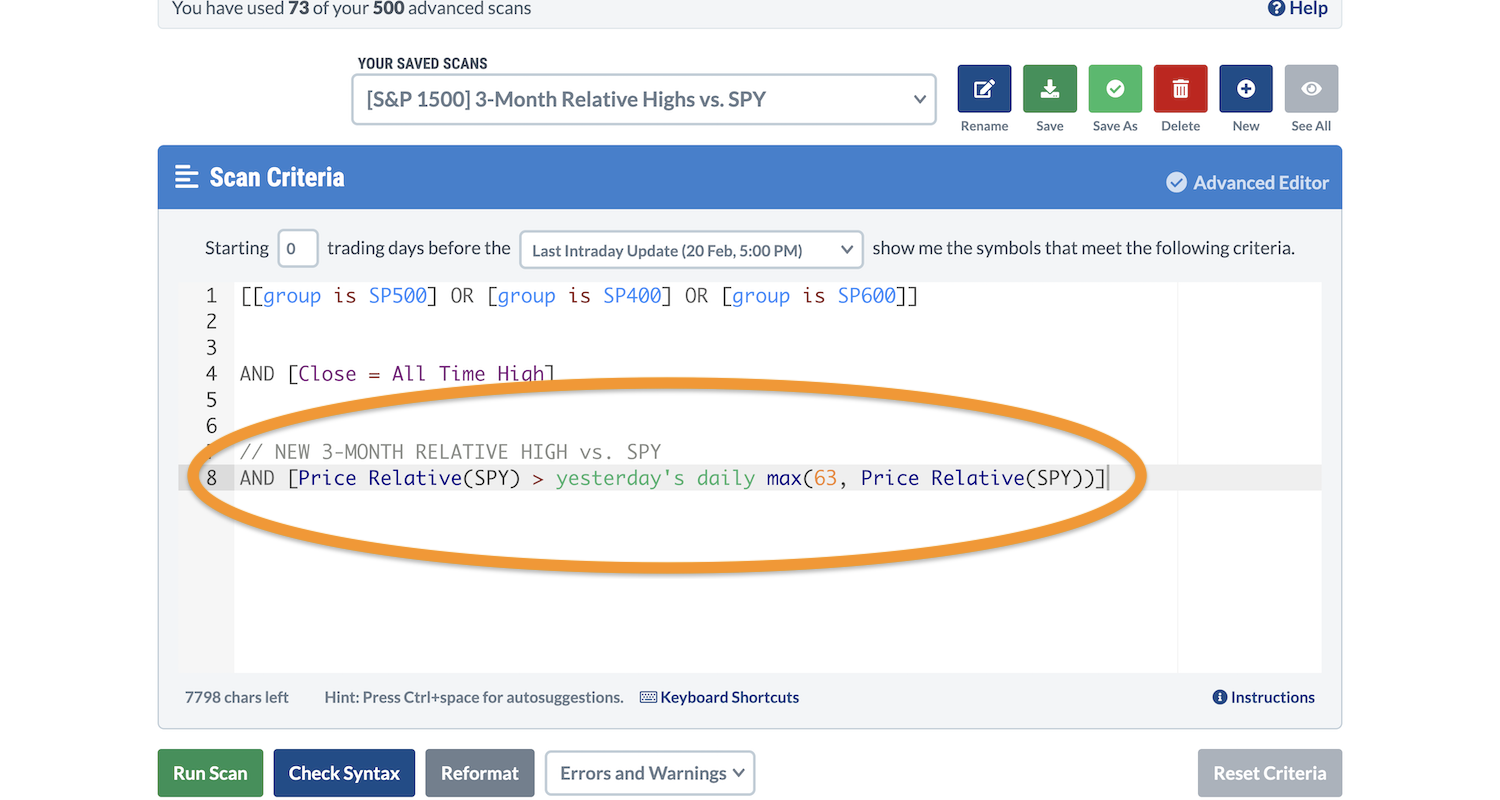
Scan For Relative Strength Against Any Benchmark Symbol You Want
The new addition of the "Price Relative" indicator makes it easier than ever before to find the strongest stocks that are outperforming the market.
Bring relative strength into your scans or alerts to find stocks, ETFs and other securities that are outperforming - or underperforming - any benchmark symbol you choose. Want to see stocks in the S&P 500 that are outperforming SPY? This new enhancement to our scan engine will make it happen.
SCANS + ALERTS
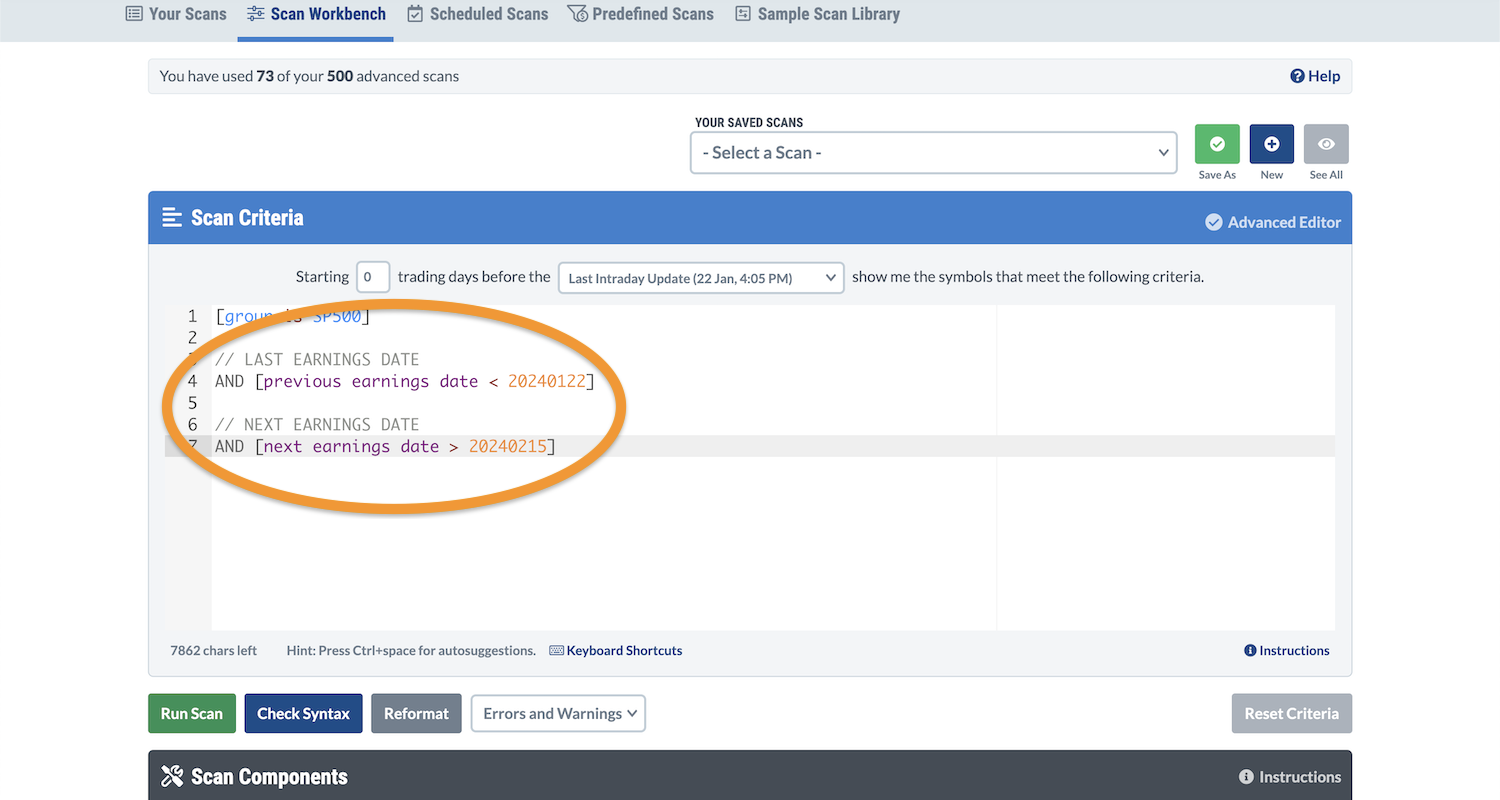
Scans and Alerts For Earnings Dates
Earnings drive the markets, so it's only right that they find a place in your scans and alerts. You can now include earnings dates in your scans and alerts to find stocks that have reported or have an upcoming announcement on a specific date. Pair it with your other technical and fundamental criteria to stay focused only on the symbols that meet your unique trading requirements.
ACP
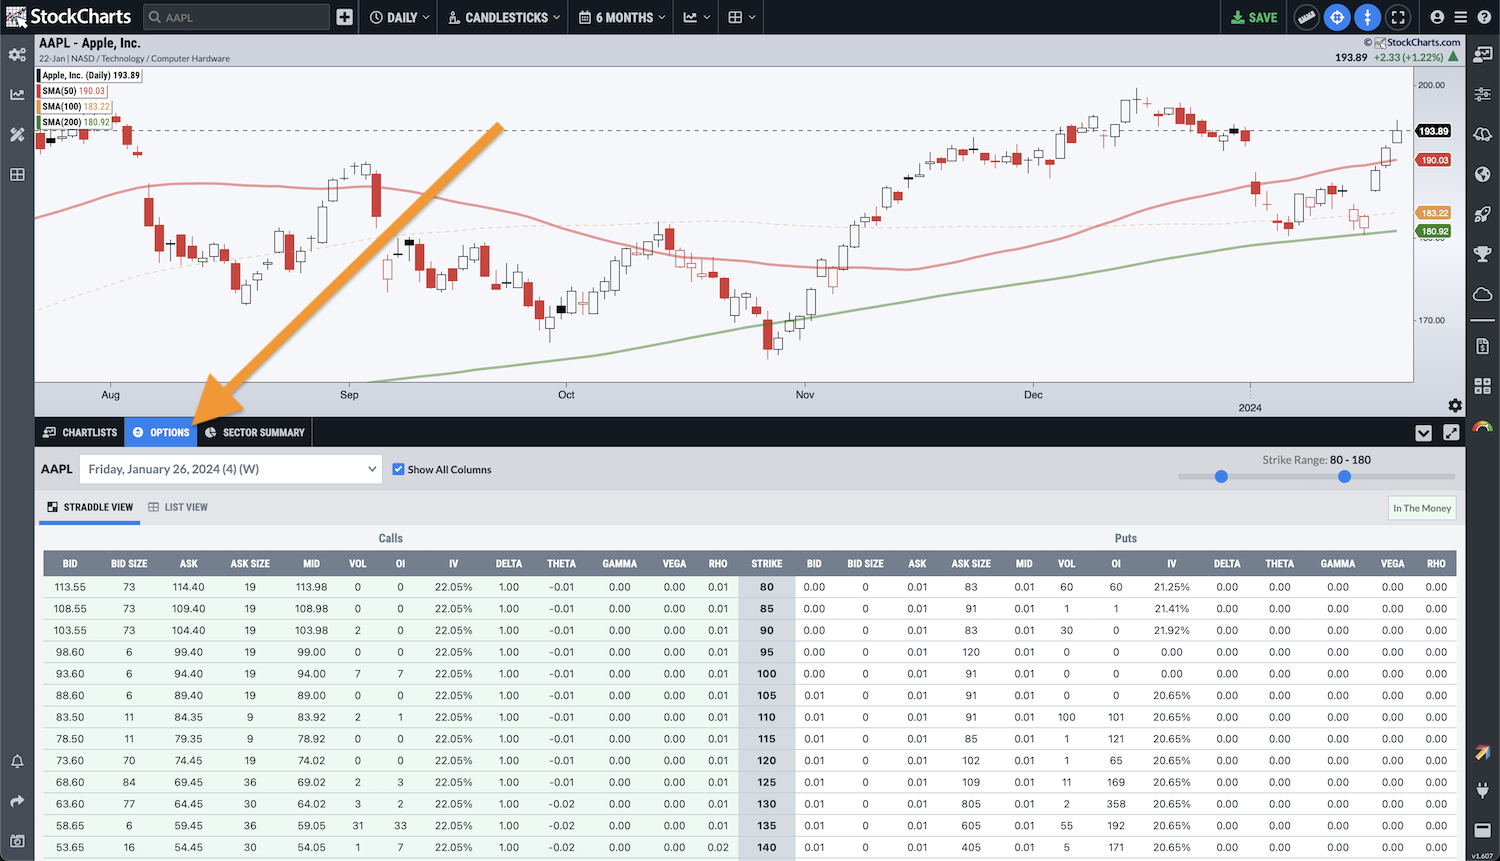
See Detailed Options Quotes With The Complete Chain Table Right Below Your Charts
Trading options? Well, you can now access real-time put and call data right alongside your charts in ACP.
The options tab at the bottom of ACP brings you detailed options quotes for calls and puts on any security we cover. See call and put contracts separately with the "List View", or flip over to the "Straddle View" to pinpoint the perfect options strategy with the complete chain table with full Greeks coverage for delta, theta, gamma, vega and rho values The "strike range" slider also gives you complete control over the options quotes you see.
ACP
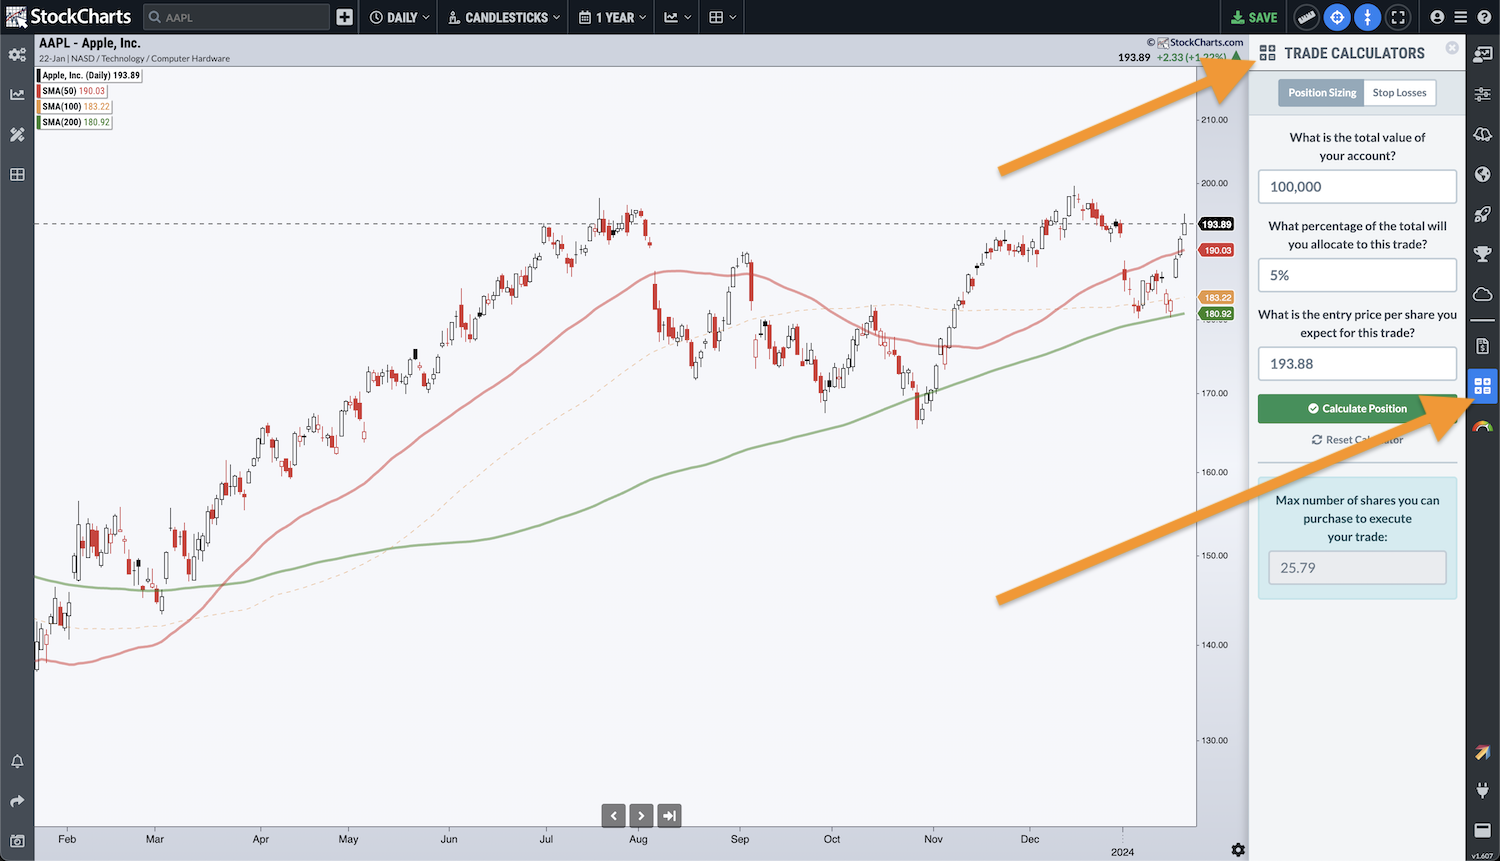
Easy-To-Use Trade Calculators Help You Enter New Positions And Set Stops With Ease
You've have enough to think about when it comes to your investing, so we've added two helpful position calculators to steamline the trading process.
The Position Sizing calculator will help you determine the number of shares to buy or sell based on your risk tolerance and the size of your portfolio. The Stop Losses calculator will help you determine the ideal stop loss price for any of your positions based on your cost basis and percentage loss.
DASHBOARD
Three New Panel Views Bring New Market Insights To Your Dashboard
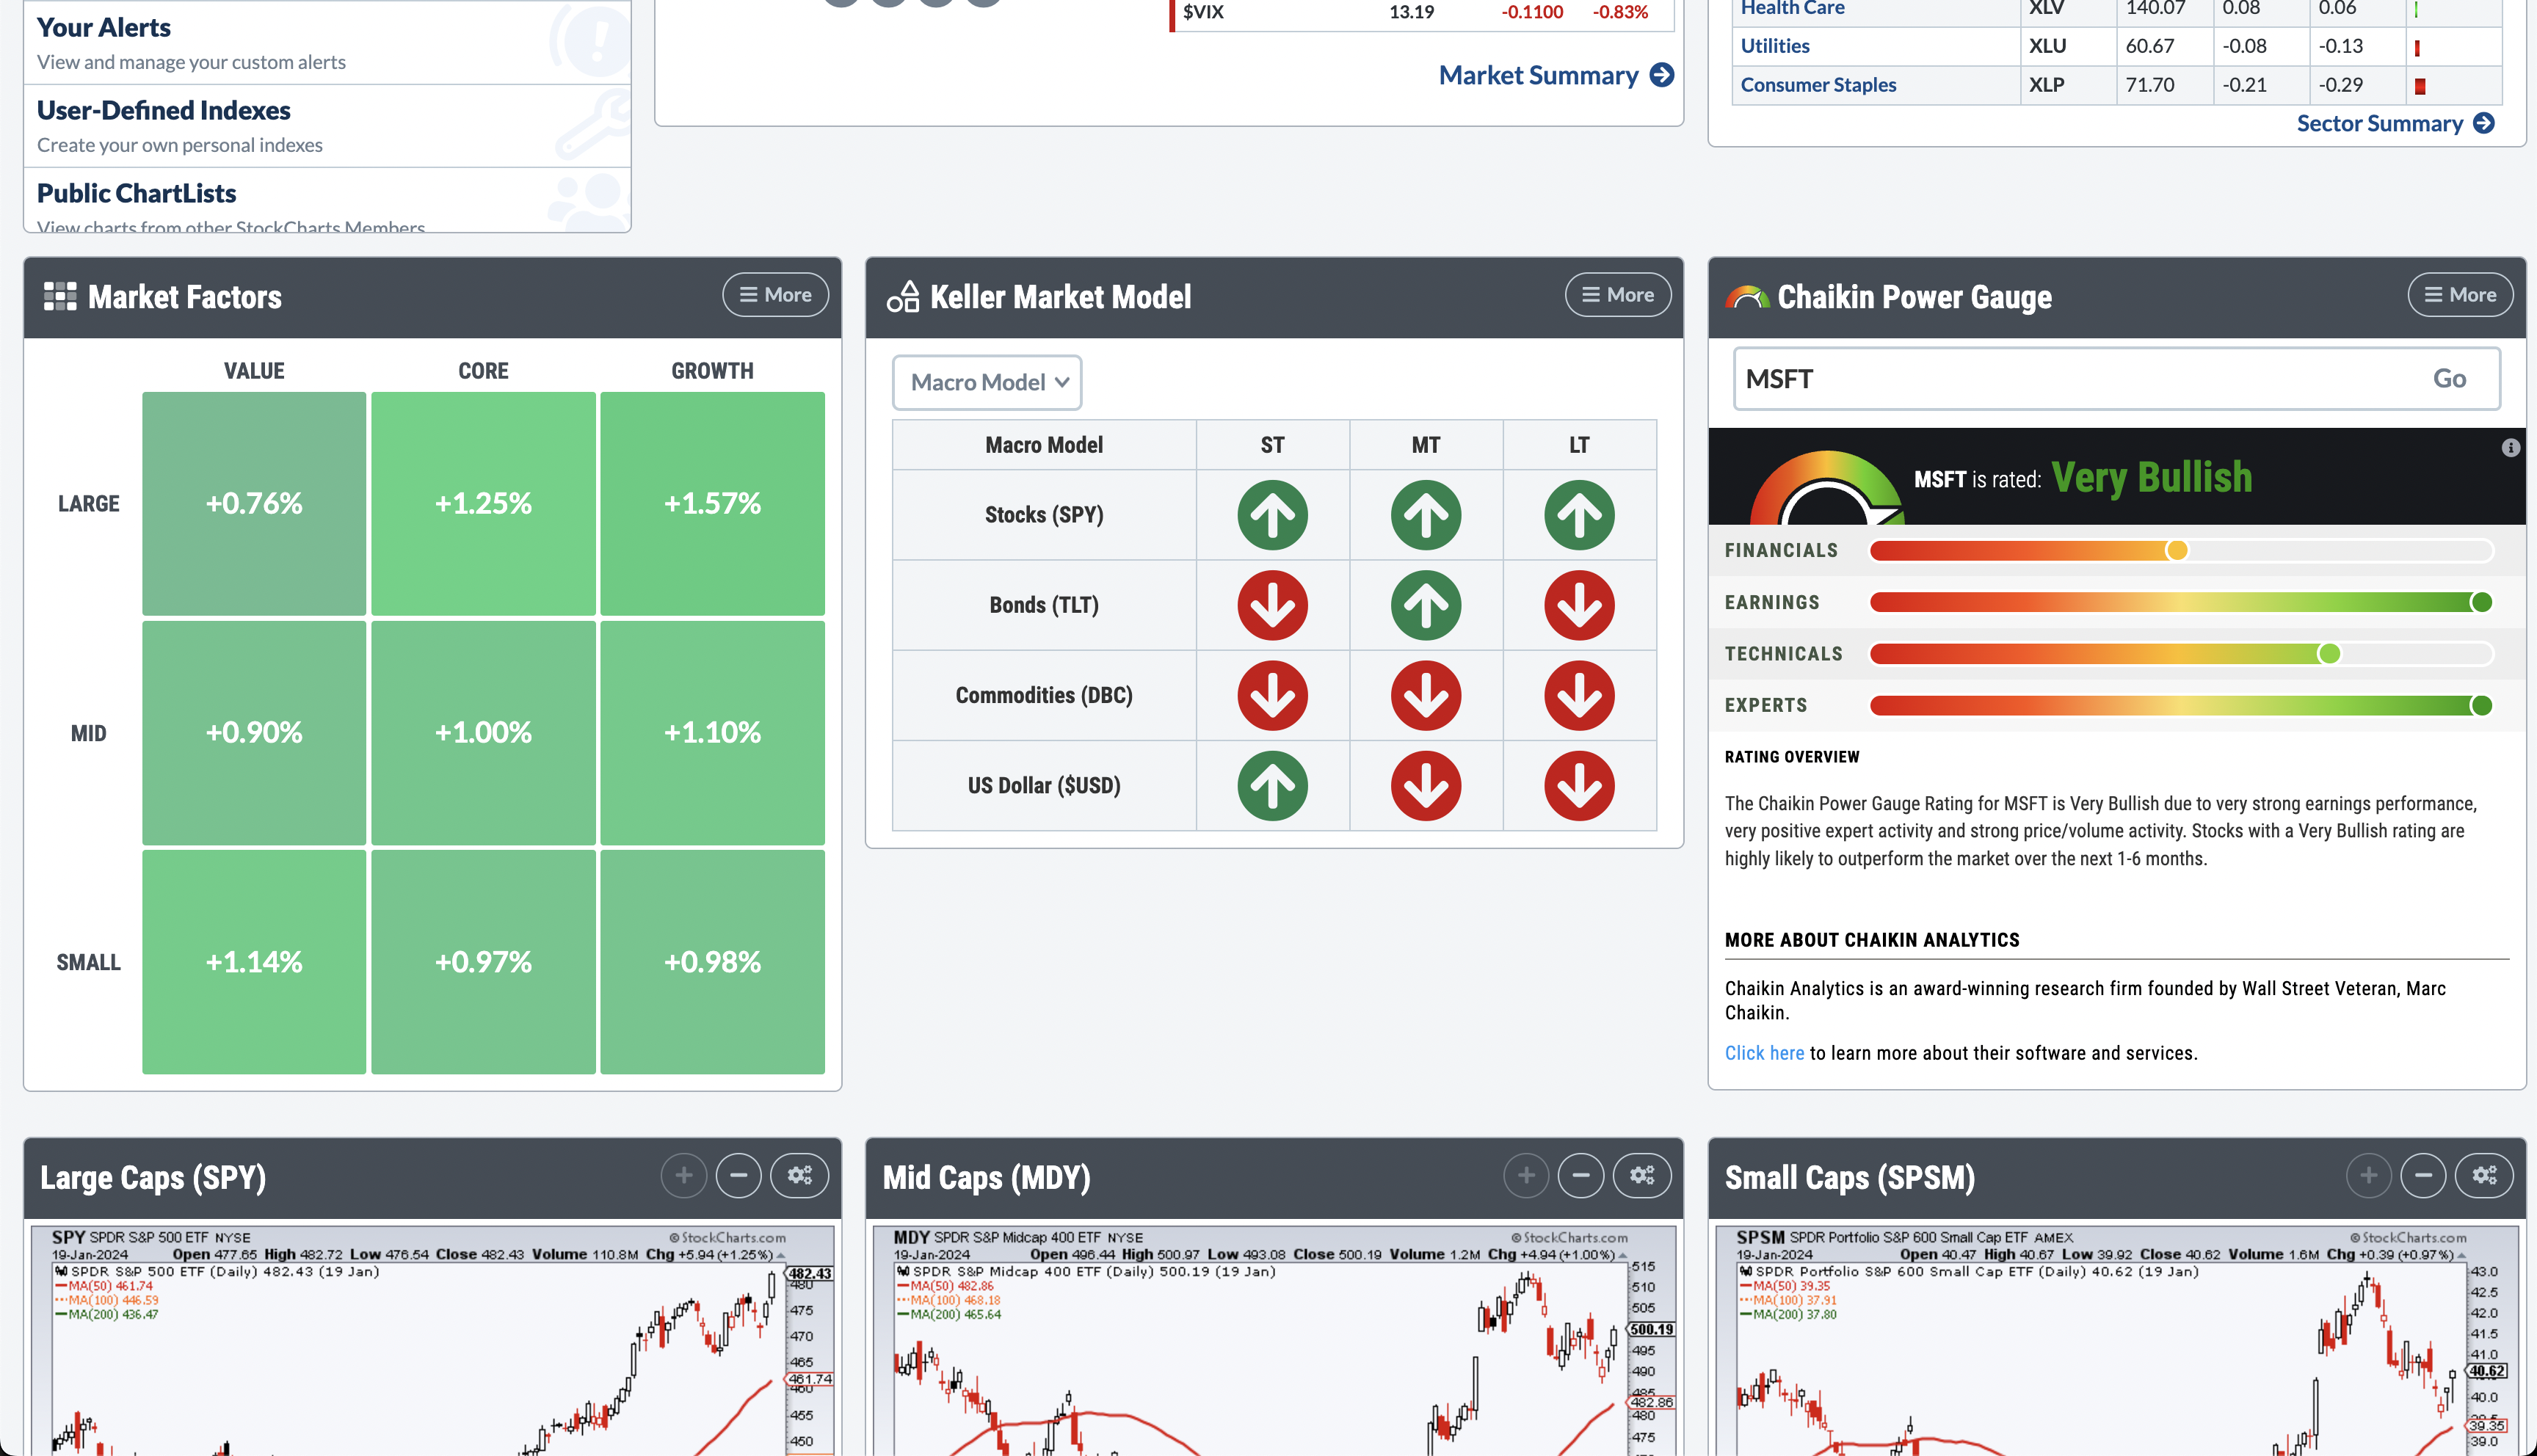
We've brought new data and market visuals right to Your Dashboard:
- Market Factors: A grid of nine S&P indexes colored by performance to let you compare core vs. growth vs. value "factors" across market cap levels.
- Keller Market Trend Model: David Keller's multi-timeframe trend analysis system displays the short, medium and long-term trends for a collection of key stock indexes and macro asset classes.
- Chaikin Power Gauge: a 20-factor model designed by Marc Chaikin that combines financial data (like return on equity and free cash flow) with earnings information, expert opinions, and technicals into one easy-to-understand rating from Very Bullish to Very Bearish. Learn More
And Those Are Just The Biggest Ones...
Other new features and improvements you'll see around StockCharts include:
-
✅ 4 new technical indicators now available in ACP
Compare any security to the benchmark of your choosing with the new Price Relative indicator, and explore three other new additions: MACD-V, MACD-V Histogram and the Gopalakrishnan Range Index.
-
✅ Earnings Dates in Full Quote for SharpCharts
Turn on the "Full Quote" option under Chart Attributes to see next and last earnings dates for any stock you're following, right the top of the chart.
-
✅ New pre-built charts added to our Sample Chart Gallery let you see the markets from a new perspective
Let StockCharts do the work for you with a new collection of expertly-designed, pre-built charts that you can start using in a single click. New charts added to the gallery include a Larry Williams template, indicator-specific views like RSI, ROC and Bollinger Bands, and a collection of powerful bredth charts for key indexes.
If you're looking for a great way to boost your StockCharts workflow, this is it! Our Sample Chart Gallery let you browse extensive collections of pre-created charts, ready to use right out of the gate or perfect as a starting place for you to customize and make your own. -
✅ Run advanced market screens in just one click with new pre-built advanced scans added to our Sample Scan Library
New scans added to the library include Mark Minervini's classic "Trend Template", new highs and new lows across a variety of timeframes, and predefined groups like the S&P 500 stocks, market cap and equal-weight S&P sector ETFs and much more.
If you're looking for a great way to get started with scanning, our Sample Scan Library is the answer. It lets you browse extensive collections of pre-written scans, ready to run as-is or perfect as a starting place for you to customize and expand with your own criteria. -
✅ Easy, connected navigation to all of the summary pages you need to dig deeper into the markets
You'll now find tabs across the top of all of our summary pages, making it easy to jump from one tool to another. For example, if you're looking at the Sector Summary, you can now click the "Index Summary" tab to navigate there with ease.
-
✅ Review your latest technical alerts or other key reminders with a new Notifications link in the dropdown menu at the top of any page
Click your name in the top right corner of any StockCharts page to open the navigation menu, and you'll now find a Notifications link built right in. Click it to see your latest technical alerts, reminders and other important notifications.
-
🐛 Bug fixes and stability enhancements
...and plenty of other behind-the-scenes improvements around the site.