Living out in Alberta, I am in the home of ranch country which marks territory for the bulls. To the West is Banff National Park, Waterton National Park and Jasper National Park. All of these parks are home to grizzly bears and black bears. Most days it feels just like the market. Bullish views in one direction and bearish views in another direction. Currently, everyone can find arguments to support their position.
Lets review the first work of intermarket analysis.
Lets talk about the DOW
The DOW doesn't have Apple in it.
The Railroads used to be the comparison. Now we use air, truck, rail, ship to move goods.
Let me cover these off.
So if everything is working in sync, the transports should be improving along with the industrials.
Lets digress for a moment because the Apple is not in the Dow. If Apple was in the Dow, would the index have passed it's recent high? I don't know. Depends what you take out. I do know that the $SPX hasn't made new highs yet and the transports still aren't confirming. From one of the news pages I read, Apple doubled the profits of the SP500 ($SPX) this quarter. Without Apple it was 1.6%, with Apple it was 3.6%. I might have the digits after the decimal place wrong, but Apple doubled the total profits of the other 499 companies. Even with this, the $SPX has not made new highs. The $NDX 100 has, but the $COMPQ is trying to break through right now at the same time as the $SPX.
When the transports do not confirm new highs this creates consternation and needs consideration. Many people disregard the Dow Theory and you may choose to write it off. I just agree that it makes too much common sense and we should always be aware of the simplest tenets of this theory. The transports now include rails, air, trucking which makes this a modification from the original Dow theory which just used the railroads. There could be shipping as well, but the $BDI is on the low end of the chart after falling 30 days in a row. John Murphy recently did a great article so I won't bother with the $BDI.
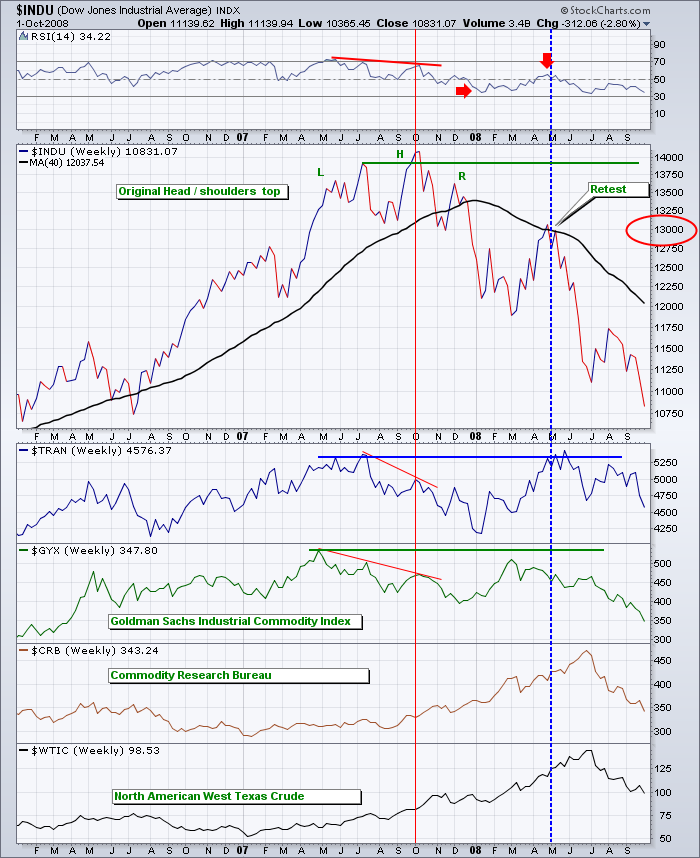
First lets review the 2007 top.
When the Dow retested the previous highs of July 2007, 4 months had passed.
You can see on the July 2007 high:
The $INDU was trying to make new highs.
The transports were trying to make new highs.
The Industrial metals were making a lower high.
By October,
The $INDU was trying to make new highs.
The $TRAN (the transports) lagged.
The $GYX (The Industrial metals) lagged again.
So it was a clue to be cautious right at that point.
Oil made up 39% of the revised CRB (Revised 2005.) Oil raged on which covered the $CRB and hid crucial data for those not looking deeper. USING THE $CRB WOULD NOT HAVE TOLD YOU WHAT WAS GOING ON.
Once the 40 week moving average had rolled over and starting going lower, The Dow Restested the 200 dma in the spring of 2008 at the blue vertical line. It was a fail. Interestingly enough, at the same time, the Transports retested the October 2007 highs just as the $INDU tested the 200 DMA. Needless to say, both failed from there. The $GYX never got up to retest.
Now let's look at the current chart.
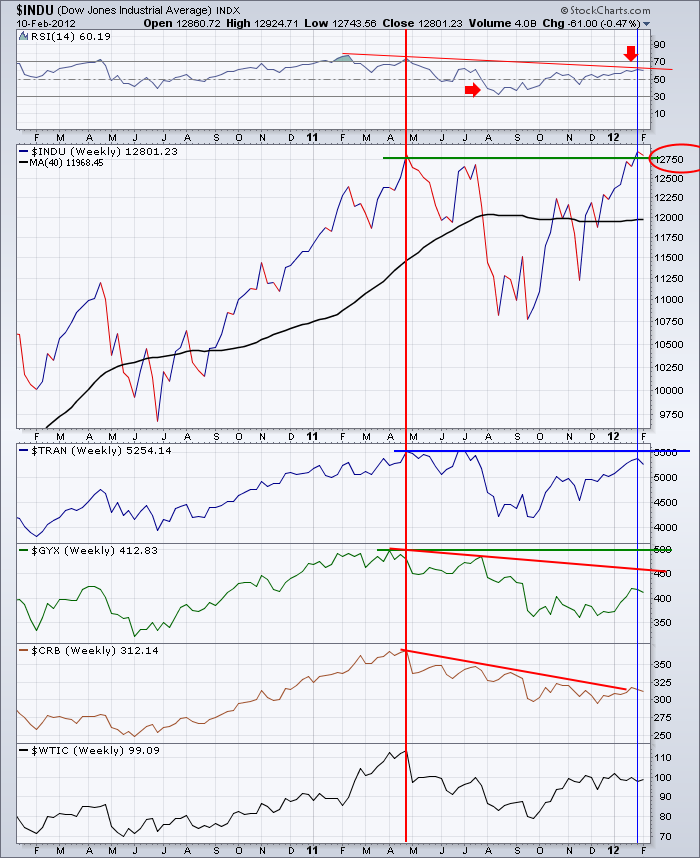
So Let's review where things were at in April 2011.
The $INDU was making a new high.
The $TRAN was making a new high
The $GYX had made a new high recently but had pulled back by the time the red line marking the $INDU high was drawn. Immediately after it pulled back quickly.
Let's look what happened at the right shoulder in July 2011.
The $INDU was not testing the previous high and was unable to break through.It rolled over.
The $TRAN made a new high in June but pulled back by July 18th.
THe $GYX made a lower high and this appeared to be a right shoulder on a head/shoulders top.
The $CRB was masked by crude oil and was steadily making lower lows as oil was.
In this case, the Industrials did not confirm the transports euphoria.
Lets fast forward to now.
The $INDU are testing previous highs. It currently has broken through and pulled back under the highs.
The $TRAN is not confirming the new sentiment.
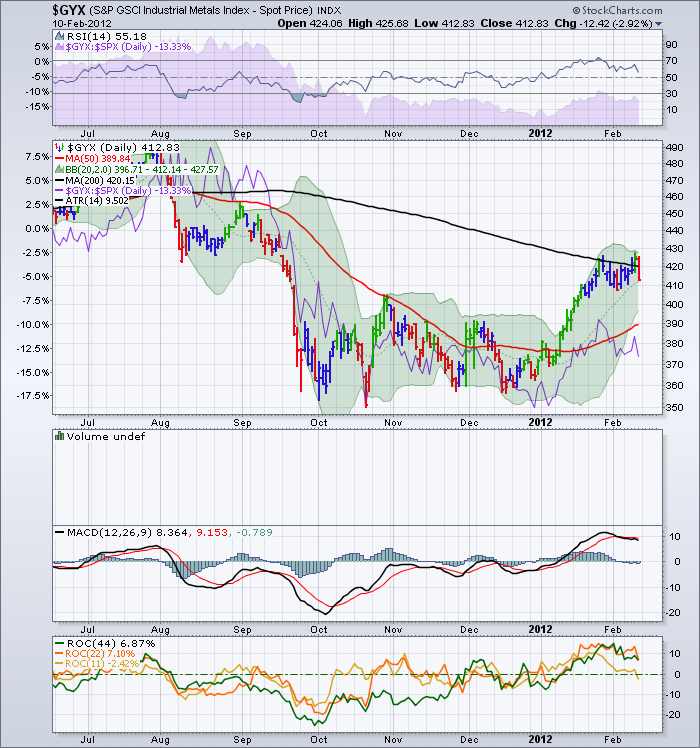
The $GYX is definitely not confirming the new sentiment.
Crude is still muting the effects of the $CRB for this purpose. Crude moved higher and then went sideways for 3 months now. The $CRB looks like a blend of the $GYX and $WTIC. As it should.
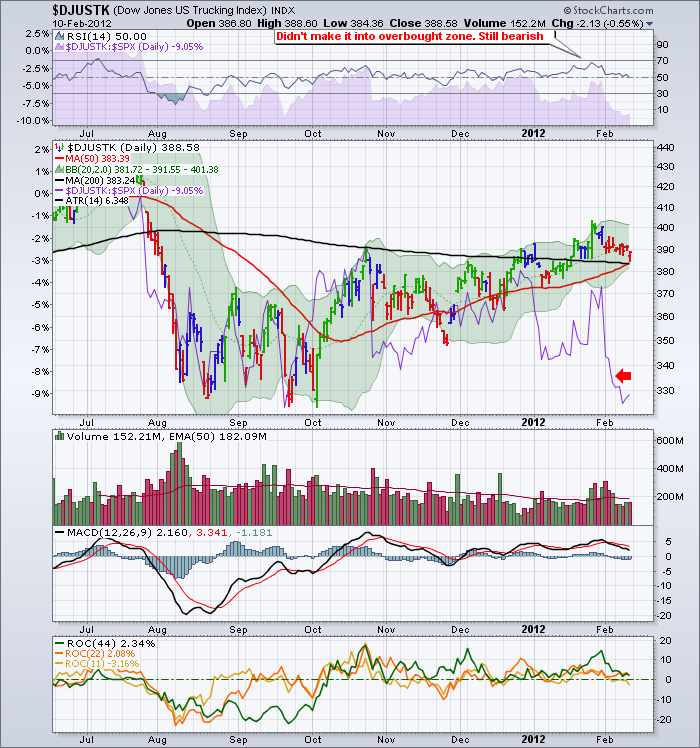
This makes me very cautious. Look at the railway and trucking charts. Below is the trucking chart. $DJUSTK.
You can see it is sitting on the 200 dma on this daily chart. It need upward momentum and it has been declining for 2 weeks while the industrial averages were making higher highs.
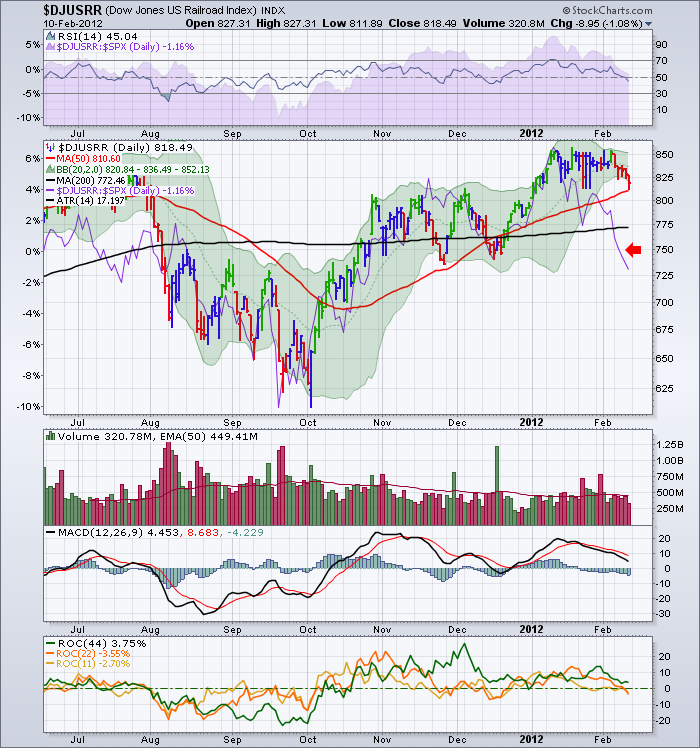
Here is the $DJUSRR. This is the railroad index.
The railroads have been declining for 2 weeks, and unable to make new highs for almost a month. More critically, the SPURS line, the purple relative strength line is diving on both charts. This means Hedge funds will start noticing the underperformance.
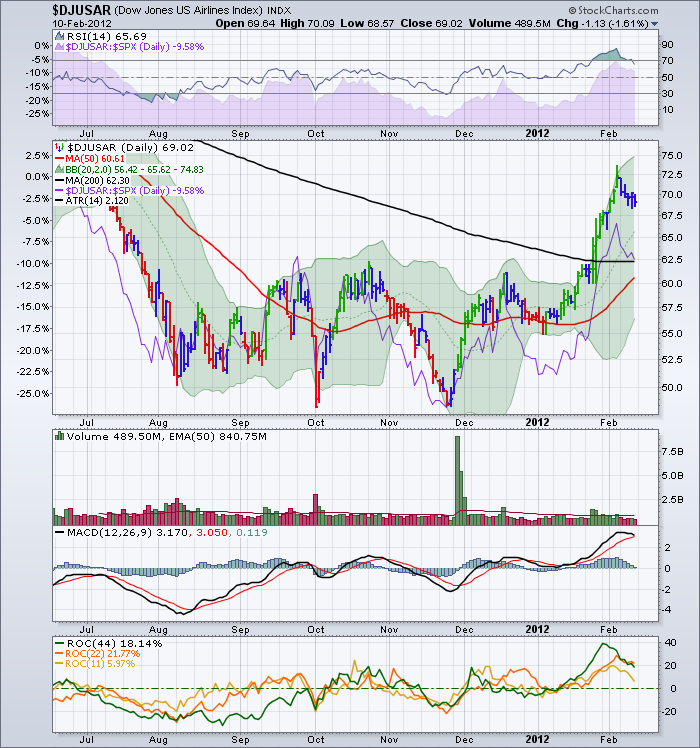
Here are the airlines...which I think are less relevant to Dow Theory, but still important. $DJUSAR.

