 The NDX scored a PMO BUY signal, lagging slightly behind the other three Scoreboard indexes. Below the Scoreboards, I have included not only the NDX but also the other three Scoreboard indexes (SPX, OEX and INDU), as "solid line" charts rather than OHLC bars. I was curious to see if cleaning up the charts to line charts would make a chart pattern visible. As it turns out, I did find bullish chart patterns on all four indexes when I just looked at closing prices.
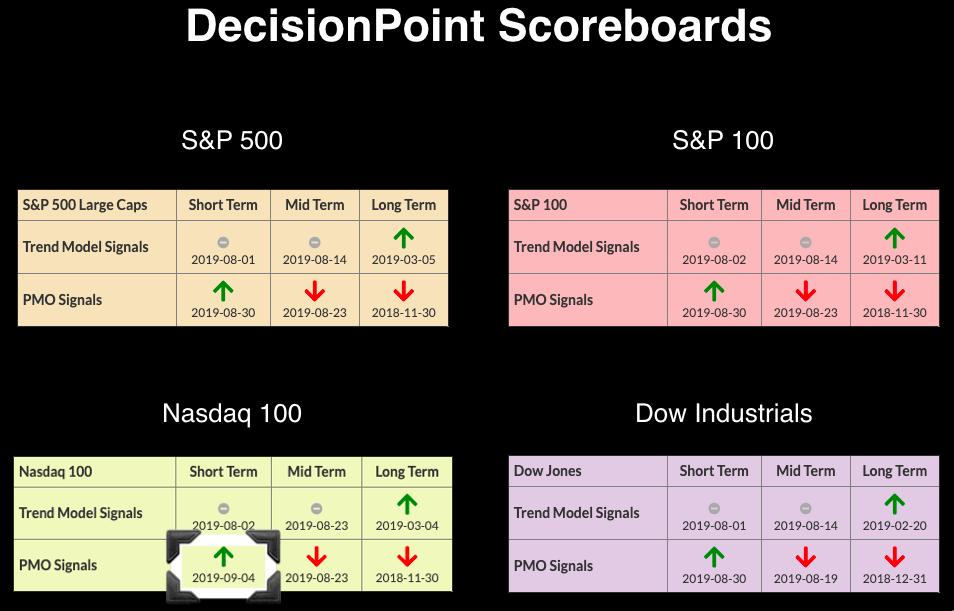
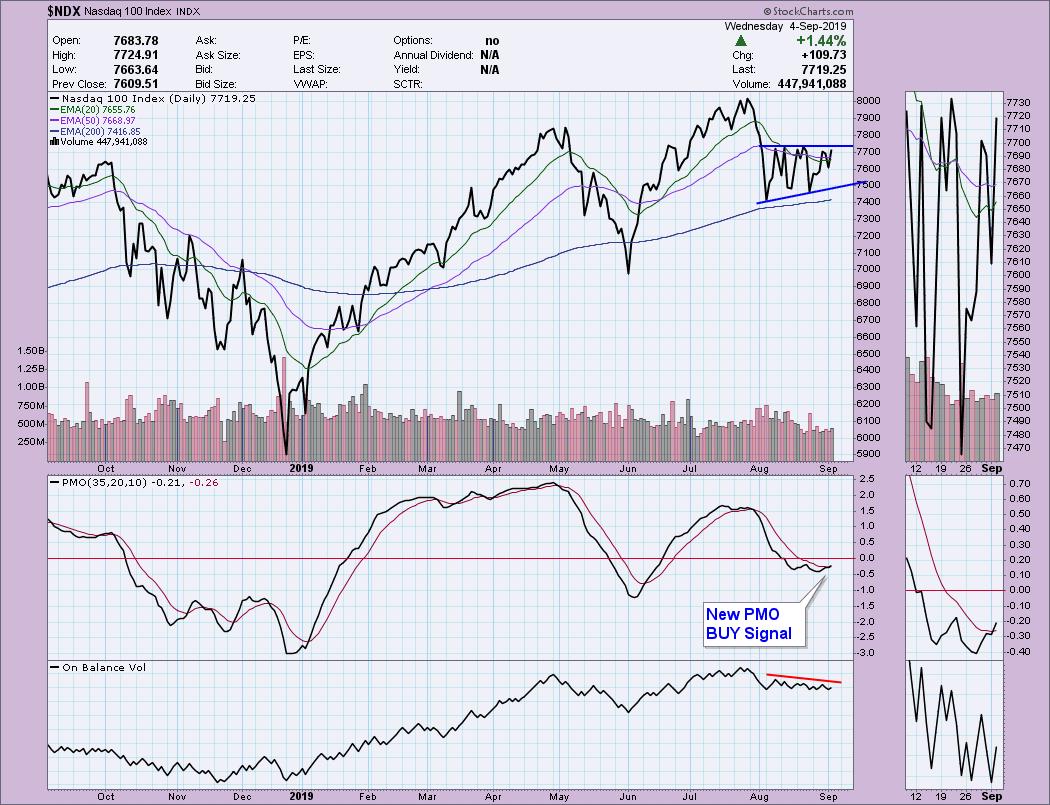
The NDX has a possible ascending triangle formation (it isn't technically a pattern until it executes). The expectation of this pattern is an upside breakout. I've also annotated the new PMO BUY Signal; not liking the OBV declining tops that show a negative divergence with price tops.
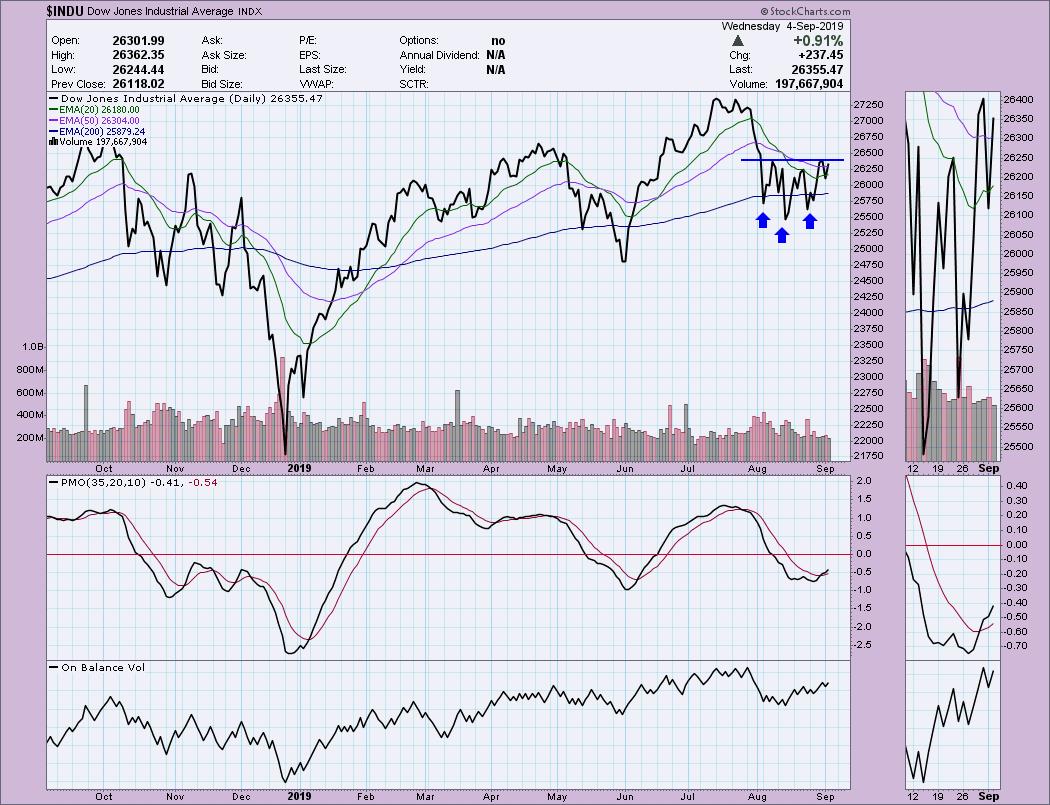
The Dow appears to have formed a reverse head-and-shoulders. The expectation is for a breakout to the upside above the neckline. The minimum upside target would definitely put price at the all-time highs.
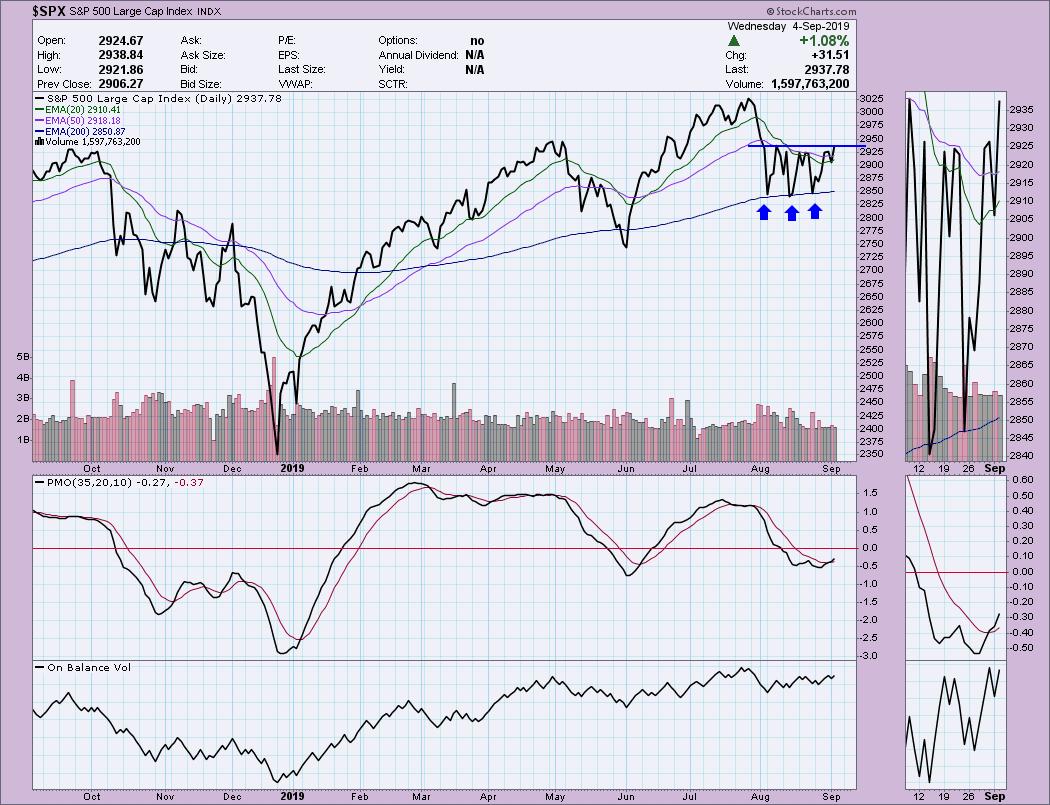
The SPX has a clear triple bottom formation. It hasn't executed, but the expectation is resolution to the upside.
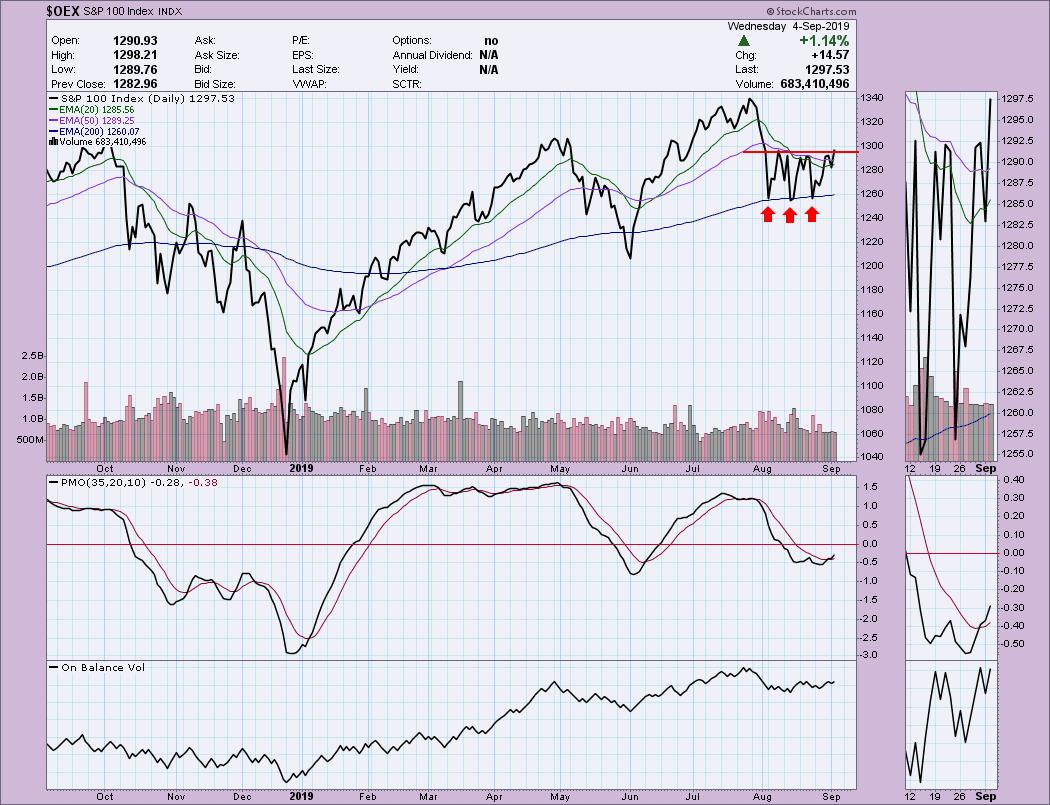
You can also see a triple bottom on the OEX.
The DecisionPoint Alert presents a mid-week assessment of the trend and condition of the stock market (S&P 500), the U.S. Dollar, Gold, Crude Oil and Bonds.
Watch the latest episode of DecisionPoint on StockCharts TV's YouTube channel here!
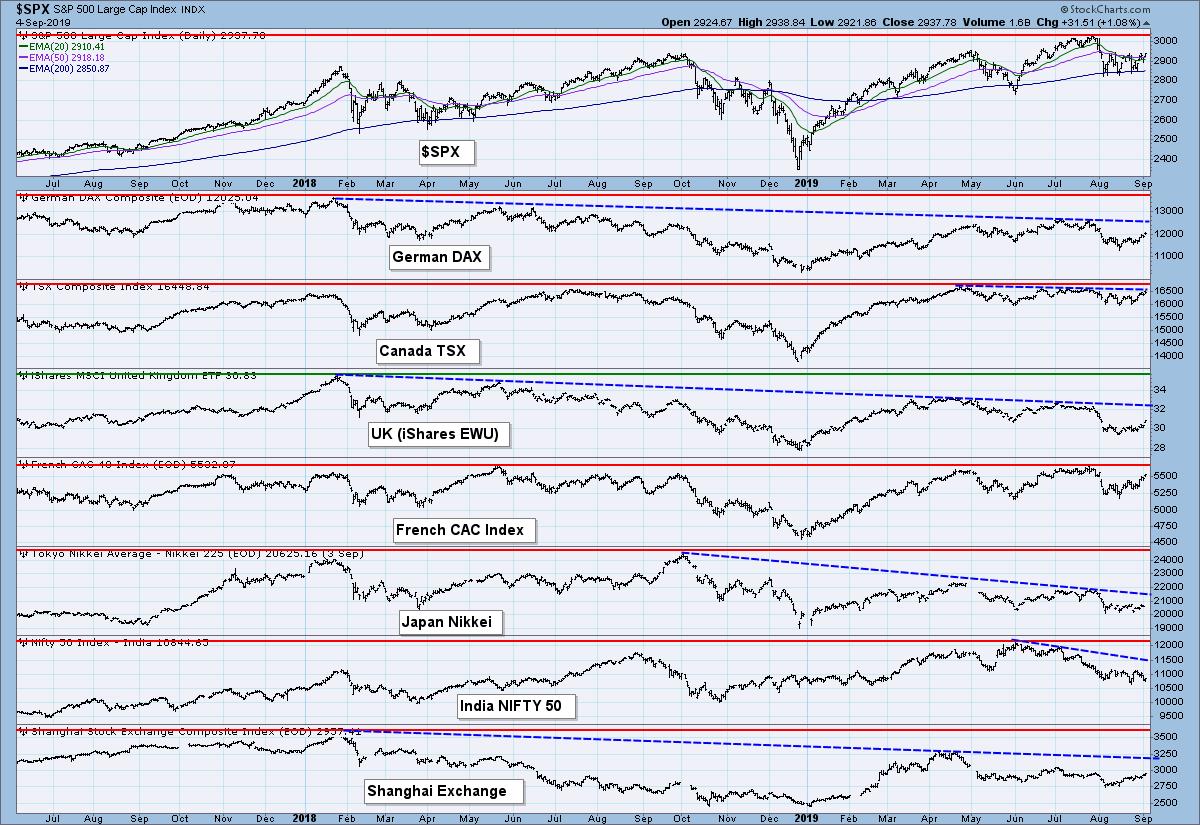
GLOBAL MARKETS
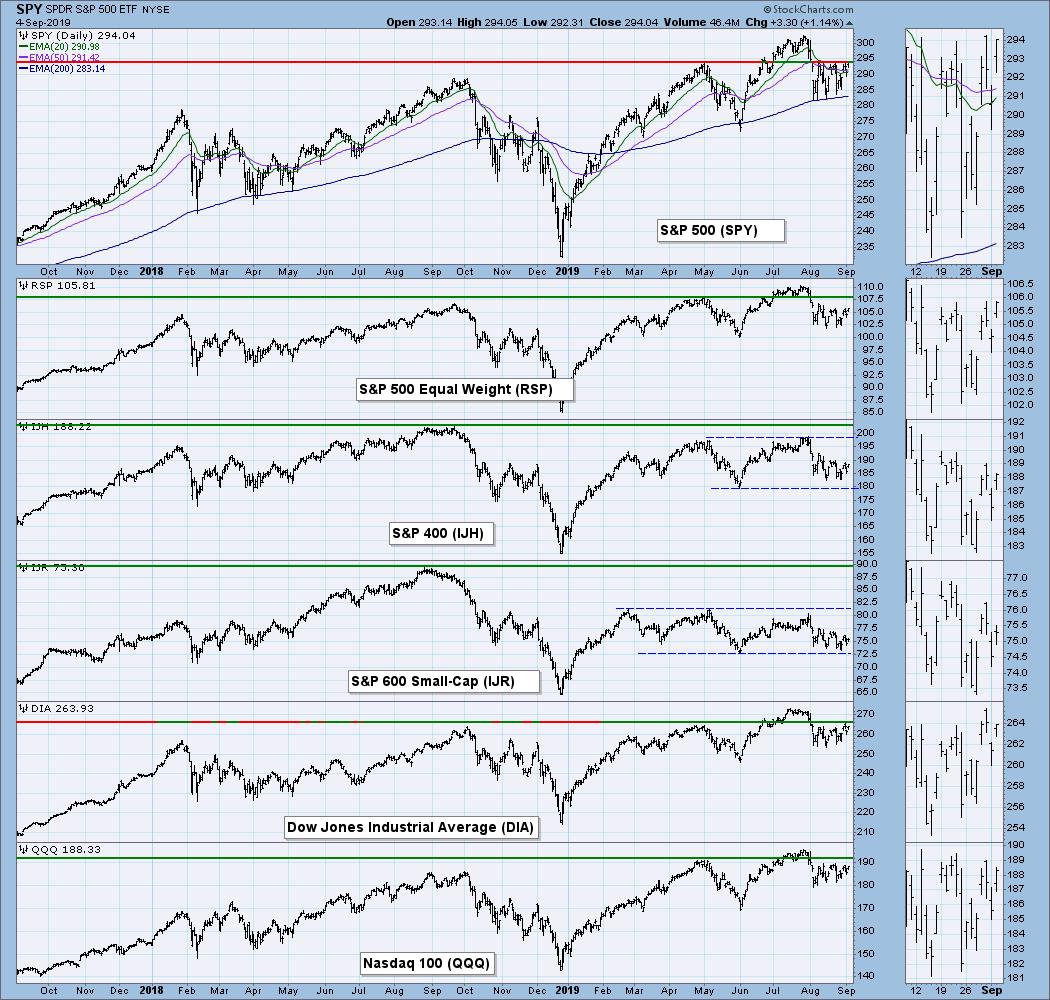
BROAD MARKET INDEXES
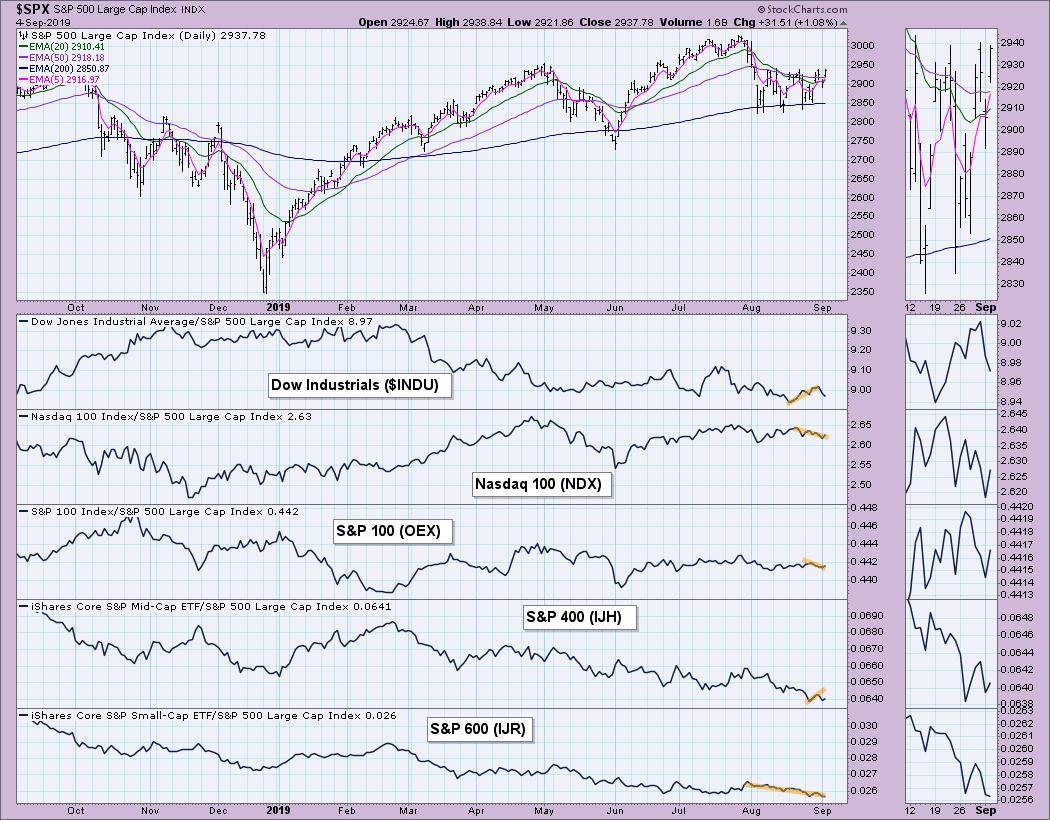
INDEXES PRICE RELATIVE TO SPX
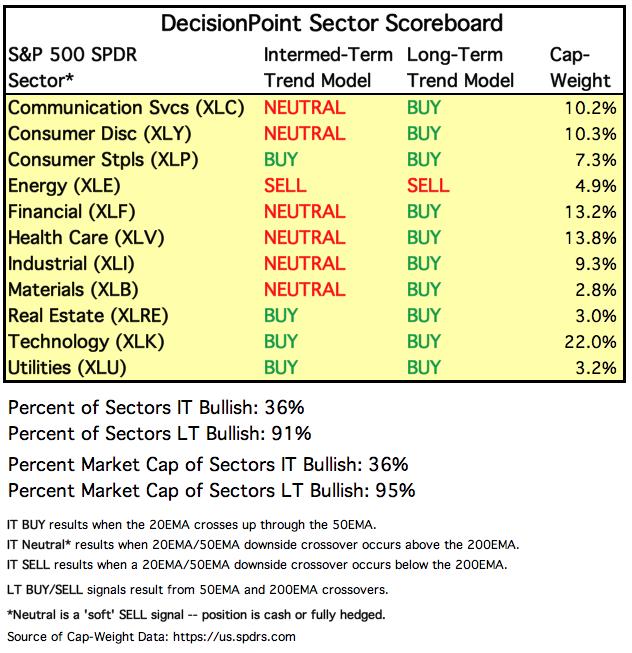
SECTORS
Each S&P 500 Index component stock is assigned to one, and only one, of eleven major sectors. This is a snapshot of the Intermediate-Term and Long-Term Trend Model signal status for those sectors.
STOCKS
IT Trend Model: Neutral as of 8/14/2019
LT Trend Model: BUY (SPY) as of 2/26/2019
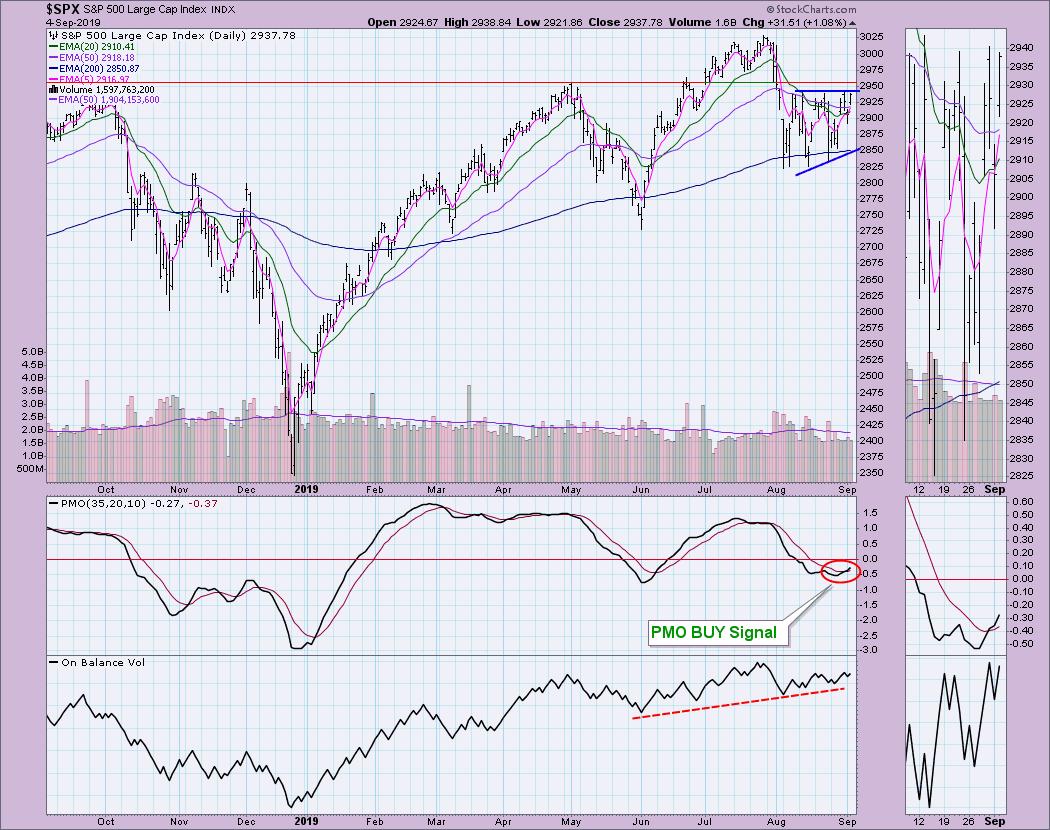
SPX Daily Chart: When you look at the OHLC bars on the daily chart, you can see there is a bullish ascending triangle forming. The PMO logged a BUY signal last week and the OBV (unlike the NDX) is trending higher.
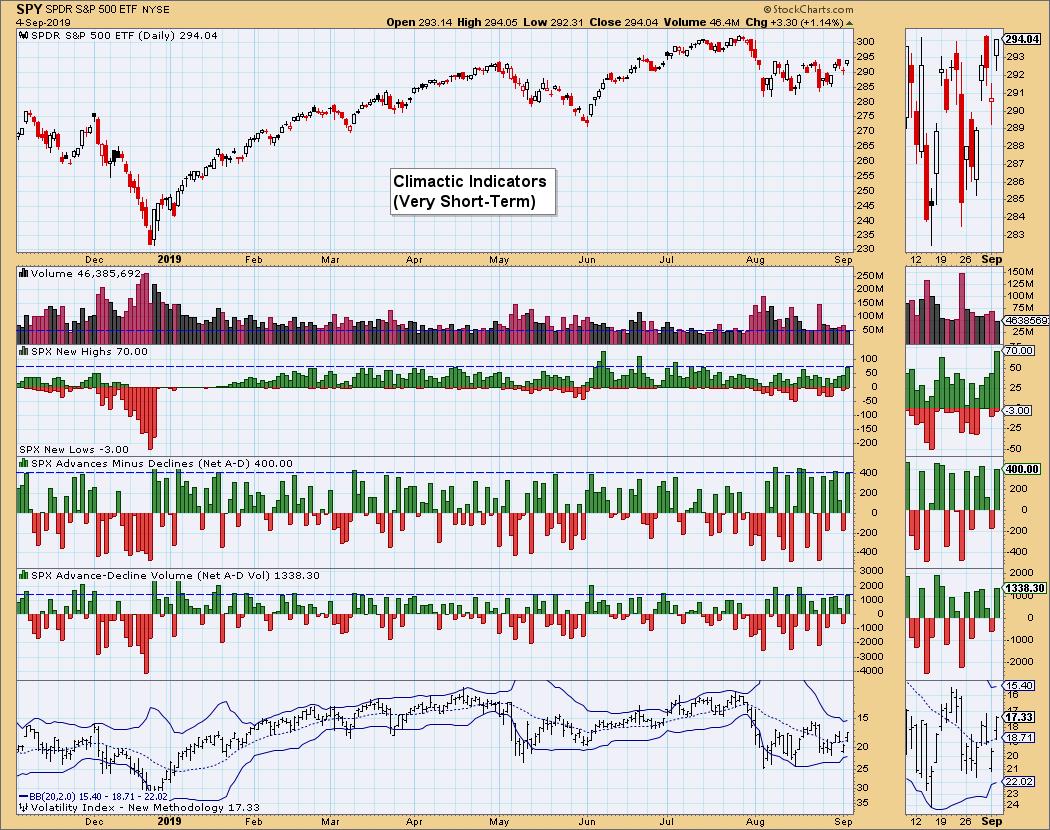
Climactic Market Indicators: Breadth readings were certainly climactic to the upside today. As Carl pointed out on the DecisionPoint show last Friday, the readings are just about as choppy as trading has been in August. I do like that climactic negative readings are trailing off. The VIX is getting close to the upper Bollinger Band, which generally is a sign to expect lower prices for a few days, but we can still see values move lower on the VIX before that happens.
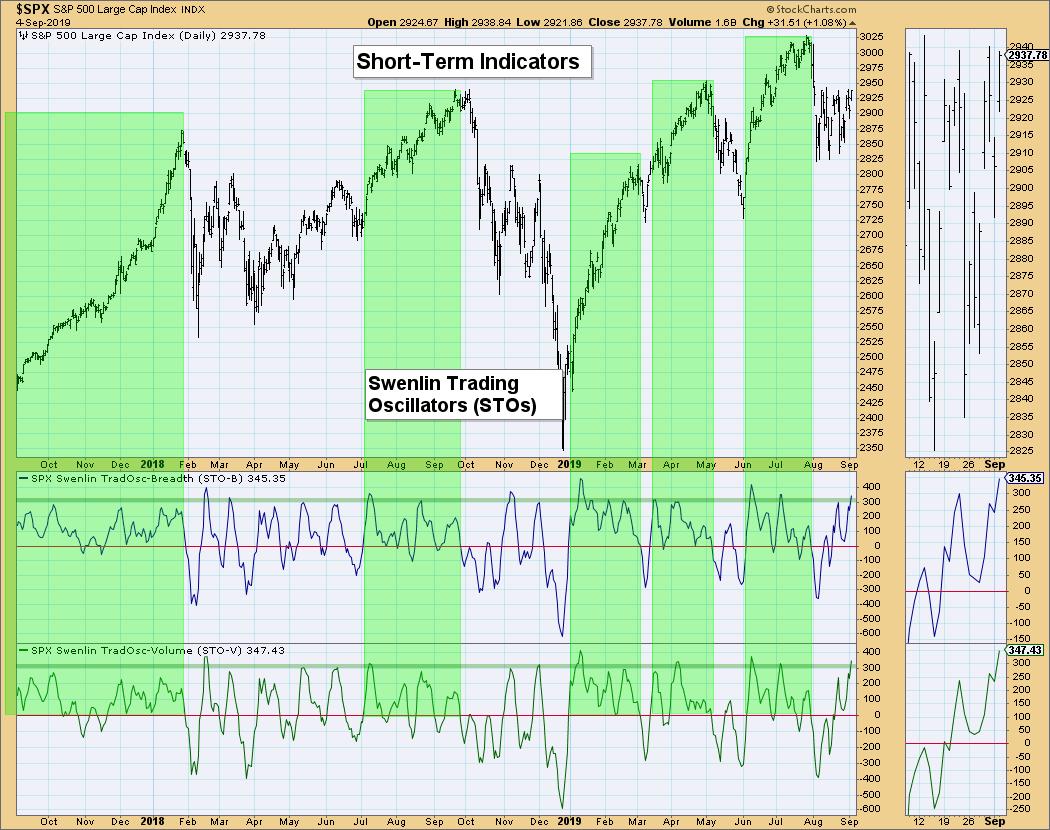
Short-Term Market Indicators: There's no arguing how overbought these indicators are, yet they are still rising. They have seen higher readings, but suspect in the short-term we might see prices move lower rather than higher to execute the chart patterns I annotated above. If you look at the ascending triangle on the SPX, you can see that it could take a dip and keep the pattern alive as long as it doesn't give up the rising bottoms trend line.
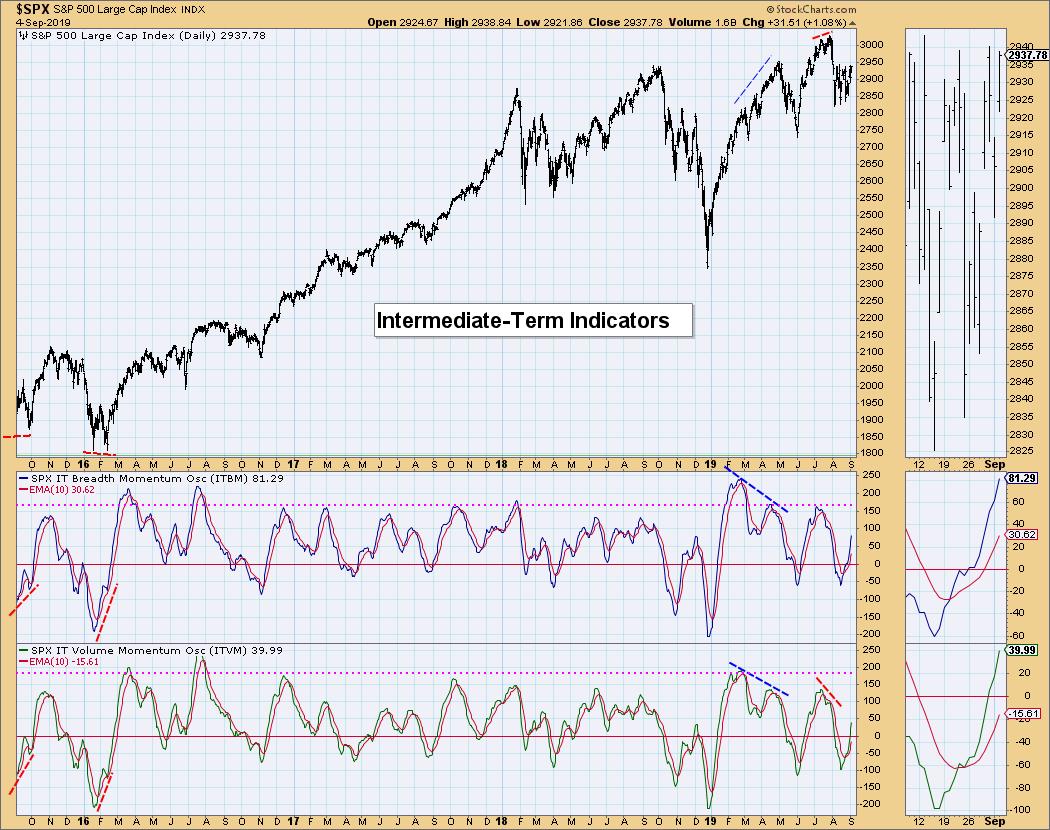
Intermediate-Term Market Indicators: What I find very encouraging are the rising ITBM and ITVM. These are showing very little hesitation on their upswing and are not particularly overbought, which bodes well for the intermediate term.
Conclusion: We have bullish chart patterns that have formed, along with strong healthy intermediate-term indicators. My main hesitation right now is how overbought my short-term indicators are. The market does seem ripe for a breakout, but it is just hard to get fully behind that premise with how volatile trading has been. I don't like the wishy-washy volume today on such a nice rally. The bullish chart patterns are very encouraging, but they don't always resolve in the direction they should.
DOLLAR (UUP)
IT Trend Model: BUY as of 2/7/2019
LT Trend Model: BUY as of 5/25/2018
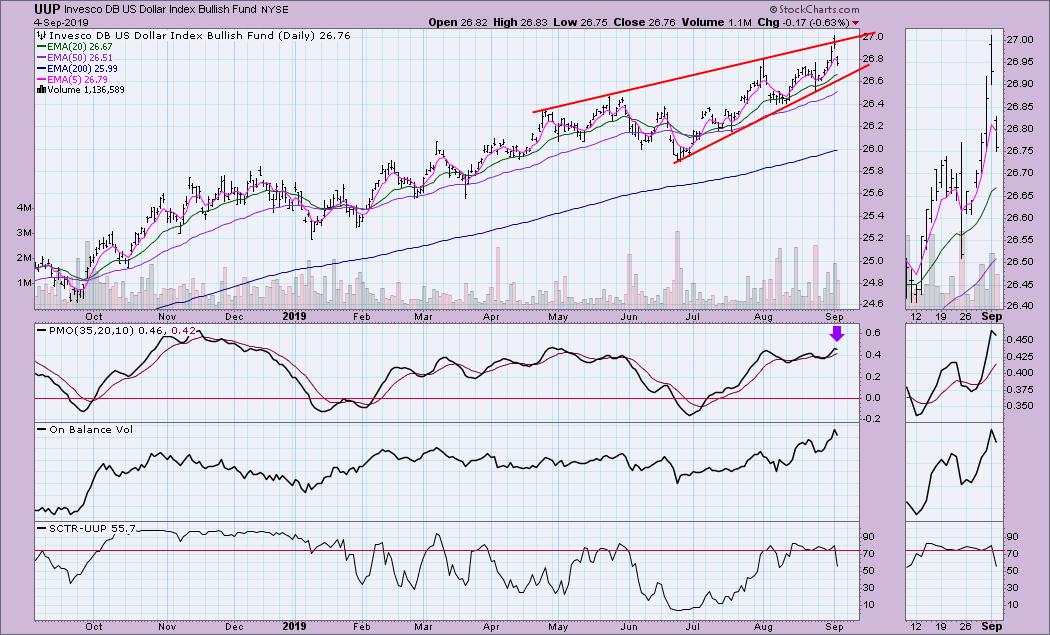
UUP Daily Chart: I have annotated a rising wedge on the Dollar. We did see the PMO tick lower and the SCTR lose steam, falling out of the hot zone. I'm expecting a breakdown. In reality, we don't want to see the Dollar rise too much, as it puts us in danger of deflation. I had the privilege to watch one of John Carter's big picture presentations at SimplerTrading yesterday; he believes the Fed will lower rates further in an effort to prevent deflation. If the global economies begin moving toward negative interest rates, the Fed will be forced to do so in order to avoid deflation; this course of action will lower the Dollar.
GOLD
IT Trend Model: BUY as of 6/3/2019
LT Trend Model: BUY as of 1/8/2019
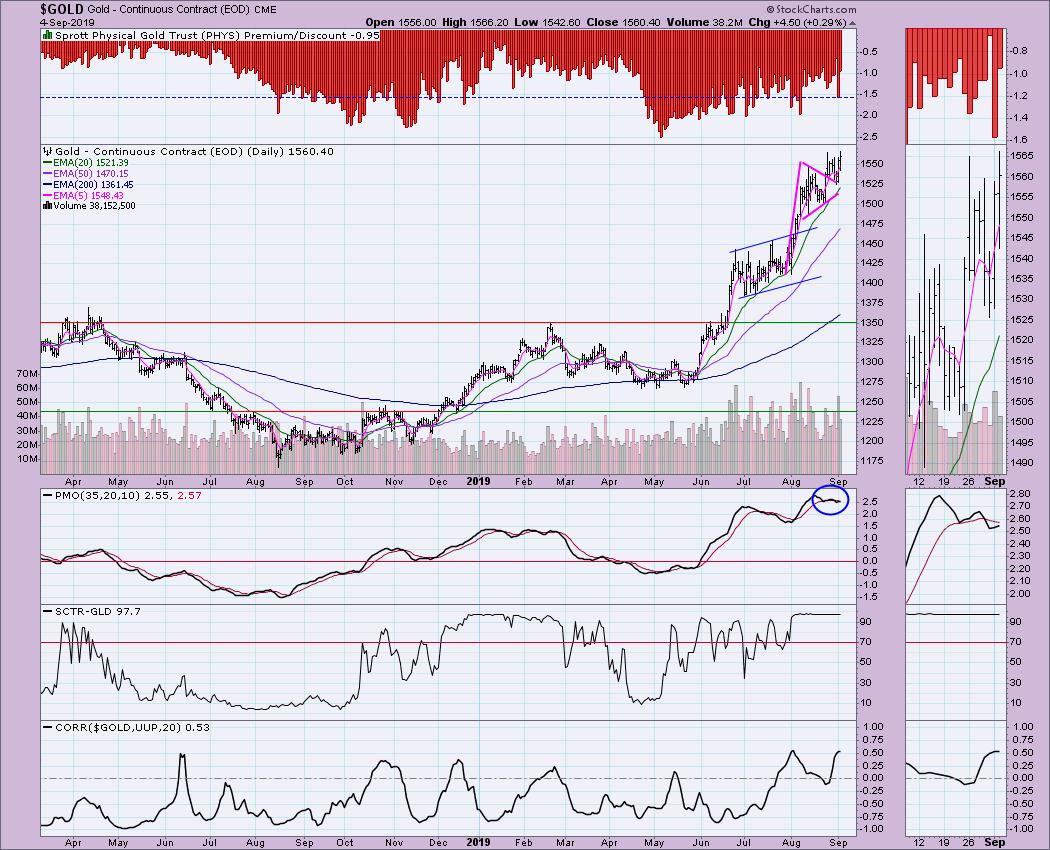
GOLD Daily Chart: Yesterday, we saw very high discounts for PHYS. This is a bearish sentiment reading and, sentiment being contrarian, suggests a bullish move to the upside. We did see higher prices on Gold today and a new multi-year high intraday. The PMO is overbought, but, if Gold continues to consolidate as it rises, it should take it out of overbought territory. The SCTR is still strong. Interestingly, the Dollar/Gold correlation is very positive, which is unusual. It does tell me there are many buyers of Gold out there that are overriding the correlation. What I would like to see is the negative correlation return. The reason: I'm looking for the dollar to drop and the normal negative correlation would benefit Gold.
CRUDE OIL (USO)
IT Trend Model: Neutral as of 5/30/2019
LT Trend Model: SELL as of 6/4/2019
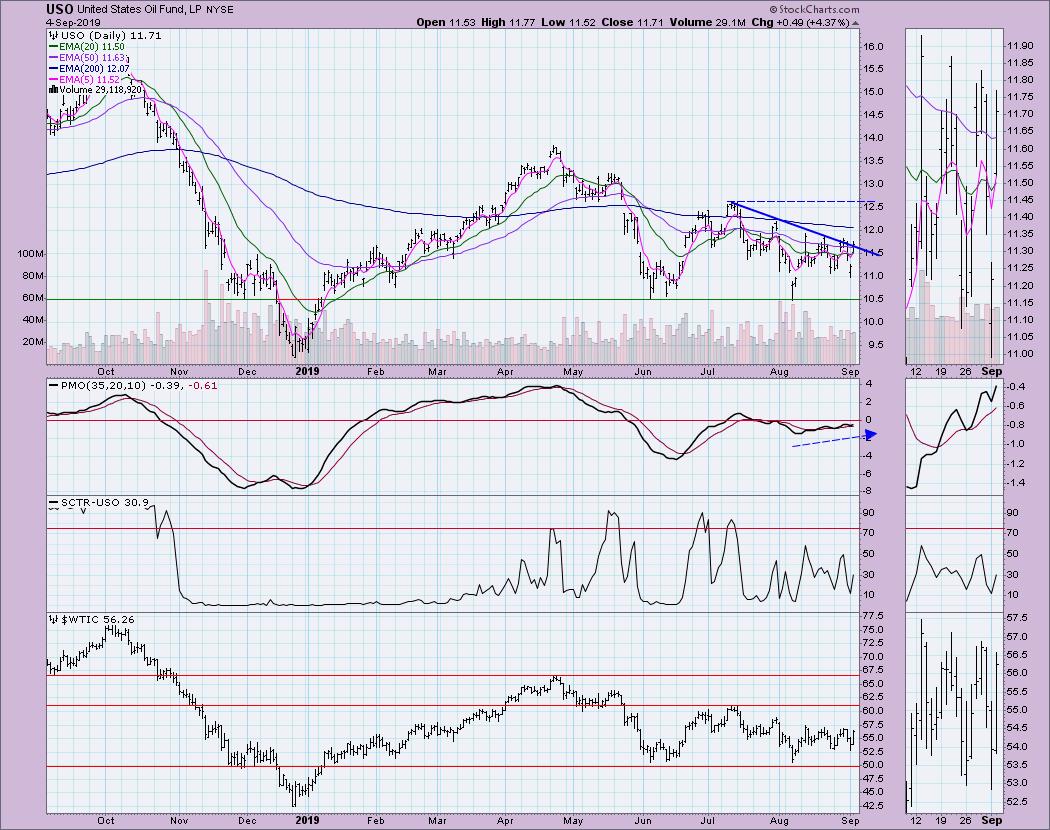
USO Daily Chart: The declining trend remains intact. Price has been rapping on the door in the past week, but with no successful breakout. The good news is that the PMO is trending higher and on a BUY signal. That suggests an upside breakout, but, with the 50-EMA far below the 200-EMA, we have to temper any bullish expectations here.
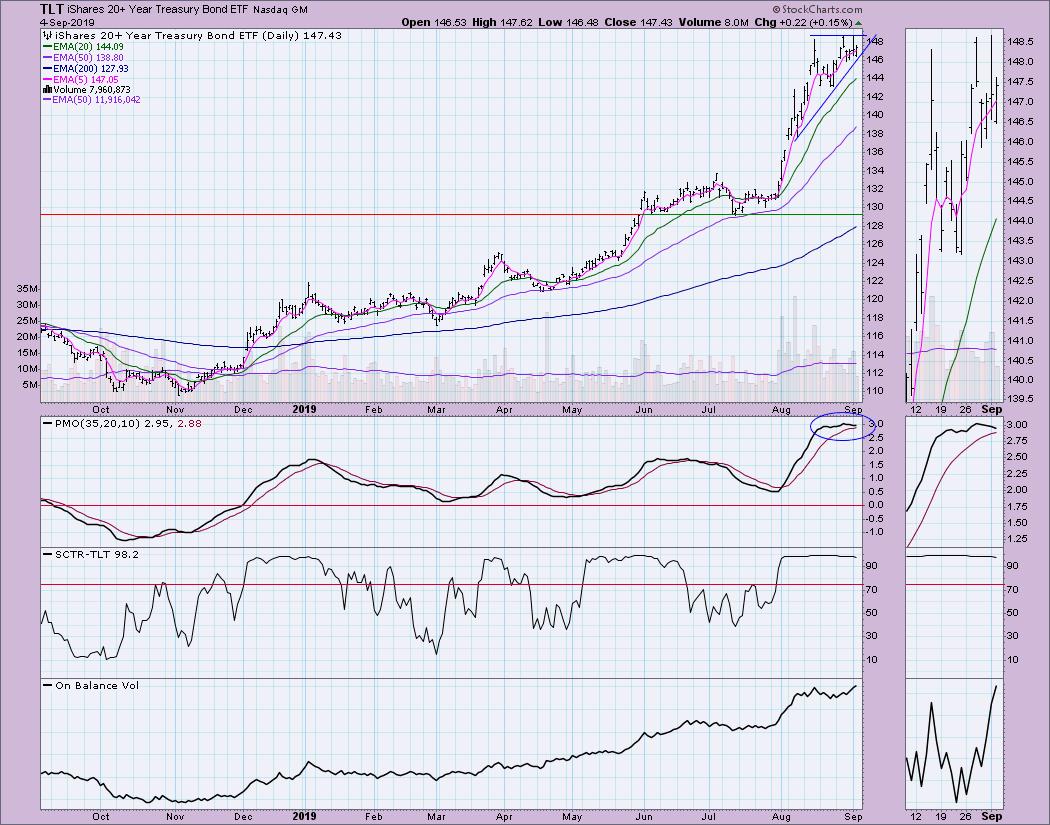
BONDS (TLT)
IT Trend Model: BUY as of 12/6/2018
LT Trend Model: BUY as of 1/2/2019
TLT Daily Chart: TLT is in a very steep rising trend; less steep that it was, but steep nonetheless. The PMO is very overbought and has turned lower. As with Gold's overbought PMO, I don't believe that we have to see price plummet in order to move it out of overbought territory. Consolidation here makes sense as price does seem to have found resistance just above $148.50. The OBV just hit a new high, so I'm not expecting a breakdown here; maybe just some sideways movement to unwind the PMO.
Technical Analysis is a windsock, not a crystal ball.
Happy Charting! - Erin
Email: erinh@stockcharts.com
**Don't miss any of the DecisionPoint commentaries! Go to the "Notify Me" box toward the end of this blog page to be notified as soon as they are published.**
NOTE: The signal status reported herein is based upon mechanical trading model signals, specifically, the DecisionPoint Trend Model. They define the implied bias of the price index based upon moving average relationships, but they do not necessarily call for a specific action. They are information flags that should prompt chart review. Further, they do not call for continuous buying or selling during the life of the signal. For example, a BUY signal will probably (but not necessarily) return the best results if action is taken soon after the signal is generated. Additional opportunities for buying may be found as price zigzags higher, but the trader must look for optimum entry points. Conversely, exit points to preserve gains (or minimize losses) may be evident before the model mechanically closes the signal.
Helpful DecisionPoint Links:
DecisionPoint Shared ChartList and DecisionPoint Chart Gallery
Price Momentum Oscillator (PMO)
Swenlin Trading Oscillators (STO-B and STO-V)
