Market Recap for Tuesday, September 22, 2015
Simply put, it's ALWAYS better to see afternoon buying.
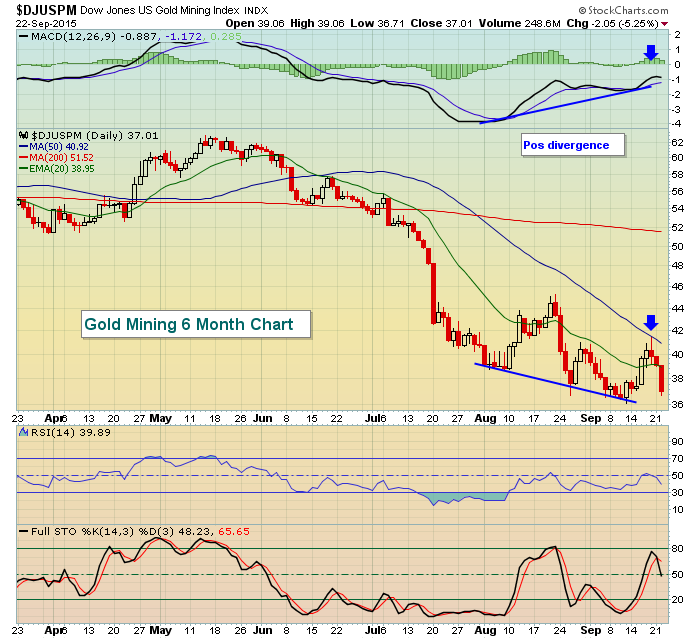
Despite the late day strength, all 9 sectors finished lower on Tuesday, but most areas finished well off their intraday lows, a positive sign at least for the very near-term. Healthcare (XLV) was the best performing sector, dropping just 0.61% on the day while materials lagged and fell 1.86%. Gold mining ($DJUSPM) was the second worst performing industry group as it declined 5.25% on the day. Only coal ($DJUSCL) had a worse day, falling 6.24%. After working off its recent positive divergence, gold mining appears to be poised for a further decline in my opinion. Here's the chart:
I like to use the MACD for several reasons, but two in particular:
(1) When I see a positive (or negative) divergence emerge, it's a sign of potential slowing momentum, NOT a guarantee of a bottom. So I look for temporary strength to test 50 day SMA resistance and/or MACD centerline resistance. Whether a longer-term bottom is in or not depends on what happens AFTER those tests. In this case, the 50 day SMA was tested (blue arrow) and gold mining shares have resumed their downtrend. Loss of support in the 36.00-36.50 would add to the bearishness here.
(2) While not featured on this chart, I love to trend trade stocks with MACDs pointing higher while price action pulls back to test rising 20 day EMAs. I generally find that 20 day EMA to be great support in a rising market.
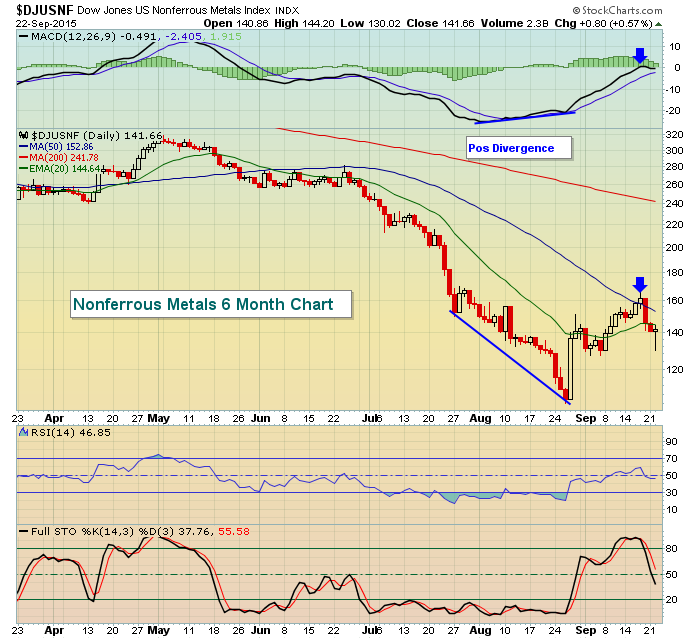
Interestingly enough, while one of the worst performing industry groups was in the materials sector, so was the best - Nonferrous metals ($DJUSNF). Check this one out as it too drives home my use of the MACD:
Pre-Market Action
U.S. futures were mostly lower last night, but improved as trading in Europe improved this morning. And it's a good thing trading has improved in Europe because there's a very tight positive correlation between the S&P 500 and the German DAX as I've shown before and am showing again below:
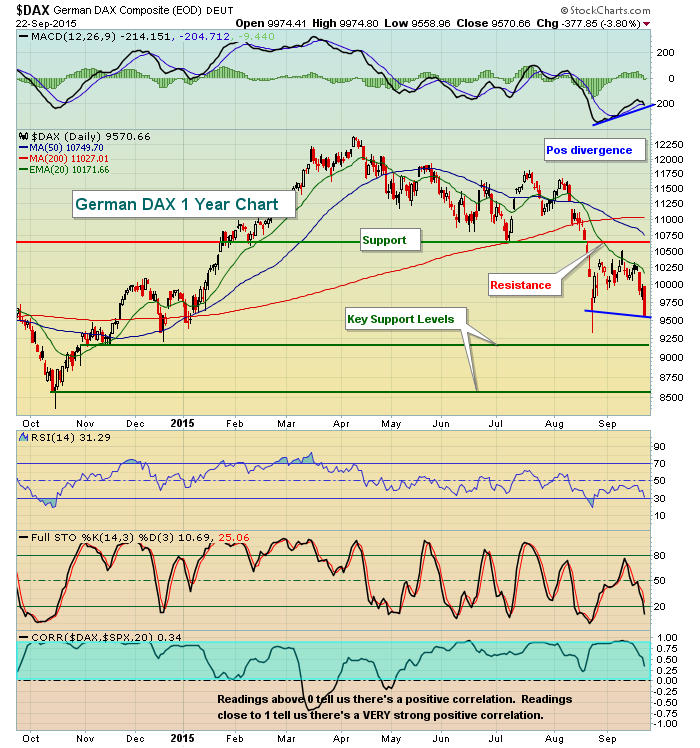
A couple things to note here. First, while there is a positive divergence on the MACD as illustrated with the blue lines, please understand that divergences can be eliminated by continuing price action in a particular direction. For instance, if the DAX turns lower later today and continues downtrending, we could see the MACD continue to fall to the point where the positive divergence is eliminated. So I'd look for one of two things to occur to turn a bit more bullish here. I'd want to see either a close back above 9700 OR a long tail to the downside (similar to the August bottom) suggesting a reversal is in order. Until you see that, be careful. Second, that positive divergence, should it play out, would take prices back to the 50 day SMA, currently at 10750. That also coincides with price resistance just below that level. Obviously, if the DAX reverses back to its 50 day SMA, that would almost certainly bolster equity prices here in the U.S. Therefore, that's a word of caution for those in the bearish camp.
U.S. futures have fallen back off their morning highs and all of this pre-market volatility underscores the type of market we're in. It's not easy as uptrends become downtrends rather quickly. We can't lose sight of the fact that we've witnessed heavy volume breakdowns in August so the pressure is squarely on the bulls in the near-term.
Current Outlook
It was another wild day in the market as the bears held the upper hand throughout much of the session. NASDAQ volume wasn't light with 2 billion shares changing hands so there was the chance things would get ugly. Instead, a rally kicked in just past 1pm EST after a positive divergence printed on a short-term intraday chart. Take a look:
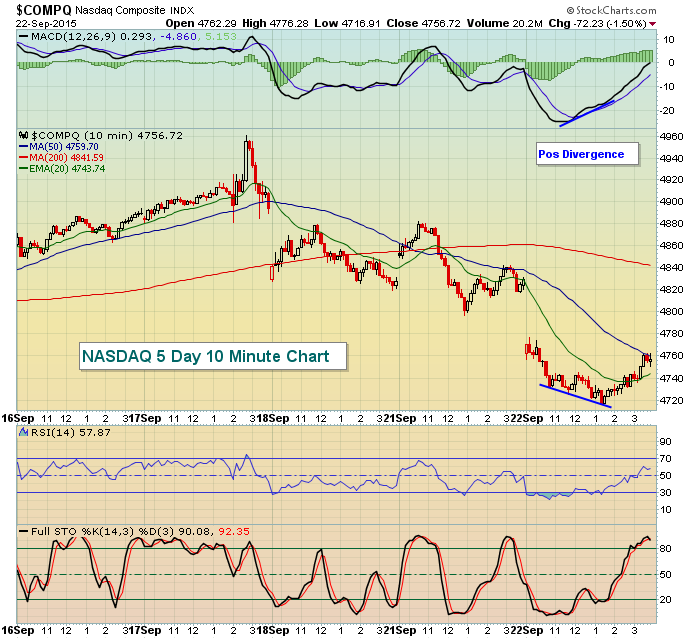
That's a very short-term chart, however. I prefer to use 60 minute charts to help identify trading opportunities and on the NASDAQ's 60 minute chart, price action looks a bit different:
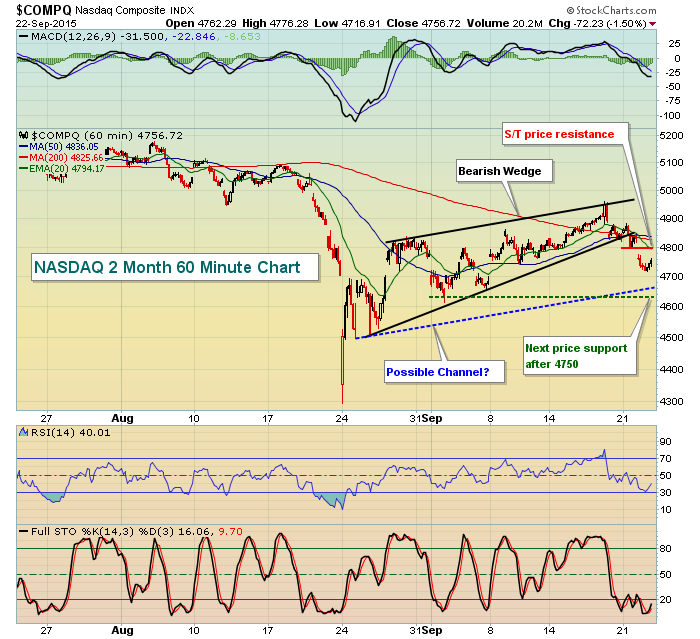
A few notable technicals here. First, the bearish wedge broke to the downside on Monday. While not marked on this chart, the recovery on Tuesday enabled the bulls to hold onto short-term support at 4750 at the close. U.S. futures are pointing to a higher open (more on that below) and that could bring short-term resistance at approximately 4800 and the declining 20 hour EMA, currently at 4794, into play. I'm short-term bearish so tests in that area would represent opportunities on the short side of the market, if you so desire. From a bullish perspective, the blue dotted and green dotted lines offer up two possibilities. While the bearish wedge has broken, there's still the possibility that a channel emerges. The blue dotted line would provide support in this channel as the slope of the potential lows is identical to the slope of the black resistance line (upper line) in the bearish wedge pattern. I've also highlighted next support near 4630 with that green dotted line. 4750 is initial closing support.
Sector/Industry Watch
We're one month removed from those nasty August lows and our best performing industry group over this past month of recovery has been........brewers ($DJUSDB)! Perhaps that should tell us something about how everyone feels about this market! All kidding aside, the DJUSDB has actually made a significant long-term breakout and it's part of the defensive consumer staples (XLP) sector. Given the high volatility in the market, a long trade in a defensive area might make sense for many. Let's take a look at the long-term weekly chart and the breakout:
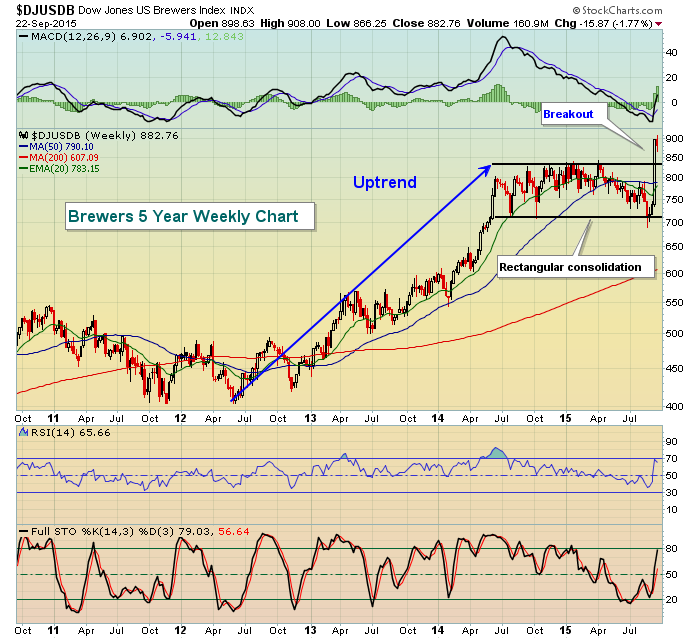
The long-term breakout occurred near 835 so any weakness down to that level or to the rising 20 week EMA would represent solid technical entry to improve your reward to risk. Keep this one on your radar, especially if the stock market weakens further later this month into October.
Historical Tendencies
I'll leave this up for maybe one more trading day, but it's indicative of serious bearish action this time of year so it's worth seeing a refresher every morning. The following represents the annualized returns on the NASDAQ since 1971 for each of the following days this week:
September 21 (Monday): -92.11%
September 22 (yesterday): -83.40%
September 23 (today): -41.45%
September 24 (Thursday): -18.48%
September 25 (Friday): -53.51%
Key Earnings Reports
None
Key Economic Reports
September PMI manufacturing index to be released at 9:45am EST: 53.1 (estimate)
Happy trading!
Tom
