Market Recap for Monday, August 15, 2016
The Russell 2000 index surged nearly 1%, more than three times the percentage gain seen on the S&P 500 as small caps were once again held in favor by traders. The outperformance by small caps has been continuing since the S&P 500 bottomed in February. One issue faced by the Russell 2000 is the easily identifiable negative divergence on its daily chart that has printed despite the Russell 2000's highest close since July 23, 2015. Check it out:
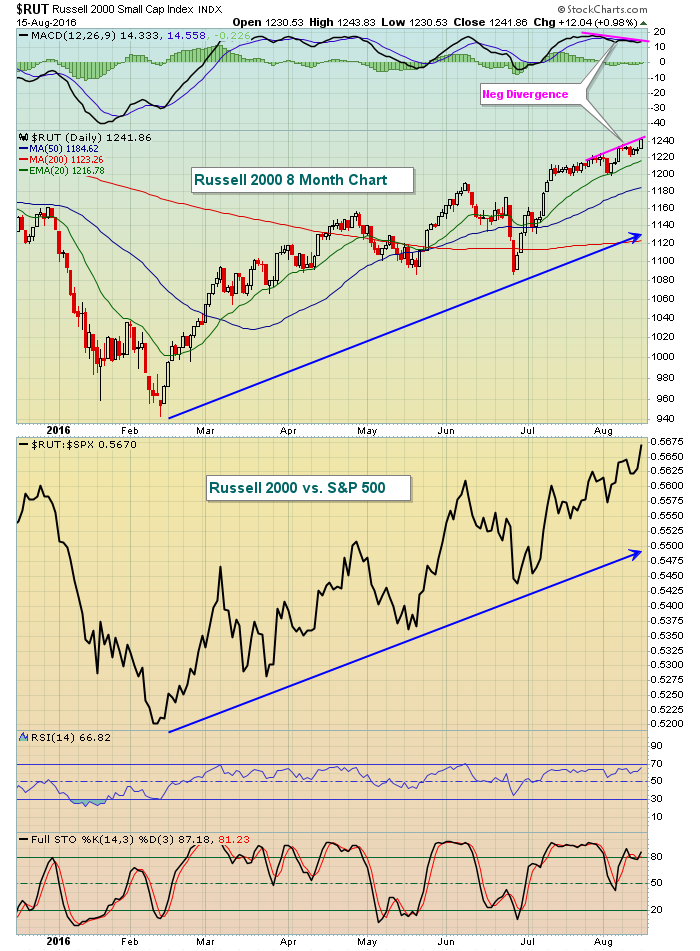 Small caps are approaching overbought territory, but their relative outperformance has been quite evident since February. So while the S&P 500 has been setting all-time highs and the Russell 2000 has not, the Russell has actually been the better investment since this rally began in February.
Among sectors, aggressive areas ruled the day. Materials (XLB, +1.01%), energy (XLE, +0.80%), financials (XLF, +0.67%) and industrials (XLI, +0.67%) led the action while utilities (XLU, -1.53%) suffered the primary blow and are now down approximately 5.50%-6.00% since topping just above 53.00 at the beginning of July.
Pre-Market Action
U.S. futures are down slightly this morning despite solid housing starts and building permits numbers. The Dow Jones futures are lower by 30 points, in lock step with markets around the globe overnight and this morning. Most major indices in world markets saw profit taking last night or are in the process of seeing it this morning.
Home Depot (HD) reported quarterly results this morning mostly in line with forecasts. They did, however, raise guidance and that's prompted a very modest bullish response in HD shares in the pre-market.
Current Outlook
The price action has been undeniably bullish and it's very difficult to argue against all-time highs, but the action "under the surface" of these gains has not been perfect, that's for sure. The performance of consumer stocks remains a mystery to me. The aggressive consumer discretionary stocks typically outperform the more defensive consumer staples stocks by a wide margin during significant bull markets. But that has not been the case in 2016, although the XLY:XLP ratio has been climbing post-Brexit. Here's the latest look at this key ratio:
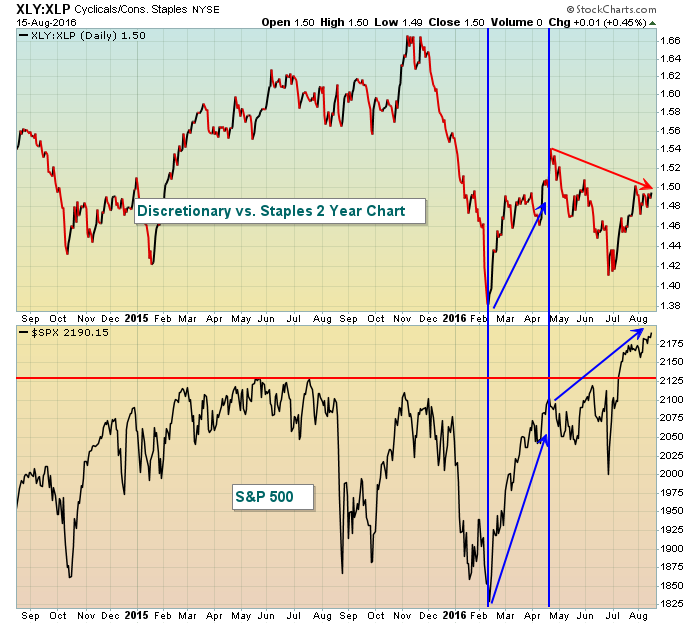 During the initial phase of this 2016 rally, everything was fine. The S&P 500 was moving higher and so was the XLY:XLP ratio. But since April, the S&P 500 has moved higher with more consumer leadership coming from staples - a warning sign. Still, this is just a warning sign, not a guarantee of impending doom. We must respect the bull market until major deterioration in price action unfolds.
Sector/Industry Watch
It's been a huge run for the Dow Jones U.S. Internet Index ($DJUSNS) since finally clearing the stubborn 1100 level. The group still looks quite bullish, but overbought conditions on the daily chart could begin to catch up with it. Take a look:
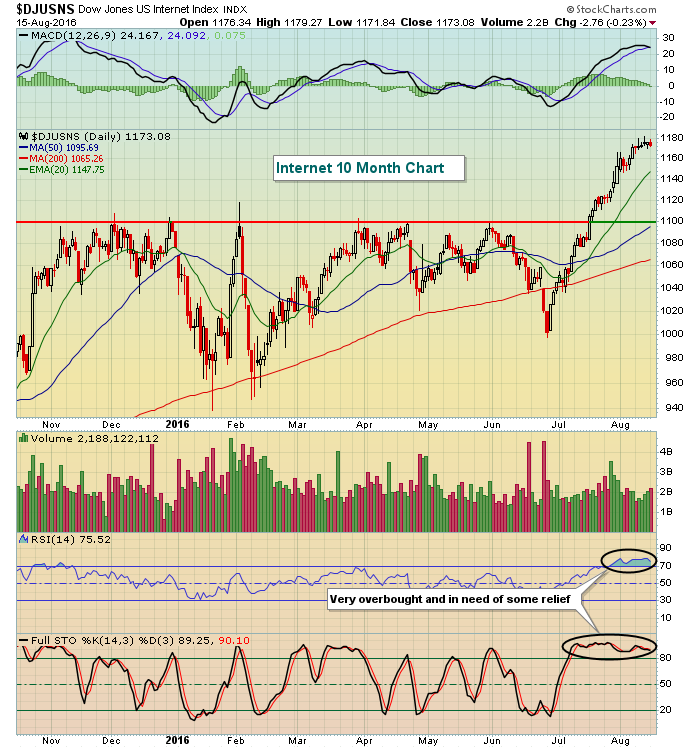 You can see it's been a parabolic rise. We haven't even come close to a rising 20 day EMA test, which is where I'd expect the initial support to be felt. Price support resides down at 1100. The RSI and stochastic have both been in overbought territory for at least three weeks and that normally results in at least a period of consolidation to unwind those oscillators.
Historical Tendencies
Small caps are in the midst of one of their few bright seasonal patterns in August and September. The Russell 2000 tends to perform well from August 14th through 17th, as reflected below:
August 14th: +46.94%
August 15th: +22.14%
August 16th: +69.16%
August 17th: +43.56%
Key Earnings Reports
(actual vs. estimate):
AAP: 1.90 vs 2.13
DKS: .82 vs .68
HD: 1.97 vs 1.96
TJX: .84 vs .80
(reports after close, estimate provided):
URBN: .56
Key Economic Reports
July CPI released at 8:30am EST: +0.0% (actual) vs. +0.0% (estimate)
July Core CPI released at 8:30am EST: +0.1% (actual) vs. +0.2% (estimate)
July housing starts released at 8:30am EST: 1,211,000 (actual) vs. 1,180,000 (estimate)
July building permits released at 8:30am EST: 1,152,000 (actual) vs. 1,160,000 (estimate)
July industrial production to be released at 9:15am EST: +0.3% (estimate)
July capacity utilization to be released at 9:15am EST: 75.5% (estimate)
Happy trading!
Tom
