Market Recap for Wednesday, October 26, 2016
The Dow Jones finished in positive territory yesterday while the S&P 500, NASDAQ and Russell 2000 all declined. It was a particularly rough day for the Russell 2000, which fell 0.93%. The bifurcation was also seen throughout our sectors as four sectors rose while the other five declined. There was no rhyme or reason to the sectors showing strength as two aggressive sectors - financials (XLF, +0.61%) and industrials (XLI, +0.35%) - led the action, but was accompanied by a defensive group, utilities (XLU, +0.25%). On the down side, relative weakness was felt by both an aggressive sector - technology (XLK, -0.56%) - and a defensive sector - healthcare (XLV, -0.61%). Performance at the industry group level was similarly discombobulated.
But the Russell 2000 relative weakness is probably the one to keep the closest eye on. Check this out:
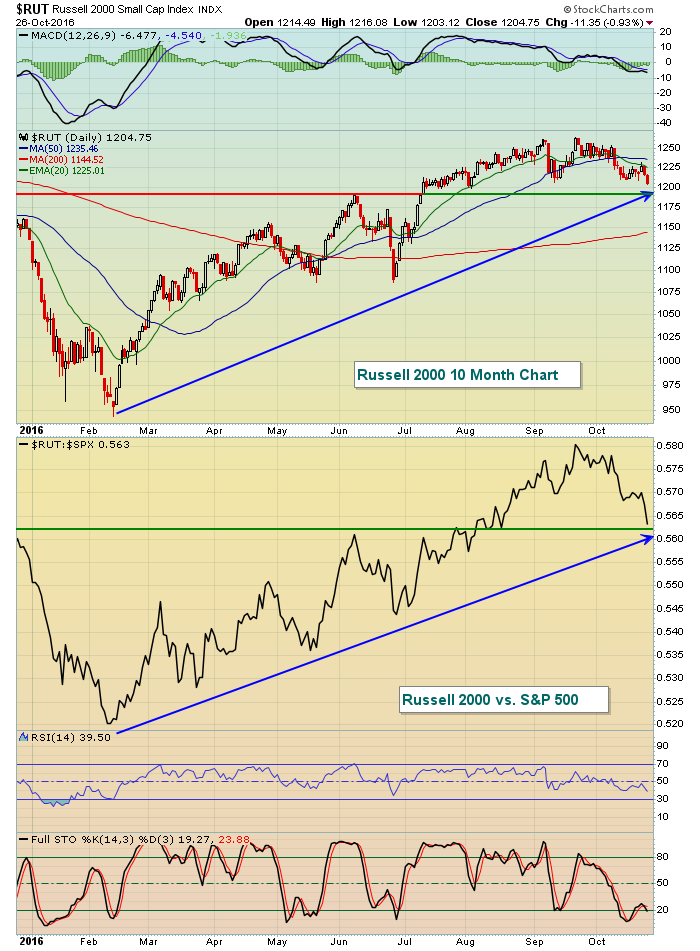 The Russell 2000 is obviously at key support and relative support levels. A break below 1190 on the Russell 2000 and further deterioration in the relative trend line would represent a check mark in the bears' column.
Pre-Market Action
Global markets provided little clues overnight and this morning as most key indices were fairly close to the flat line. Earnings continue to pour in and traders are evaluating whether they're strong enough to warrant higher prices overall. Big names continue to report as both Alphabet (GOOGL) and Amazon.com (AMZN) will report tonight and have a huge potential impact on the direction of our major indices.
Dow futures are higher by 41 points at last check with just 30 minutes left to the opening bell.
Current Outlook
This morning, the 10 year treasury yield ($TNX) is clearing its most recent high of 1.80% after testing its rising 20 day EMA. This is a bullish pattern and tells me this rise in treasury yields has further to go. Here's the chart:
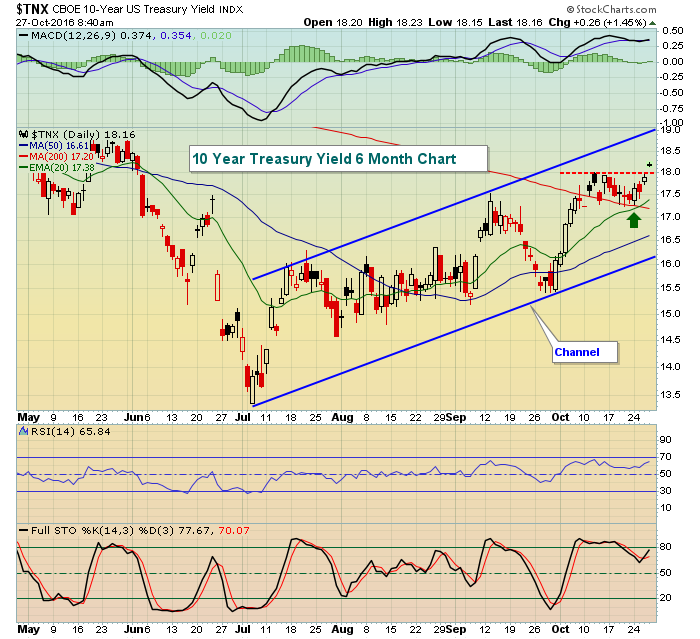 A breakout in the treasury yield represents a breakdown in treasury prices. That's bullish for equities as the selling of treasuries typically occurs as signs of an improving economy strengthen. The proceeds from treasury selling often times will find a new home in equities so this morning's breakout could be a precursor to a long-awaited breakout in the S&P 500. We'll see.
Sector/Industry Watch
Over the past month, the Dow Jones U.S. Oil Equipment & Services Index ($DJUSOI) has been the best performing industry group, gaining 8.78% while the benchmark S&P 500 has been down close to 2%. The technical outlook for the DJUSOI remains very strong and I'd even look for solid performance the balance of this week into next based on the rising 20 day EMA test on Wednesday. Have a look:
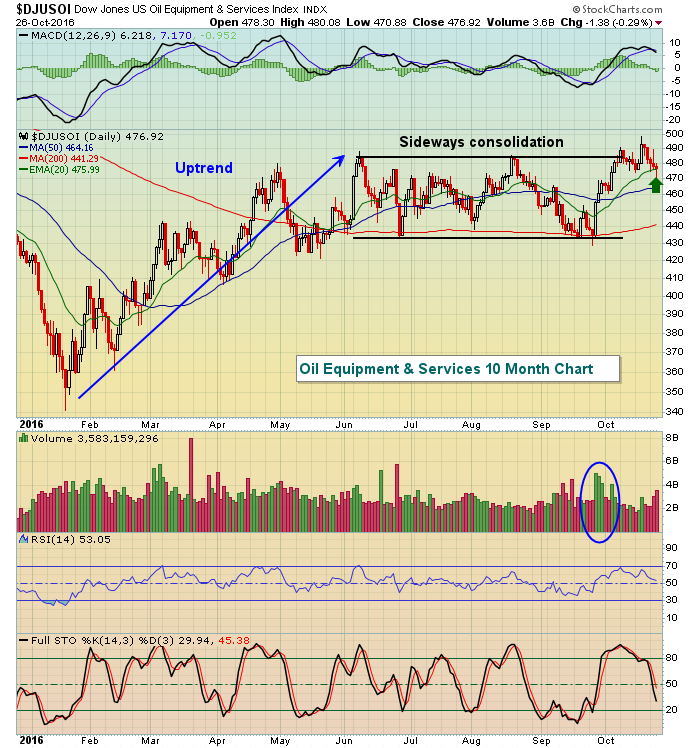 The DJUSOI recently broke out of its trading range and on the recent pullback has tested its rising 20 day EMA, generally solid support. Furthermore, the reversal yesterday left a hammer on that 20 day test, another bullish signal. I'd look for strength today and a resumption of its recent uptrend.
Historical Tendencies
The Russell 2000 follows the lead of the S&P 500 and NASDAQ in terms of historical performance. The October 28th to November 6th period has produced annualized returns of +84.57% since 1987. Also, the Russell 2000 has moved higher 55% of ALL days since 1987, but during this upcoming bullish period, that percentage rises to 68.50%. At the close today, bullish historical tailwinds take over.
Key Earnings Reports
(actual vs. estimate):
ABB: .32 vs .28
AET: 2.07 vs 2.02
ALXN: 1.18 vs 1.04
AMT: 1.49 vs 1.39
BCS: .00 (estimate - haven't seen actual)
BMY: .77 vs .65
BT: .47 vs .46
BX: .57 vs .51
CELG: 1.39 vs 1.31
CL: .73 vs .73
CME: 1.05 vs 1.04
COP: (.66) vs (.69)
DOW: .91 vs .80
F: .26 vs .21
IP: .91 vs .94
MJN: .87 vs .86
MO: .82 vs .81
NOK: .05 vs .05
PX: 1.41 vs 1.40
RTN: 1.79 vs 1.64
SIRI: .04 vs .04
STO: (.09) vs .08
TEF: .21 vs .09
TMO: 2.03 vs 1.97
TWTR: (.10) vs (.15)
UPS: 1.44 vs 1.43
(reports after close, estimate provided):
AFL: 1.74
AMGN: 2.79
AMZN: .85
BIDU: .87
EXPE: 2.24
GOOGL: 6.64
LNKD: .27
MCK: 3.05
SYK: 1.37
Key Economic Reports
September durable goods released at 8:30am EST: -0.1% (actual) vs. +0.2% (estimate)
September durable goods ex-transports released at 8:30am EST: +0.2% (actual) vs. +0.1% (estimate)
Initial jobless claims released at 8:30am EST: 258,000 (actual) vs. 255,000 (estimate)
September pending home sales to be released at 10:00am EST: +1.0% (estimate)
Happy trading!
Tom
