Market Recap for Wednesday, April 19, 2017
The U.S. equity market enjoyed strong early gains on Wednesday only to see them mostly evaporate throughout the balance of the session. The Dow Jones lagged badly all day as one of its components - IBM (-4.92%) - disappointed Wall Street with its latest quarterly results. Weakness in energy (XLE, -1.47%) contributed to the Dow's poor performance as well with both Chevron (CVX) and Exxon Mobil (XOM) among the Dow's worst performers. Energy showed some strength after printing a positive divergence, but after "resetting" its daily MACD to centerline resistance, weakness has resumed in energy in a big way. Here's the chart:
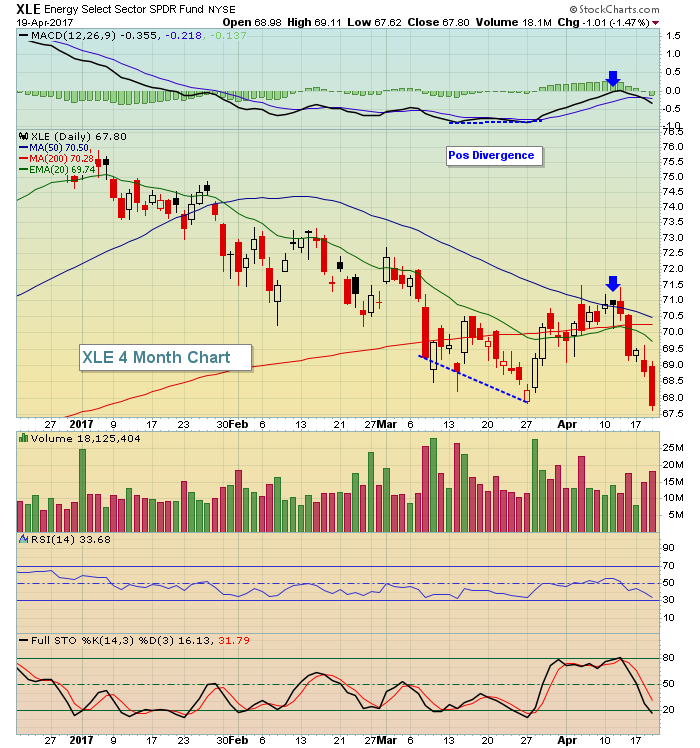 Over the past week, the XLE has dropped 3.97% with the second worst sector (XLF, -0.82%) not even close. Energy's SCTR is at 5.1 with healthcare (XLV, 31.5) the only other sector below 60. Energy has been absolutely horrid since the XLE topped on December 12th at 77.57. Wednesday's close was 67.80. That's a 12.6% decline while the benchmark S&P 500 has climbed roughly 3.75%.
The NASDAQ and Russell 2000 managed gains on a bifurcated market session, although they lost much of strong gains in the first hour of the session.
Pre-Market Action
After recent strength, crude oil ($WTIC) is once again moving lower and threatening to lose psychological $50 per barrel support. That will not help an already weak energy sector. The 10 year treasury yield ($TNX) is creeping higher, but still below key resistance now at 2.30%. A move above that level would help financial stocks.
With 30 minutes left before the opening bell, Dow Jones futures are higher by 31 points.
Current Outlook
The Dow Jones ($DJI) lost short-term price support with its end of day selling on Wednesday. Key resistance will now be marked by the falling 20 hour EMA in the very near-term. The Dow needs to clear that level to begin to improve its short-term outlook. Take a look:
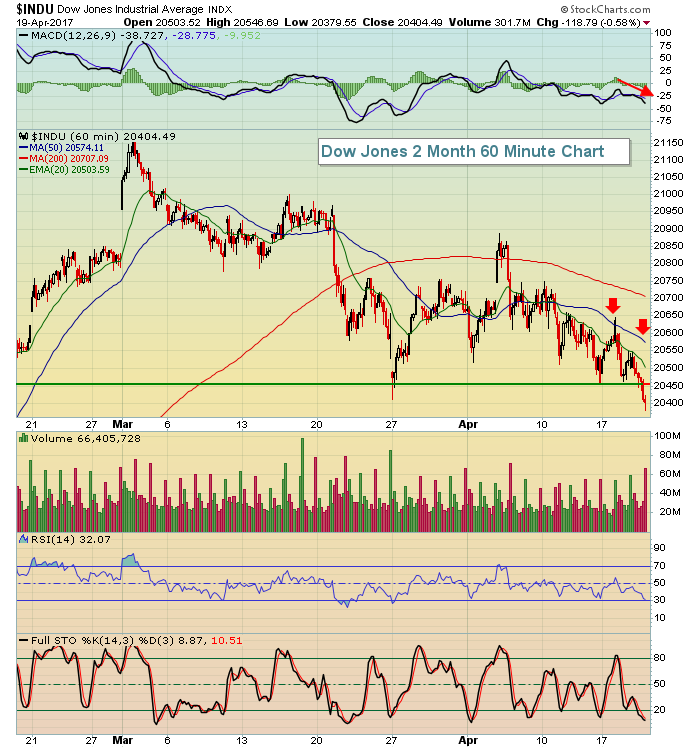 Futures this morning are pointing higher, but we'll see some additional strength to clear that falling 20 hour EMA.
Sector/Industry Watch
Lam Research Corp (LRCX) posted excellent quarterly results on Tuesday after the close and the stock subsequently gained nearly 7% during Wednesday's trading session, lifting semiconductor equipment stocks - many of which have already seen very sizable gains over the past 1-2 years. But the Dow Jones U.S. Semiconductors Index ($DJUSSC) has begun to show much wear and tear technically and even the LRCX earnings report wasn't enough for the index to clear its key moving averages. Take a look below:
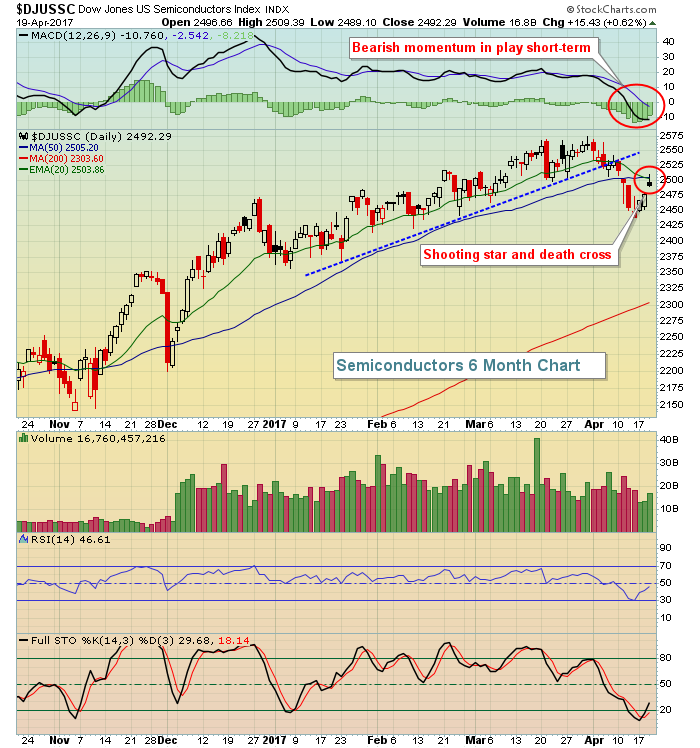 The short-term uptrend (blue dotted line) broke recently with the ensuing weakness accompanied by heavier volume. The rally the past couple days have taken the DJUSSC up to challenge its 20 day and 50 day moving averages, but the shooting star candle is a reversing candle. Furthermore, the MACD looks as bearish as it's looked in a long time. If you're bullish, you want to see this index close back above both those moving averages....and hold. My guess is that the weakness we've seen April 1 is probably just beginning. If the DJUSSC does right itself and move to fresh new highs, the weekly MACD is almost guaranteed to show a negative divergence leading to summertime selling. That would play perfectly into the group's seasonality pattern as you can see below in the Historical Tendencies section.
Historical Tendencies
Semiconductors ($DJUSSC) tend to perform extremely weak during the summer months and with the current rally parabolic in nature and warning signs beginning to emerge, it's probably not a bad idea to at least begin moving out of this group. Check out the upcoming seasonal weakness:
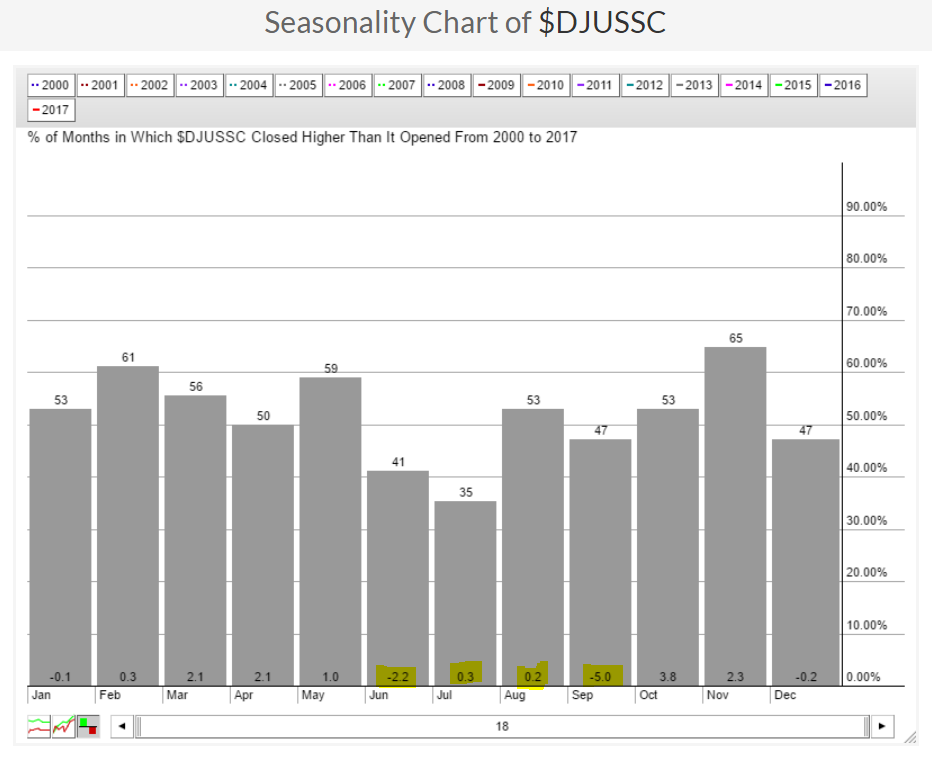 Those average returns highlight the fact that the DJUSSC typically cools down as the temperatures heat up.
Key Earnings Reports
(actual vs. estimate):
ABB: .28 vs .25
ADS: 3.64 vs 3.65
BBT: .74 vs .73
BK: .80 vs .80
BX: .82 vs .68
DGX: 1.33 vs 1.17
DHI: .60 vs .59
DHR: .85 vs .84
KEY: .32 vs .28
PM: .98 vs 1.03
PPG: 1.35 vs 1.31
SHW: 2.27 vs 2.07
SNA: 2.39 vs 2.34
TRV: 2.16 vs 2.41
VZ: .95 vs .98
(reports after close, estimate provided):
ETFC: .39
V: .79
Key Economic Reports
Initial jobless claims released at 8:30am EST: 244,000 (actual) vs. 242,000 (estimate)
April Philadelphia Fed Survey released at 8:30am EST: 22.0 (actual) vs. 25.5 (estimate)
March leading indicators to be released at 10:00am EST: +0.2% (estimate)
Happy trading!
Tom
