Market Recap for Thursday, March 22, 2018
Let me start today's article by saying that the stock market loathes uncertainty. Traders love boring small gains day after day with subtle, anticipated pullbacks to key moving averages or short-term price support levels. You can always tell when the stock market is in a good mood because nothing upsets it. Bad news is routinely ignored, the Volatility Index ($VIX) hovers near single digits, and bears wonder why bad economic reports, geopolitical concerns or warnings from market leaders have relatively no impact on market strength. That's nirvana for me as a trader.
Yesterday was the exact opposite.
The VIX entered a critical zone that warns all of us that a market volcano could erupt. A VIX in the 20s means traders are on pins and needles and it won't take much to set them off as index values plummet. I move to the sidelines with a VIX in the 20s or above. It's simply too risky. We saw a perfect example of that yesterday with the VIX closing back above 22.50 (see Current Outlook section below).
Facebook (FB) has broken down on very heavy volume. Apple (AAPL) failed to hold short-term price support as it's been falling nearly every day the past two weeks. Amazon.com (AMZN) has a negative divergence, but has held up well thus far on a relative basis. That could change soon. Netflix (NFLX)? Same as AMZN - negative divergence. Alphabet (GOOGL) has fallen more than 10% since its March 12th high. The FAANG stocks are in trouble currently and, given the elevated VIX level, things could get much worse.....and very quickly. So be on guard.
To turns things around for the bulls, short-term charts must turn more bullish before intermediate-term charts can. Therefore, watch the hourly chart. During serious downtrends like the one that's now developed, the declining 20 hour EMA typically provides a wall of resistance. Therefore, if we see a short-term rebound today or sometime next week, watch to see if prices can clear that moving average. Here's the visual:
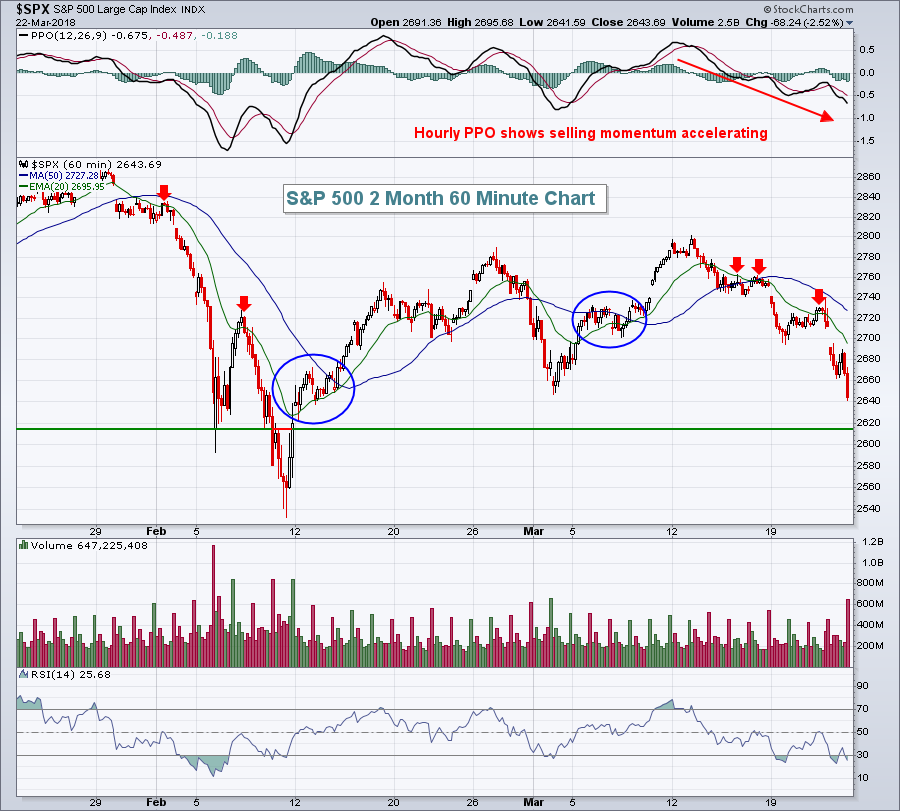 The accelerated selling is likely stemming from the uncertainty surrounding a potential trade war. It's also a very good reason why the Russell 2000 has been outperforming the larger cap, multinational companies by a wide margin during March. A trade war won't impact domestic companies nearly as much as those who do business overseas.
The selling yesterday engulfed many aggressive areas and that makes me pause in terms of trading. Cash and sitting on the sidelines eliminates all of the risk of volatile trading environments. That's the trading position I'm choosing for now.
Pre-Market Action
One area that seems to be enjoying trade war fears is gold ($GOLD). GOLD had risen $25 off its recent low over the past two trading session and it's trading up another $18 today.
Trade wars have also rattled global markets. Last night in Asia, the Tokyo Nikkei ($NIKK) tumbled nearly 1000 points (-4.51%) and Hong Kong's Hang Seng Index ($HSI) fell 762 points, or 2.45%. In Europe this morning, the German DAX ($DAX) is down 170 points, or -1.41%, and is below 12000 again. This happened in August 2017 and again earlier this month. A definitive close beneath 11900 (currently the DAX is trading at 11935) would be another dagger for the S&P 500 as, historically, the DAX and SPX have traded with a very strong positive correlation.
Here in the U.S., Dow Jones futures were down earlier, but with 40 minutes left to the opening bell, are currently higher by 50 points. Be very careful if we open higher, then break to lows that clear Thursday's low as selling could escalate very quickly.
I'll discuss more on MarketWatchers LIVE at noon EST today. Please join Erin Swenlin and me later today if you can. You'll find the show under the "Webinars" tab at the top of the page. You can join anytime after 11:45am EST. It's a free show.
Current Outlook
The Volatility Index ($VIX) broke out yesterday above the reaction high of 22.50 set in early March and that opens the door to violent selling. The violent selling may or may not materialize, but the important part to realize here is that the risk of being long has just shot higher. When the VIX moves into the 20s, 30s and beyond, market makers "go on vacation". One of their primary roles is to provide liquidity. That means that when you or I want to sell, market makers guarantee a buyer on the other side of that trade. The problem is that during periods of high volatility, market makers literally refuse to commit capital at current price levels. They'll buy, but prices will drop rapidly as fear escalates. Market makers won't sit on a bid to accumulate shares. Instead, they'll give their best impersonation of a matador with the red cloth. Prices fall very quickly and normal TA rules - like price support holding - go right out the window. I typically look for reversing candles to begin buying again as such candles illustrate the willingness of market makers to accumulate shares once again. Reversals can be very quick too and, thus, trading becomes quite tricky and dangerous. I always prefer a low VIX trading environment.
Check out the VIX breakout on Thursday:
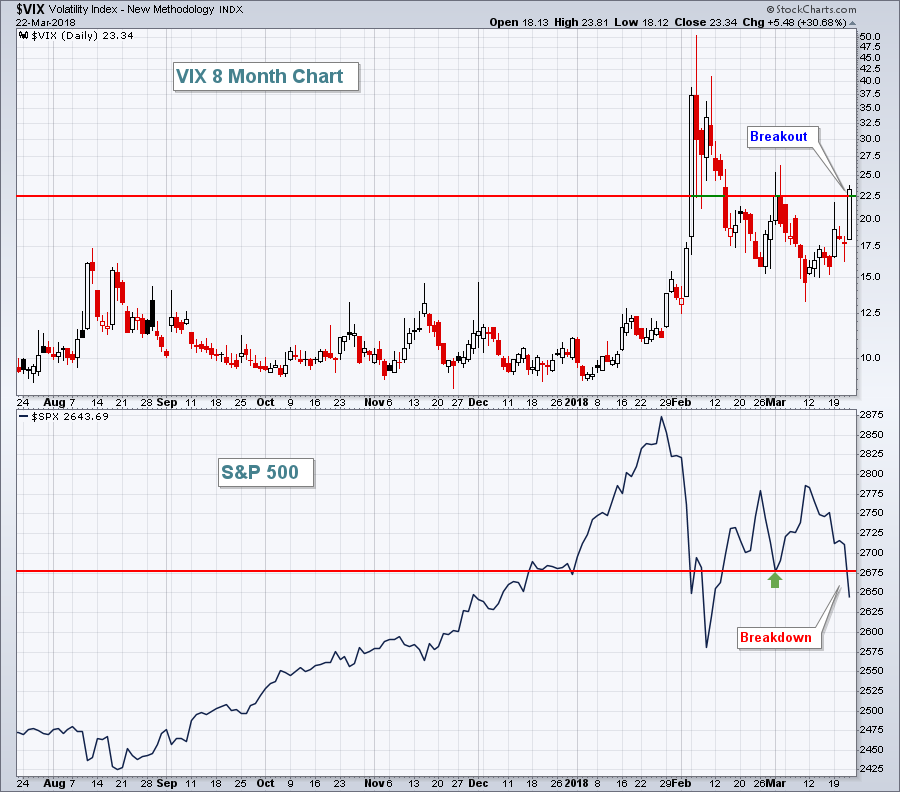 What we should look for is a long tail on the VIX to the upside. That would suggest a short-term top in the VIX with an S&P 500 rally coinciding with a move lower in the VIX.
I remain very bullish in the intermediate- to long-term, but grew quite bearish short-term based on the surge in the VIX Thursday.
Sector/Industry Watch
The 10 year treasury yield ($TNX) fell precipitously during the trading session on Thursday, testing key short-term yield support at 2.80% in the process, before climbing back to 2.84% at the close:
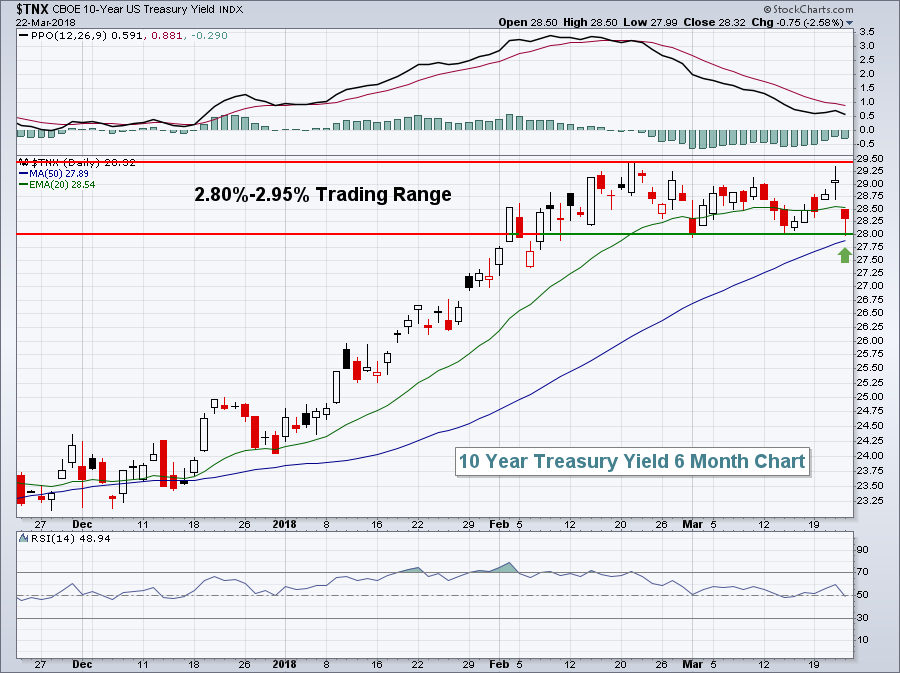 Lower treasury yields mean treasury buying as there's always an inverse relationship between the two. Treasury buying is defensive and underscores the rising fear that the VIX highlights. So a break below 2.80% above would add to the near-term caution in the U.S. stock market.
Historical Tendencies
The selling that has taken place since March 18th is not at all unusual. I've said and repeated many times that the worst time of the calendar month stretches from the 19th through the 25th (today is the 23rd, but the 24th and 25th fall on a Saturday and Sunday this month). It doesn't always go down from the 19th through the 25th, but we've seen significant bouts of selling occasionally during this period and March 2018 appears to yet another example.
Historically, here's how the S&P 500 performs during each calendar day (in all calendar months, not just March):
19th: -32.80% (worst day of calendar month for SPX)
20th: -5.62%
21st: +5.97%
22nd: -11.18%
23rd: -1.93%
24th: -0.67%
25th: -7.57%
These annualized returns date back to 1950, a very representative sample size in my view. Also, keep in mind that the S&P 500 has averaged gaining roughly 9% per year since 1950 so each of these daily annualized returns fall short of this 9% figure, many of them well below that 9% level.
Key Earnings Reports
None
Key Economic Reports
February durable goods released at 8:30am EST: +3.1% (actual) vs. +1.7% (estimate)
February durable goods ex-transports released at 8:30am EST: +1.2% (actual) vs. +0.6% (estimate)
February new home sales to be released at 10:00am EST: 620,000 (estimate)
Happy trading!
Tom
