We have seen just about everything we've needed to see to confirm this powerful secular bull market advance since the beginning of 2023. There was really only one thing missing and it's not missing any longer. I'll get to that in a minute.
But let's look at the most aggressive sector in the stock market and let's evaluate the growth vs. value trade that has characterized and driven a tremendous move higher in U.S. equities.
Technology (XLK):
Semiconductors ($DJUSSC) have been the lifeblood of technology's leadership and technology represents nearly 30% of the S&P 500 now - thanks in large part to the huge advance in technology shares. After a remarkable 200% advance in semiconductors over 15 months, we've seen the DJUSSC cool off a bit, which began with the bearish engulfing candle I pointed out one week ago:
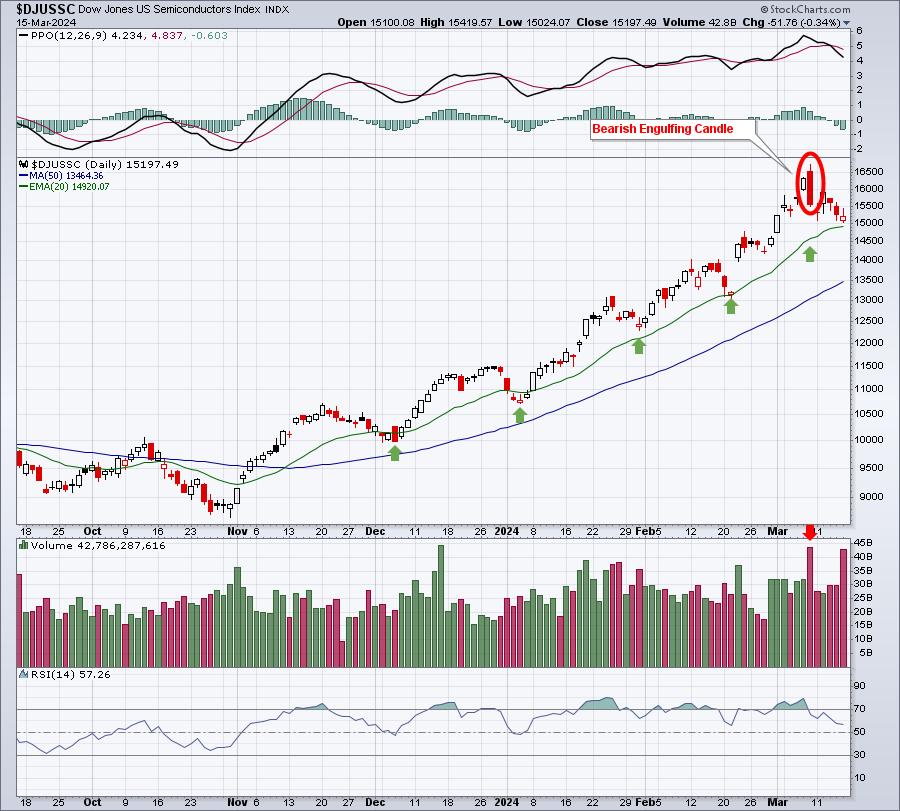
From the high on Friday, March 8th to the low on Friday, March 15th, the DJUSSC lost approximately 10%. That had an obvious impact on technology stocks in general, which lagged most sectors last week.
The very ugly bearish engulfing candle, together with the HUGE volume, is not to be ignored. It "could" represent a major top in this group for awhile, which isn't a bad thing. We shouldn't expect the DJUSSC to triple every 15 months, that's not sustainable. But if it pauses in the near-term, it's likely to have a significant effect as many of its component stocks are represented in both the S&P 500 ($SPX) and the NASDAQ 100 ($NDX). The group is much more heavily represented in the $NDX. Semiconductors represents nearly 22.86% and 9.76% of the $NDX and $SPX, respectively. While there's plenty of growth stocks in the S&P 500, the NASDAQ 100 is much more heavily impacted by growth stocks. That's why I like to follow the $NDX:$SPX ratio. It's a "growth vs. value" ratio that provides us one look at the risk environment that we're in. When the ratio goes up, we can typically conclude that the market environment is "risk on", which usually leads to higher stock prices. A falling ratio, however, can signal "risk off", which would mean more caution. Here's where we currently stand:
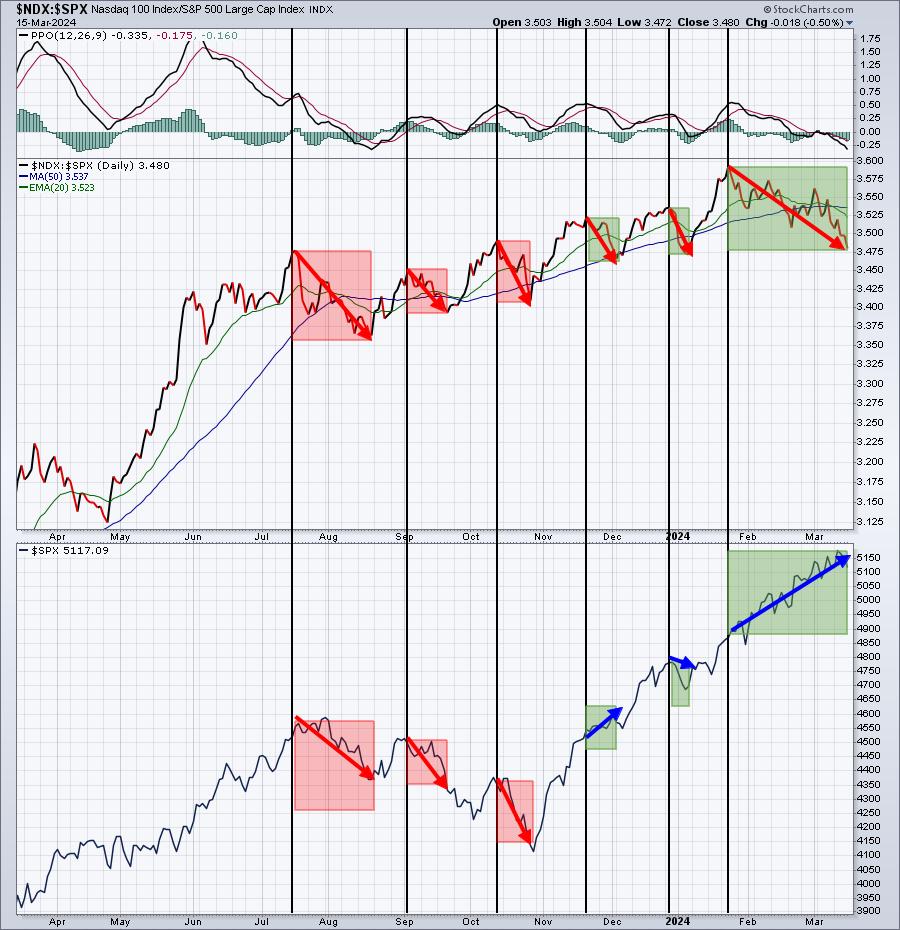
During the summer of 2023, the $NDX:$SPX ratio declined and this "risk off" signal resulted in a 10% correction as the benchmark S&P 500 followed suit to the downside. But look at the last 3 "risk off" readings in the $NDX:$SPX ratio. The S&P 500, for the most part, has kept gaining ground, especially over the past two months. What's changed?
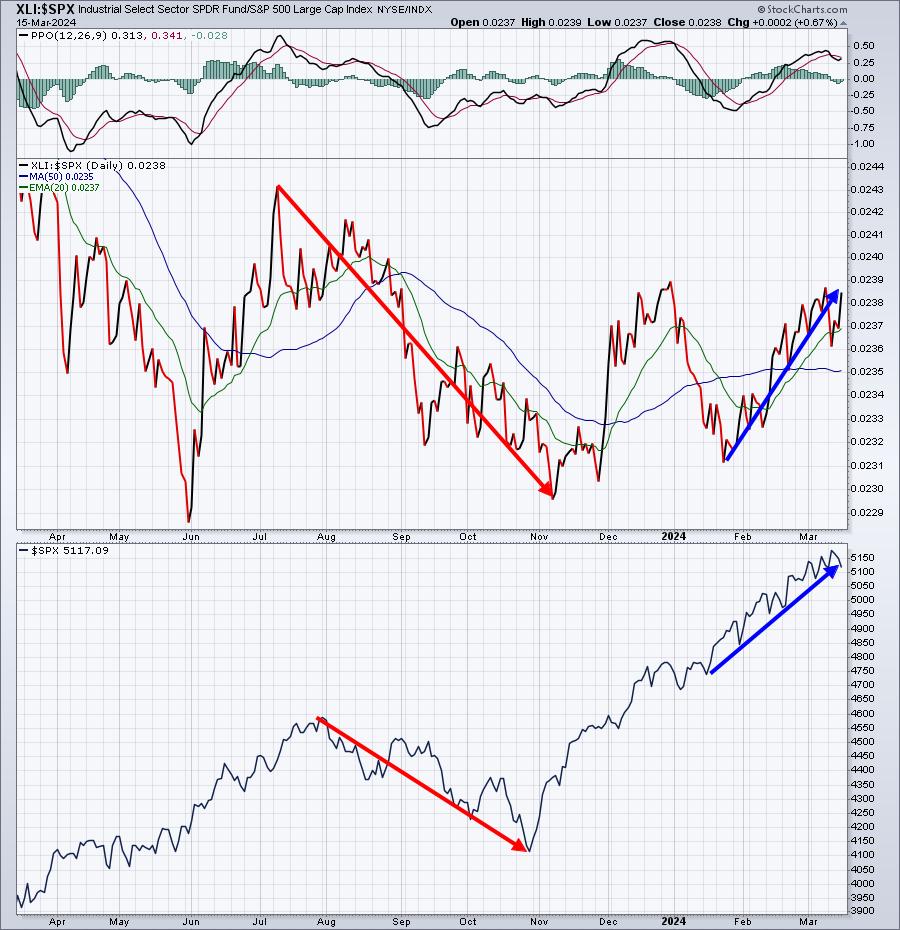
Well, thanks for asking, because this was the missing ingredient in the secular bull market in 2024. Let me show you what's changed. It's called BULLISH ROTATION:
XLI:$SPX
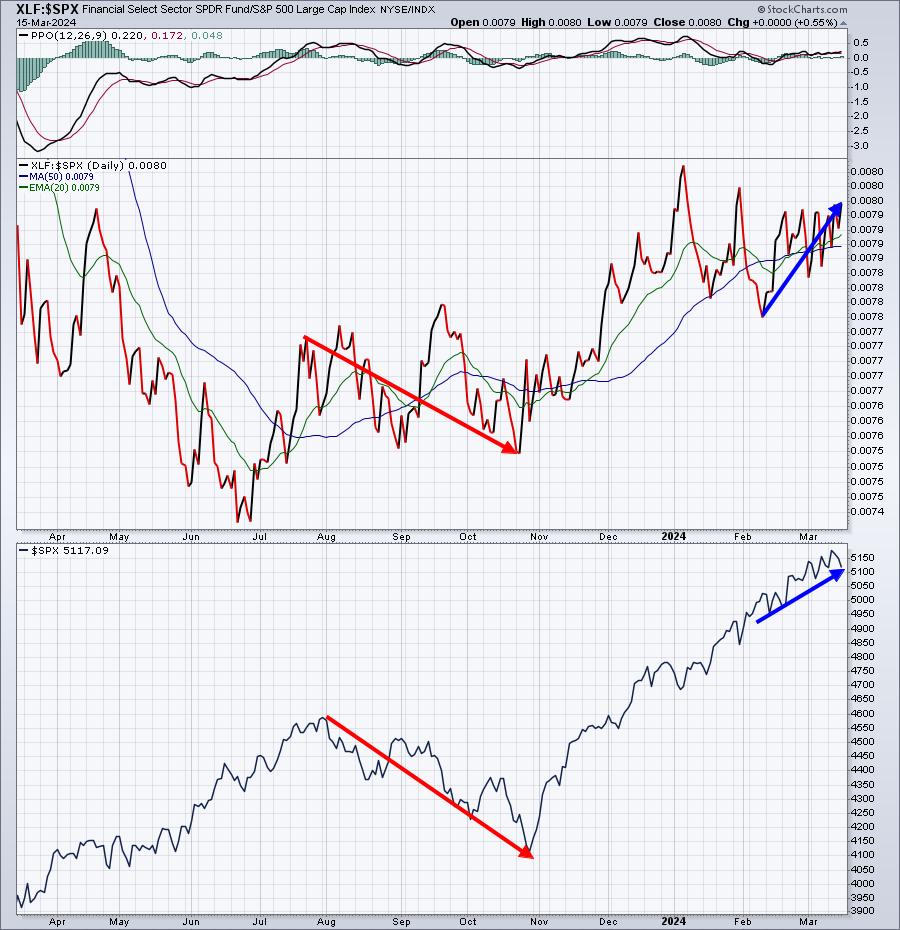
XLF:$SPX
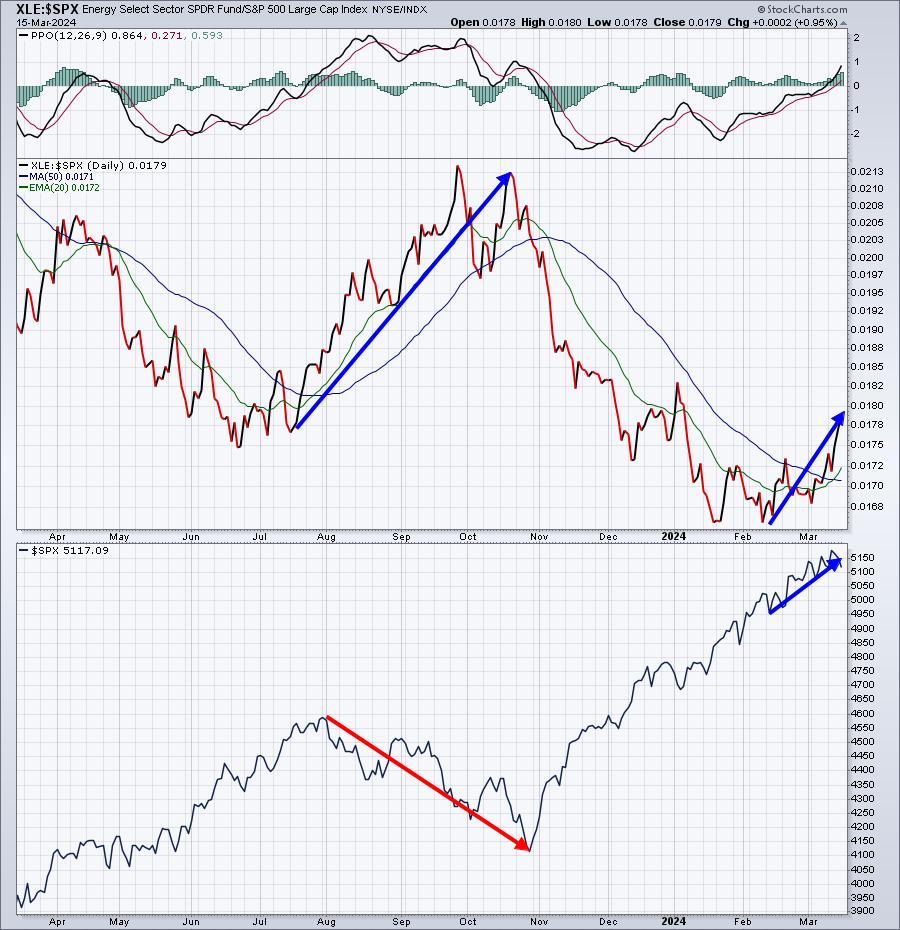
XLE:$SPX
XLB:$SPX
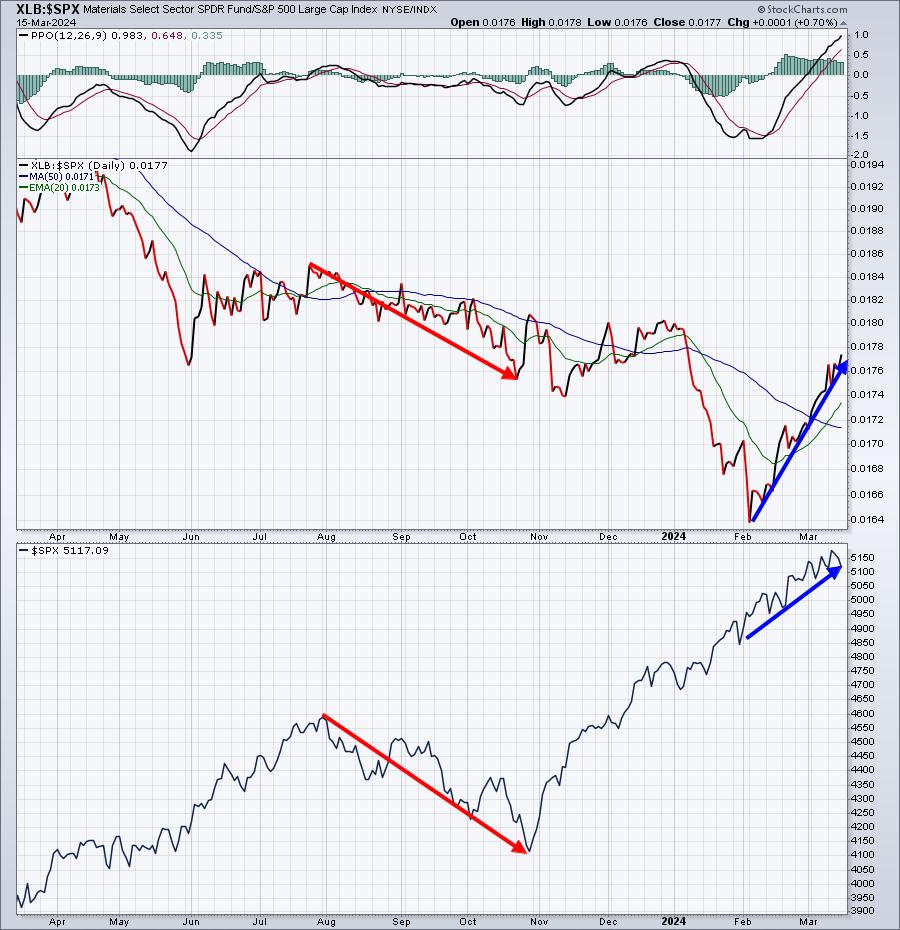
Over the summer months, when we turned "risk off", the proceeds from selling those aggressive sectors simply left the market, it didn't rotate to and create bullishness in other sectors in the market. You can see that by simply following all of those red directional lines for each of the 4 sectors shown above. This time is different and the above relative sector charts help us visualize the difference.
I believe technology will be fine in time, but a period of underperformance wouldn't be a bad thing at all. In fact, the rotation is creating tremendous opportunities in other areas of the market. You need to recognize this shift now, because it's increasing the likelihood that our current bull market run may only just be beginning.
In Monday morning's FREE EB Digest newsletter article, I'll be featuring a company (outside the technology sector) that recently broke out and looks poised for significantly higher price down the road as money has been pouring into its sector. You can CLICK HERE to sign up for this FREE newsletter with your name and email address. There's no credit card required and you may unsubscribe at any time.
Take advantage of this rotation!
Happy trading!
Tom
