-- Financial stocks showing relative weakness
-- Stocks trading near resistance and overbought
-- Bullish considerations
With a bounce last week, the Nasdaq 100 ETF (QQQQ) moved above its mid April high and the S&P 500 ETF (SPY) challenged its mid April high. However, some key financial stocks failed to bounce and showed relative weakness last week. Media reports early Tuesday indicate that financial regulators are pressuring Citigroup and Bank of America to raise more capital. Judging from the charts, it appears that the bears started positioning last Monday (20-April).
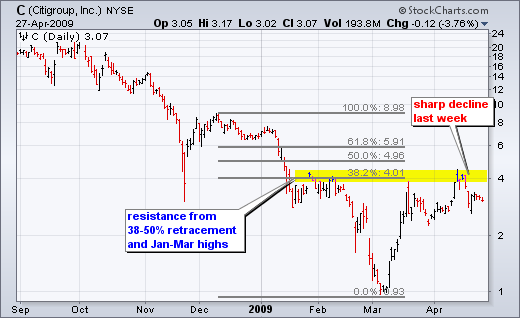
Citigroup (C) is backing off resistance around 4. This resistance zone stems from the 38-50% retracement zone and the January-March highs. After meeting resistance for the third time, Citigroup plunged below 3 last week and then stalled the last five days. With this stall, the stock did not partake in last week's market bounce and shows relative weakness, which could weigh on the stock and the financial sector.
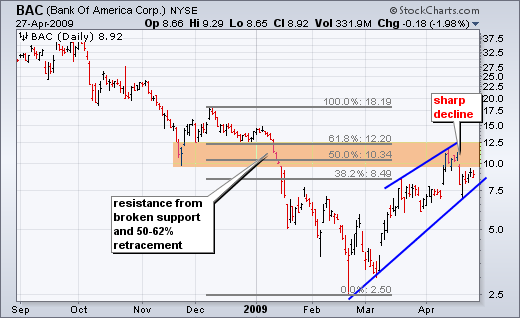
Bank of America (BAC) is backing off resistance around 12. Resistance in this zone stems from the 50-62% retracement and broken supports (Nov-Dec). After hitting the resistance zone in mid April, BAC declined sharply last week and then stalled just below 10 the last five days. A break below the wedge trendline would signal a continuation lower that would foreshadow a test of the March low.
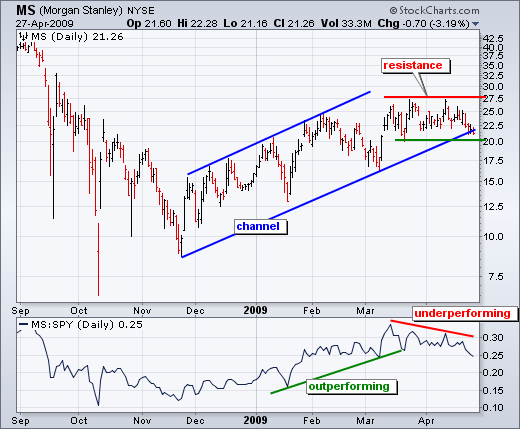
Morgan Stanley (MS) starts underperforming the broader market. First, notice that the stock met resistance around 27.5 in late March and again in mid April. In contrast, SPY recorded a new reaction high in mid April. The inability to break the March high shows relative weakness in Morgan Stanley. This is confirmed with the price relative in the indicator window. On the price chart, MS formed a rising channel with support around 20. A break below channel support would argue for a retracement of the November-March advance.
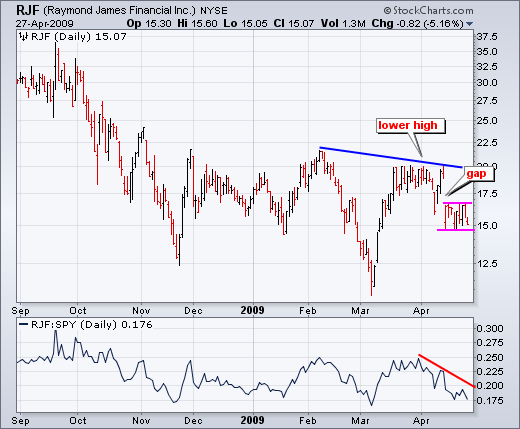
Raymond James Financial (RJF) shows relative weakness with a lower high and large gap down. While the market advanced from mid March to mid April, RJF stalled at resistance around 20 and then moved sharply lower with a gap. The stock formed a flat consolidation to digest this big loss and a break below consolidation support would signal a continuation lower.


