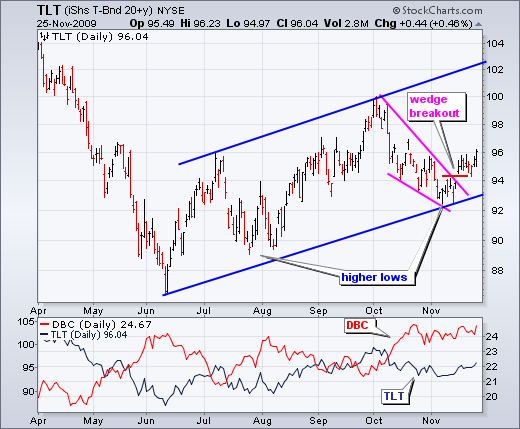
The 20+ Year Treasury ETF (TLT) continues to exhibit strength with a wedge breakout. Notice that the ETF broke resistance with a gap above 94. More importantly, notice that this gap is holding and TLT moved higher the last two days. With higher lows in July and November, the bigger trend is also up. A move towards the upper channel trendline would project further strength to around 102-103. Needless to say, such an advance in bonds would mean a decline in long-term rates.

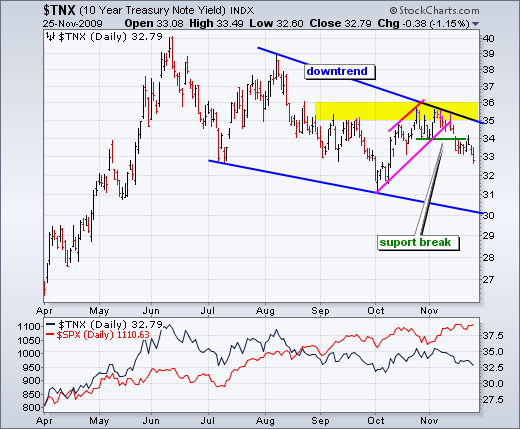
The downside break in the 10-Year Treasury Yield ($TNX) confirms the upside breakout in TLT. TNX peaked in June and then formed lower highs in August and late October. This means the bigger trend for long-term rates is down (blue trendlines). Most recently, TNX broke support at 34 (3.4%) to signal a continuation of this downtrend. As noted in the commentary above, falling rates are negative for stocks.

About the author:
Arthur Hill, CMT, is the Chief Technical Strategist at TrendInvestorPro.com. Focusing predominantly on US equities and ETFs, his systematic approach of identifying trend, finding signals within the trend, and setting key price levels has made him an esteemed market technician. Arthur has written articles for numerous financial publications including Barrons and Stocks & Commodities Magazine. In addition to his Chartered Market Technician (CMT) designation, he holds an MBA from the Cass Business School at City University in London.
Learn More
