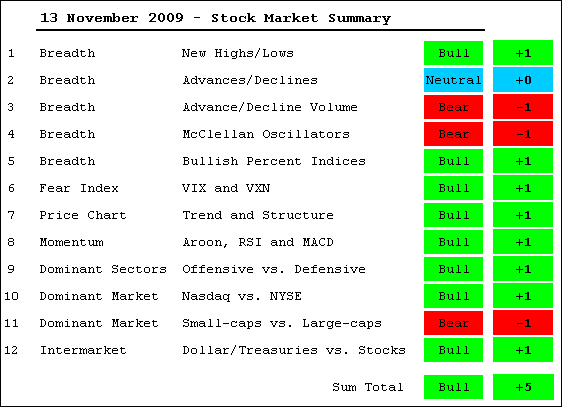
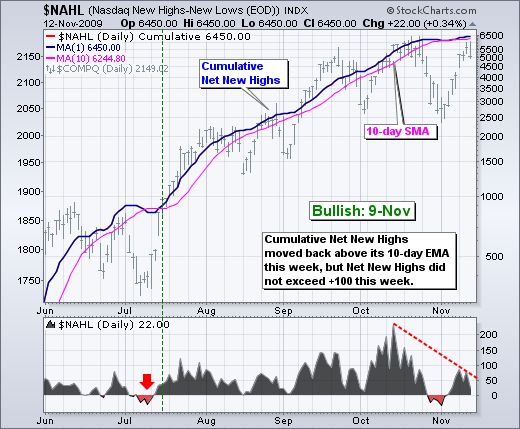
Net New Highs: Bullish. The Cumulative Net New Highs line for both the Nasdaq and the NYSE remains above its 10-day SMA (rising). However, daily Net New Highs for the Nasdaq and NYSE decreased significantly from October to November. This decrease occurred as both the Nasdaq and NY Composite surged to their October highs. Daily Net New Highs are around half the levels that were seen in October. This means fewer stocks participated in the November advance. The indicator would turn medium-term bearish if the cumulative Net New Highs line moves below its 10-day EMA and daily Net New Highs turn negative.
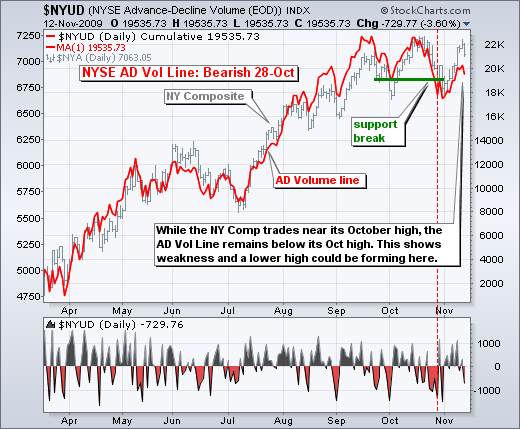
AD Volume Lines: Bearish. The AD Volume Lines for the Nasdaq and NYSE both broke below their October lows to reverse the uptrend. Both bounced over the last two weeks, but remain well below their October highs. Meanwhile, the Nasdaq and the NY Composite are trading near their October highs. The AD Volume Lines are not keeping up as a lower high could be forming.
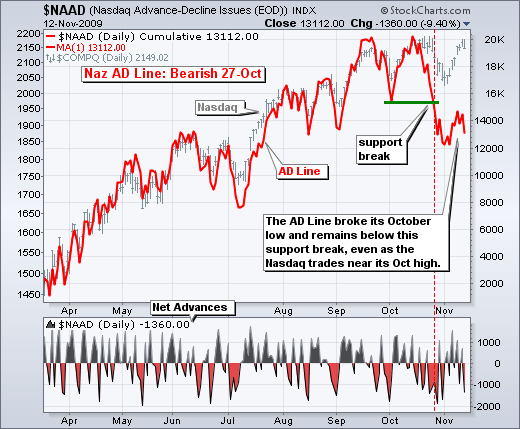
AD Lines: Neutral. The NYSE AD Line held its October low and remains in an uptrend, even though it has traded flat since mid September. Conversely, the Nasdaq AD Line broke below its October low and this break is holding. Even though the Nasdaq is trading near its October high, its AD Line is trading below its October low and showing weakness.
McClellan Oscillators: Bearish. Both McClellan Oscillators have been in bear mode since early October when they plunged below -50. Keep in mind that the McClellan Oscillator is an indicator of an indicator. It is a momentum oscillator of Net Advances. As such, it works like MACD or RSI. Weakness in the McClellan Oscillator shows waning upside momentum in Net Advances for the NYSE and Nasdaq.
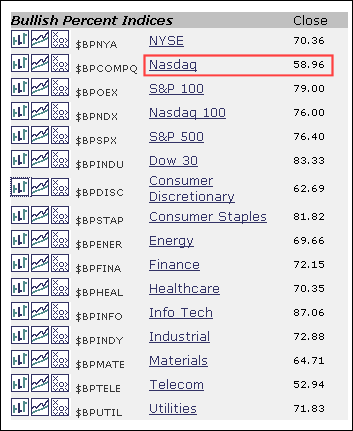
Bullish Percent Indices: Bullish. All bullish percent indices remain above 50%. This means that over 50% of the components for each index are on Point & Figure buy signals. Excluding telecom, the Nasdaq is the weakest with 59% of stocks on Point & Figure buy signals. Among the nine sector SPDRs, energy and materials are the weakest, but both are still above 50%.
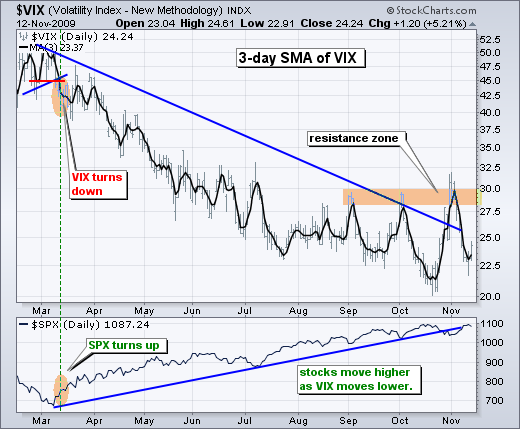
Fear Index: Bullish. With the November advance in stocks, the S&P 500 Volatility Index ($VIX) and Nasdaq 100 Volatility Index ($VXN) plunged back towards their October lows and remain in downtrends. Both have yet to break their October lows and it is possible that a higher low is forming. In fact, an inverse head-and-shoulders could even be forming from September to November. A break back above the resistance zone would be bullish for the VIX (fear) and bearish for stocks.
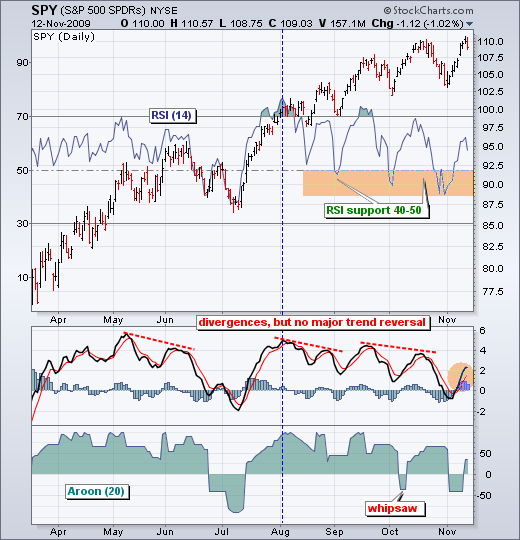
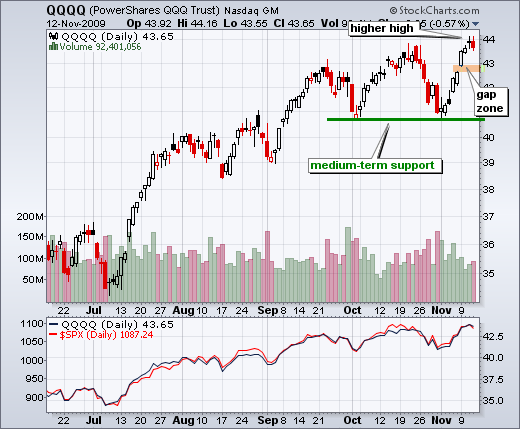
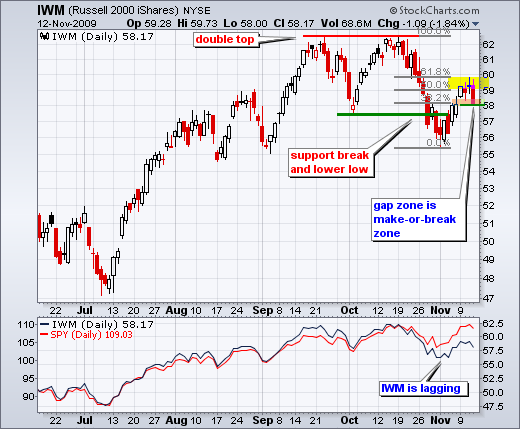
Trend/Structure: Bullish. The Dow Diamonds (DIA), S&P 500 ETF (SPY) and Nasdaq 100 ETF (QQQQ) all recorded new reaction highs this week. This affirms the medium-term uptrends and support from the November lows. The Russell 2000 ETF (IWM) remains the laggard as it trades well below its October low. While I am concerned with relative weakness in this small-cap ETF, I must go with the majority here. Three of the four remain in uptrends.
Momentum: Bullish. Momentum peaked in August, but remains bullish overall. The blue line marks the highs for RSI and MACD in August. Aroon hit its maximum (100) shortly thereafter. Even though momentum is not as strong, it is still bullish overall. RSI is holding the 40-50 zone. MACD spend just a few days in negative territory and recovered. Aroon held above -50 and moved back into positive territory this week.
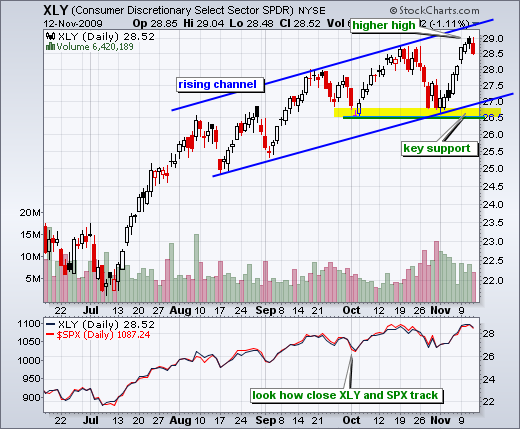
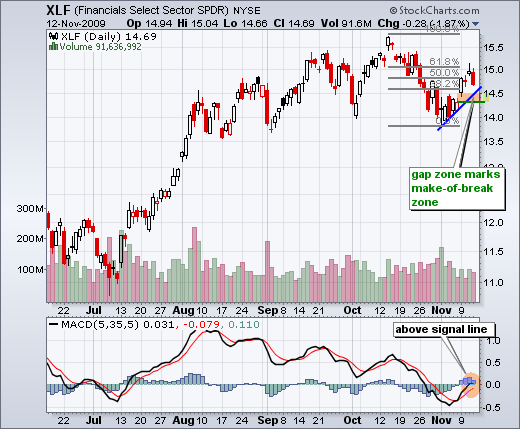
Offensive Sectors: Bullish. The Consumer Discretionary SPDR (XLY), Industrials SPDR (XLI) and Technology SPDR (XLK) all recorded higher highs this week. The Financials SPDR (XLF) remains below its October high and is the laggard. As with small-caps, I will adhere to majority rule here. Three of the four are strong and this is bullish overall. As with IWM, I will be watching Monday's gap zone for a short-term break down in XLF.
Nasdaq vs. NYSE: Neutral. I am turning neutral on this indicator because the Nasdaq is keeping pace with the NY Composite over the last few months. The Naz has not been outperforming, but neither is it underperforming.
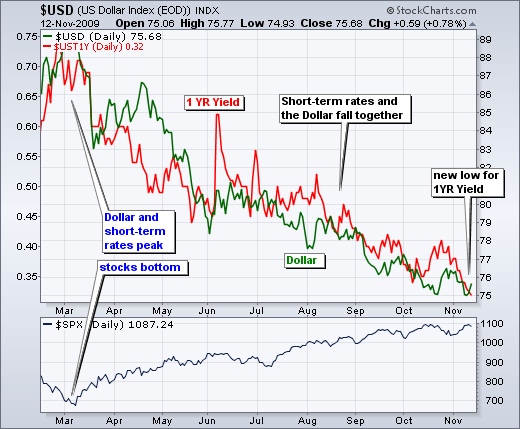
Intermarket: Bullish. Short-term rates moved to a new low this week and the US Dollar Index ($USD) is testing its October low. There is clearly a positive correlation between the 1-Year Treasury Yield ($UST1Y) and the US Dollar Index. In addition, there is a negative correlation between the Dollar and stocks. As long as these correlations hold, a weak Dollar and lower short-term rates are bullish for stocks.
*****************************************************************

