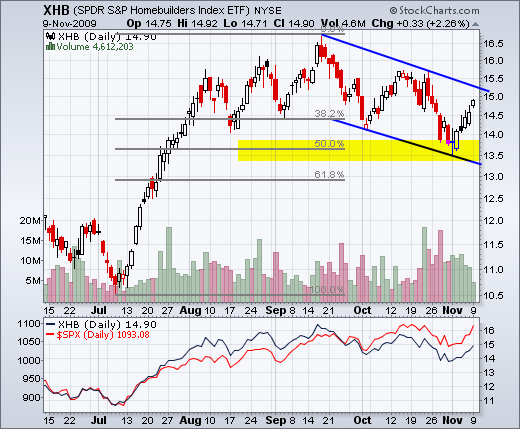
The homebuilders have been relatively weak since mid September. While SPY is within striking distance of a new high for the year (2009), the Homebuilders SPDR (XHB) remains well below its September and October highs. Since mid September, the ETF retraced 50% of its prior advance with an ABC decline. Elliott Wavers would view this as a bullish setup. In other words, the decline represents a correction after a strong advance (July-Sept). The bounce off the 50% retracement looks impressive with good volume. A channel breakout would argue for a continuation of the prior advance and target a move above the September high.
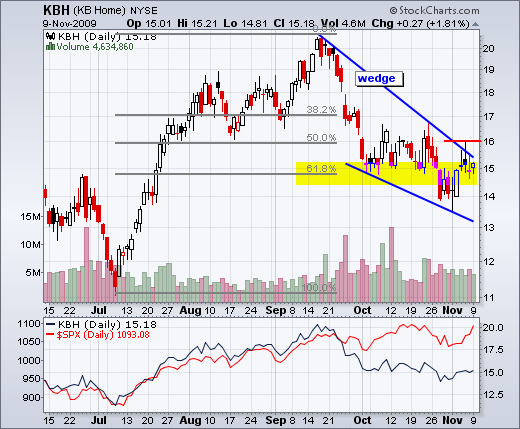
After a big advance from July to September, KB Home (KBH) retraced over 62% with the Sep-Oct decline. Despite this overshoot, the stock rebounded last week and has been consolidating around the 62% retracement (~15) since early October. A falling wedge formed with the decline and I am marking resistance at 16. After last week's spinning top and long white candlestick, the stock has traded flat around 15-16 the last four days. Look for a break above this area to signal a continuation higher.


