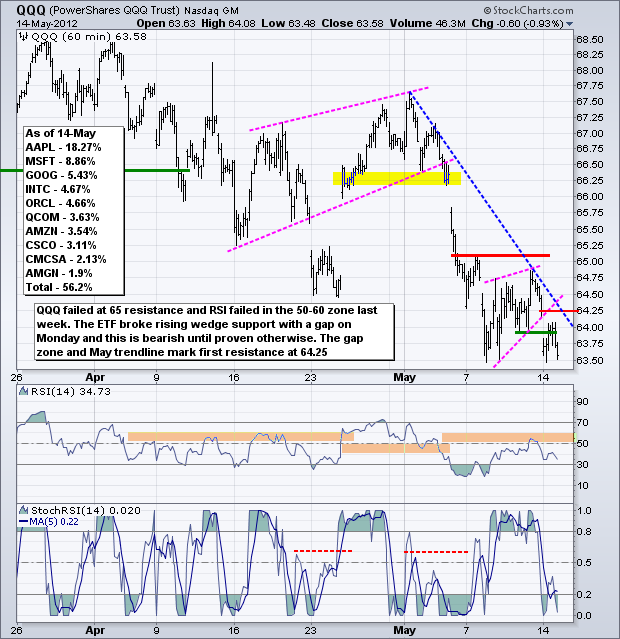
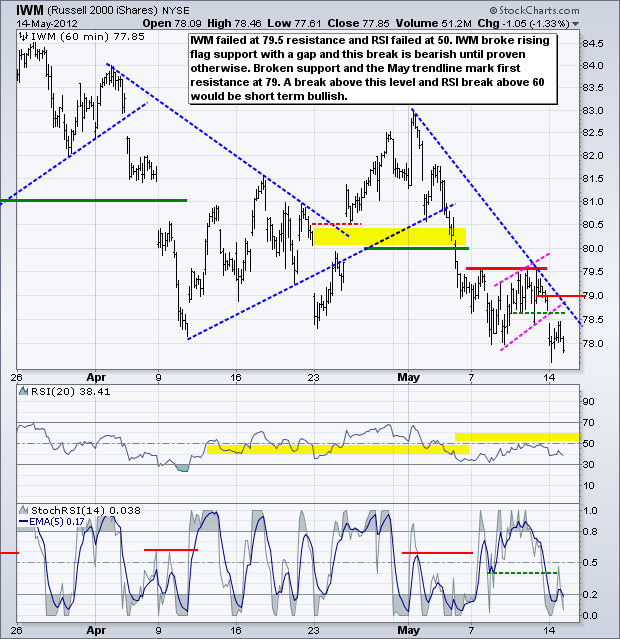
The risk-off trade was in full force on Monday: treasuries and the Dollar moved higher as stocks, oil and the Euro moved lower. Stocks opened weak, bounced a little and then closed weak as buyers lost their nerve. The major index ETFs remain in short-term downtrends, but are getting oversold and short-term bottom pickers are circling the wagons on this turnaround Tuesday. Treasuries continue to benefit from a flight from risk. Oil is getting hit by weakness in stocks and the prospects for weaker economic growth. Gold continues to be weighed down by weakness in stocks and strength in the Dollar. Greece and the Euro are getting most of the blame for weakness in May. Talk of a Greek exit from the Euro is starting to punctuate diplomatic circles, although you will never here EU officials actually say it. Jean Claude Juncker, President of EuroGroup, which has "political control" over the Euro, stated that there is an "unshakable desire" to keep Greece in the European monetary union (EMU). However strong the commitment, I expect the Euro-Greek situation to remain uncertain (at best) for the foreseeable future. Greece has yet to form a new government and it looks like new elections will be called for in June, which only exasperates the situation.
The US cannot blame Greece and the Euro exclusively though. A batch of weaker-than-expected economic reports hit the market in early May, Cisco provided disappointing guidance last week and JP Morgan Chase disclosed a $2 billion trading loss, which could grow. Also note that the six month cycle just turned bearish for US stocks (go away in May). With the S&P 500 only 5.6 percent from its March high, we could be in for a longer corrective period or at least an extended period of high volatility, such as August-September 2011. Ugh. In any case, the US economy remains the key driver for US stocks and retail sales will be reported today. A miss on this number would prevent a classic turnaround Tuesday today.
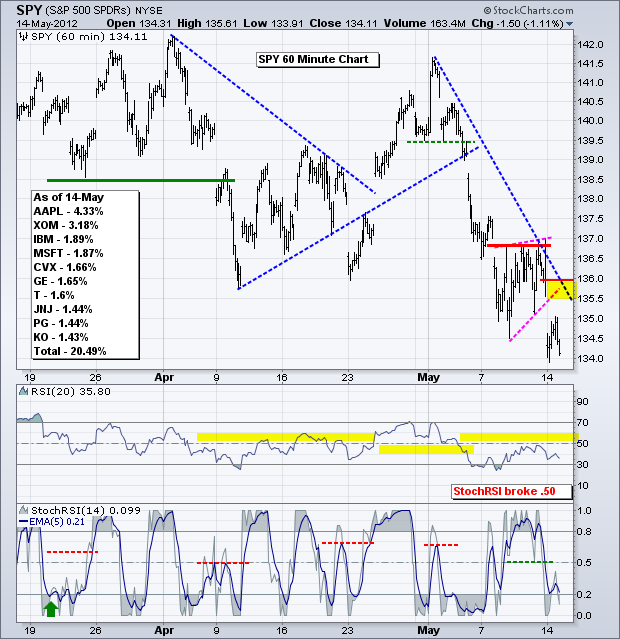
On the S&P 500 ETF (SPY) chart, the ETF failed at resistance around 136.9 and RSI failed at the 50 level. A rising wedge formed and SPY broke wedge support with a gap down on Monday. This gap and break are holding, and remain bearish until proven otherwise. The May trendline and gap zone mark first resistance at 136. A move above this level would provide the first signs of a trend reversal. While a break above this level would be positive for stocks, I would be careful playing such a breakout because we have seen a lot of technical damage in May. More over, the market could be whipped back and forth by the news flow over the next few days.
**************************************************************************
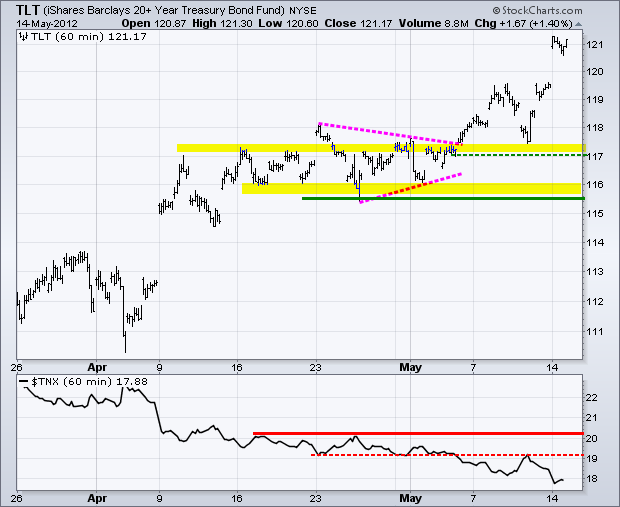
The 20+ Year T-Bond ETF (TLT) surged above 120 and closed above 121 as money moved into relative safety. TLT is getting quite overbought, but remains in a strong uptrend. Broken resistance in the 117-117.5 area turns into the first support zone to watch. Key support remains at 115.5-116 for now.
**************************************************************************
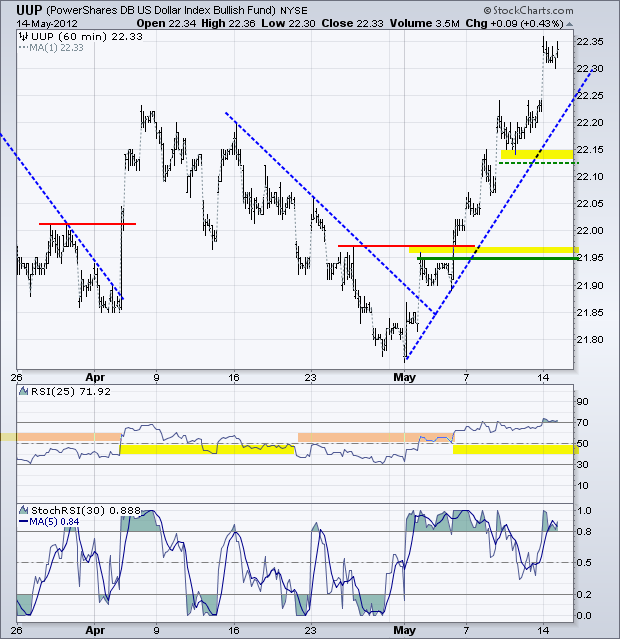
The US Dollar Fund (UUP) extended its short-term uptrend with a break above the April high. While the 10 day advance is not that impressive on in percentage terms (2.41%), it is impressive in momentum terms. Note that 25-period RSI on the 60-minute chart moved to its highest level since December 2011. I view overbought readings as a sign of strength because they represent a buying thrust of sorts. Overall, UUP is nearing potential resistance from the May high and short-term overbought.
**************************************************************************
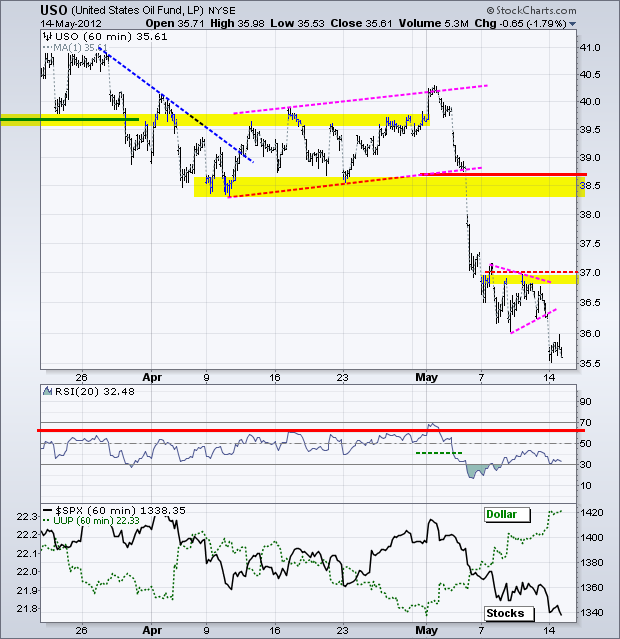
Oil is as oversold as treasuries are overbought. Moreover, note that these two are negatively correlated, as our stocks and treasuries. A pullback in treasuries would likely lead to a bounce in stocks and oil. However, like stocks, this bounce would be deemed an oversold bounce for now. The US Oil Fund (USO) broke pennant support on Monday and this pennant zone marks a resistance zone.
**************************************************************************
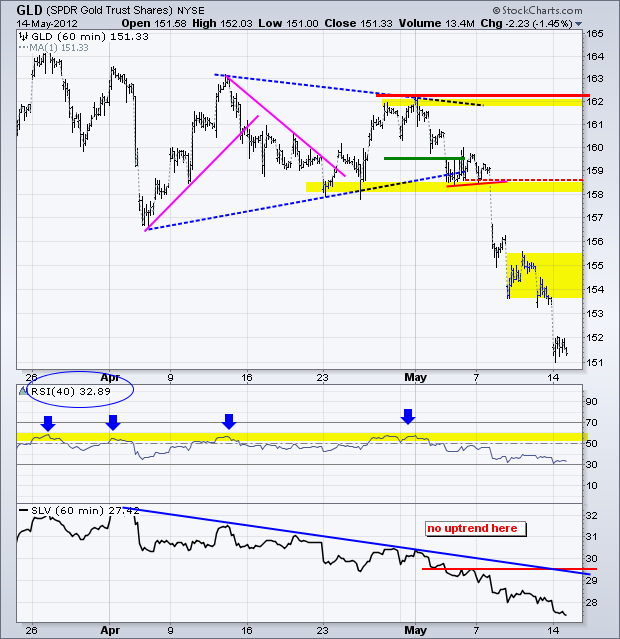
The Gold SPDR (GLD) is very oversold, but just becomes more oversold, which happens in a strong downtrend. GLD is now down some 6% this month and ripe for an oversold bounce. However, GLD remains a falling knife and catching this knife is risky, to say the least. Should GLD bounce, I would mark the first resistance zone around 154-155.
**************************************************************************
Key Economic Reports:
Tue - May 15 - 08:30 - Retail Sales
Tue - May 15 - 08:30 – Consumer Price Index (CPI)
Tue - May 15 - 08:30 - Empire State Manufacturing Index
Tue - May 15 - 10:00 - Business Inventories
Tue - May 15 - 10:00 - NAHB Housing Market Index
Wed - May 16 - 07:00 - MBA Mortgage
Wed - May 16 - 08:30 - Housing Starts/Building Permits
Wed - May 16 - 09:15 - Industrial Production
Wed - May 16 - 10:30 - Oil Inventories
Wed - May 16 - 14:00 - FOMC Minutes
Thu - May 17 - 08:30 – Jobless Claims
Thu - May 17 - 10:00 - Philadelphia Fed
Thu - May 17 - 10:00 - Leading Indicators
Fri - May 18 - 10:00 - TGIF
Charts of Interest: Tuesday and Thursday in separate post.
This commentary and charts-of-interest are designed to stimulate thinking. This analysis is not a recommendation to buy, sell, hold or sell short any security (stock ETF or otherwise). We all need to think for ourselves when it comes to trading our own accounts. First, it is the only way to really learn. Second, we are the only ones responsible for our decisions. Think of these charts as food for further analysis. Before making a trade, it is important to have a plan. Plan the trade and trade the plan. Among other things, this includes setting a trigger level, a target area and a stop-loss level. It is also important to plan for three possible price movements: advance, decline or sideways. Have a plan for all three scenarios BEFORE making the trade. Consider possible holding times. And finally, look at overall market conditions and sector/industry performance.
