 3 years, 3 months and 29 days.
That's how long I've been waiting to write this article. Seriously – I took the time to go back through my notes and calendars to confirm it, right down to the day.
Now I know many of you have been following our progress on StockChartsACP quite closely, exploring each and every demo that we've released over the past 15 months. In reality though, the history goes back quite a lot further than just the past year, all the way to the first brainstorm sessions and original planning meetings. That's where we started to ask the question, "What would it look like if we built an entirely new, interactive financial charting platform with tons of advanced capabilities, customizations and new integrations all based on the latest web technologies that we have at our disposal?"
Well, my friends, it gives me no shortage of joy to finally say...
StockChartsACP v1.0 is HERE!
If you're just tuning in, StockChartsACP is our new interactive, full-screen, real-time streaming Advanced Charting Platform. Designed to bring you a dynamic, ultra-flexible, all-in-one charting package, it's the next generation of StockCharts technology and arguably our biggest new feature since the launch of the original SharpCharts tool.
As you may remember, we released an early demo of ACP last April to celebrate our 20th anniversary. Since then, we've been putting out small updates and improvements every Friday. Rather than keep the entire development cycle under wraps, we purposefully decided to bring you all into the process, give you a chance to see our work evolve and let the feedback of our StockCharts community help shape the direction of ACP. We've continued to enhance and expand ACP every step of the way, all leading up to this week's official version 1.0 release.
So, now that you've got the background, let me fill you in on some of the most crucial features included in the latest version of StockChartsACP:
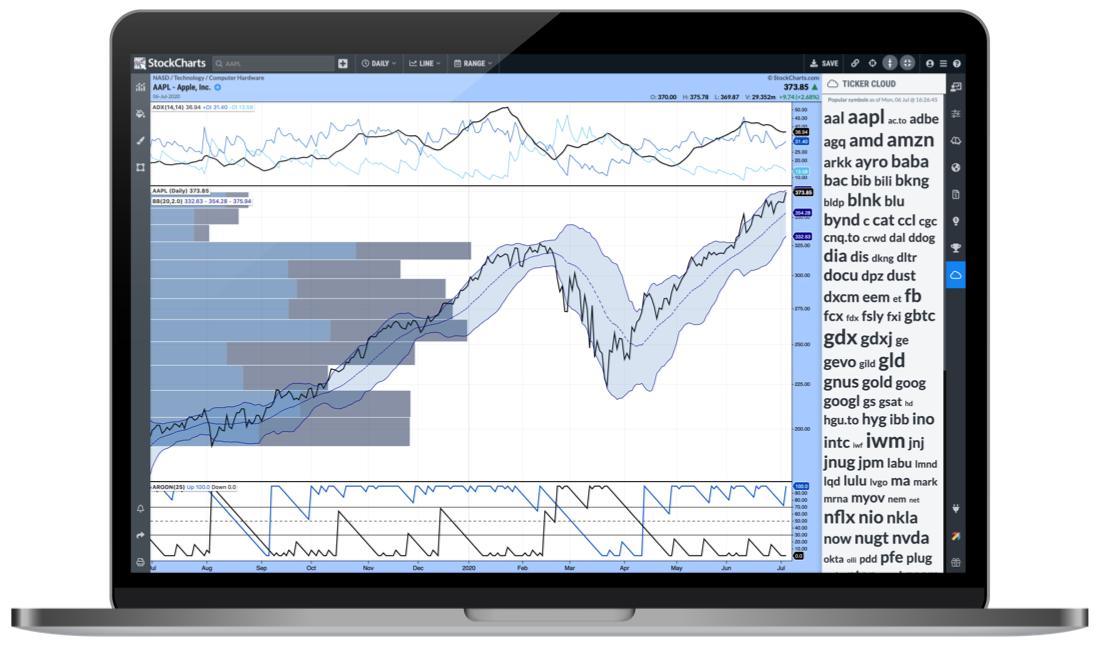
Big, beautiful, full-screen charting with dynamic controls and an interactive experience
With StockChartsACP, we've taken our award-winning approach to charting and cranked it up to 11. True full-screen charting is now at your fingertips, with an interactive experience that allows you to scroll through time on your charts like never before.
The charts you see in ACP are truly dynamic. The platform gives you the ability to scroll back and forth through time, drag indicators and overlays up, down and around your chart, manipulate the y-axis with your cursor and much more. In this sense, they are quite different from the more "static" SharpCharts that we've always had. It's almost as if you can reach out and grab the charts with your hand!
Allowing you to maximize all of the screen real estate you have available to you, ACP features stunning visualizations, dozens of indicators, overlays, and chart types, advanced customizations and powerful integrations directly in the charting platform.
In short, it's the web's most advanced, interactive technical charting platform out there.
Save your charts and organize them with ACP ChartLists
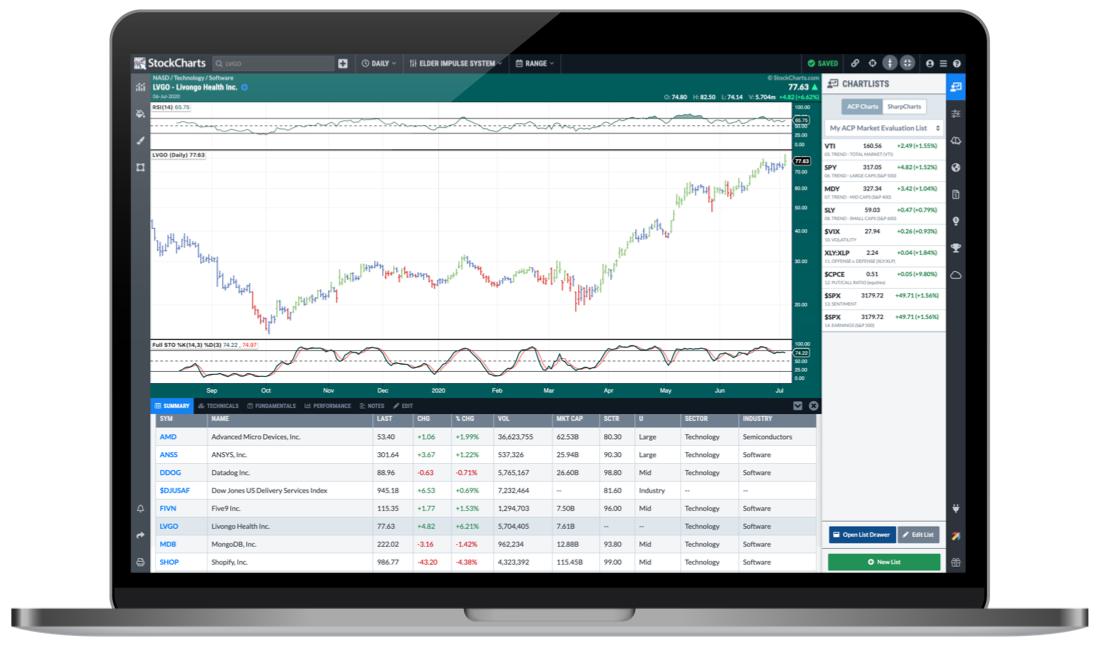 With this release, you now have the ability to save your ACP charts and organize them in your own ChartLists.
Multiple viewing methods (and more on the way!) give you plenty of options for analyzing your ChartLists in ACP. You can view your lists in the righthand sidebar and click on each symbol to quickly pull up your saved charts, or open the "List Drawer" to access more advanced summary data, list notes, and full editing features.
We've also built in the option to view ACP versions of your existing saved SharpCharts. Open the ChartLists sidebar and click the "SharpCharts" tab to see your current ChartLists. You can then click on each symbol to see an ACP chart that will very closely match the saved SharpChart. This is a great way to explore the new world of ACP, or quickly get set up with some of your favorite indicators and other chart settings.
Save your favorite indicators, overlays and chart settings as custom ChartStyles
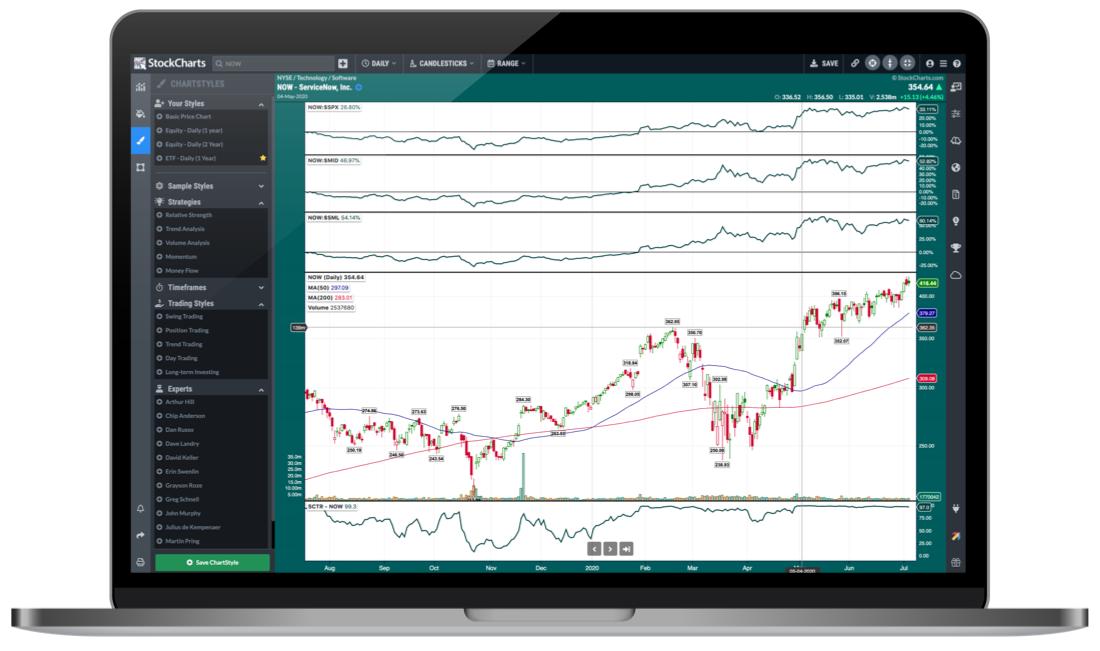 In addition to saving your charts with ChartLists, the latest version of ACP also gives you the ability to save your favorite indicators, overlays, chart layouts and other settings as ChartStyles.
Just like the saved ChartStyles you've used in SharpCharts, this feature of ACP means that you can preserve your favorite chart settings for future use. You never have to repeat your work or waste time setting up your charts from scratch every time you want to see what's happening in the markets. With ChartStyles, you can streamline your workflow in ACP and optimize your charting experience by saving the indicators, overlays and settings you prefer.
You can also check out our predefined ChartStyles, which are carefully-crafted chart layouts we've put together for you. Open the ChartStyles menu on the lefthand side of ACP, and you can browse different pre-created ChartStyles for "Strategies" (like trend analysis or momentum), "Timeframes" (like daily or monthly), "Trading Styles" (like swing trading or day trading), and "Expert Styles" from your favorite technicians like John Murphy, Martin Pring, David Keller, Tom Bowley and others.
Customizable multi-chart layouts to enhance your view of the markets
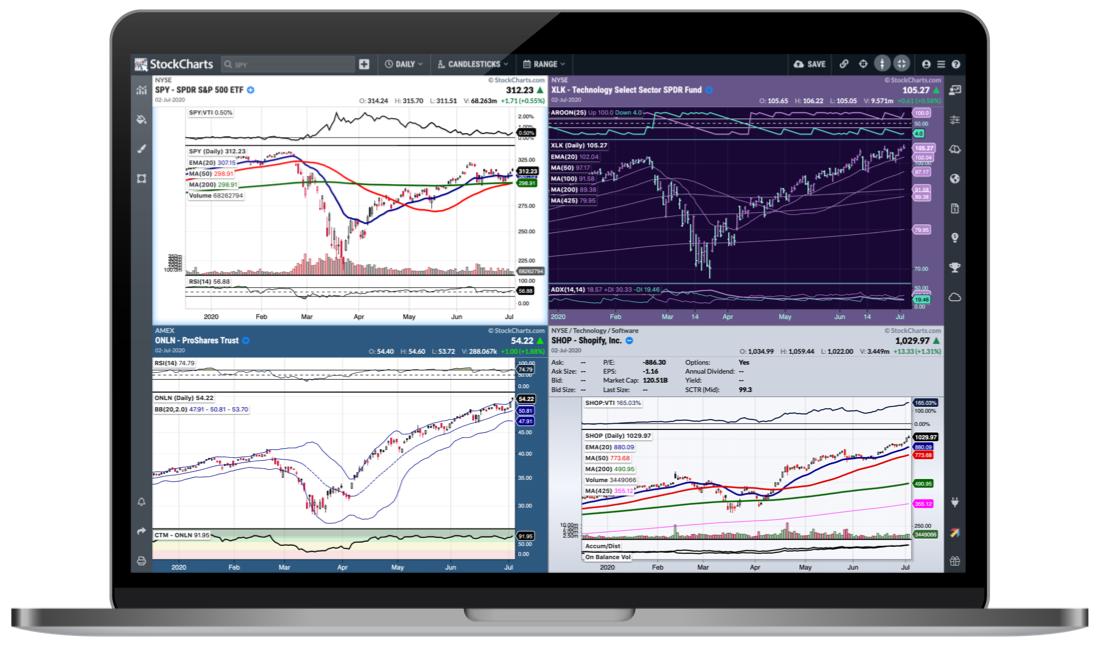 With the ability to create multi-chart layouts at the click of a button (the "plus" icon at the top left), StockChartsACP gives you the power and flexibility to see the markets exactly how you want. Load up charts for all the major indexes on one view, or put multiple symbols from your portfolio together on a single screen.
And if you really want to feel the power, here's one of my favorite features.
In the platform settings menu (the row of icons next to the "Save" button at the top right), look for the chainlink icon. Click that to turn on "Sync Mode", then load up charts of the same symbol in multiple timeframes. For example, I like to do one intraday chart, one daily, one weekly and even a monthly chart. When you enter a new symbol with "Sync Mode" turned on, we'll automatically update all the charts on the screen that use the same ticker.
So if you try out my trick here with the four timeframes and make sure all four charts are set to the same symbol, you can quickly and easily swap out a new ticker for all those charts in one motion. Maybe you want to flip through the FAANG names, for example. Well, all you've got to do is turn on "Sync Mode" and boom – you're charting in multiple timeframes with an easy way to work through the list.
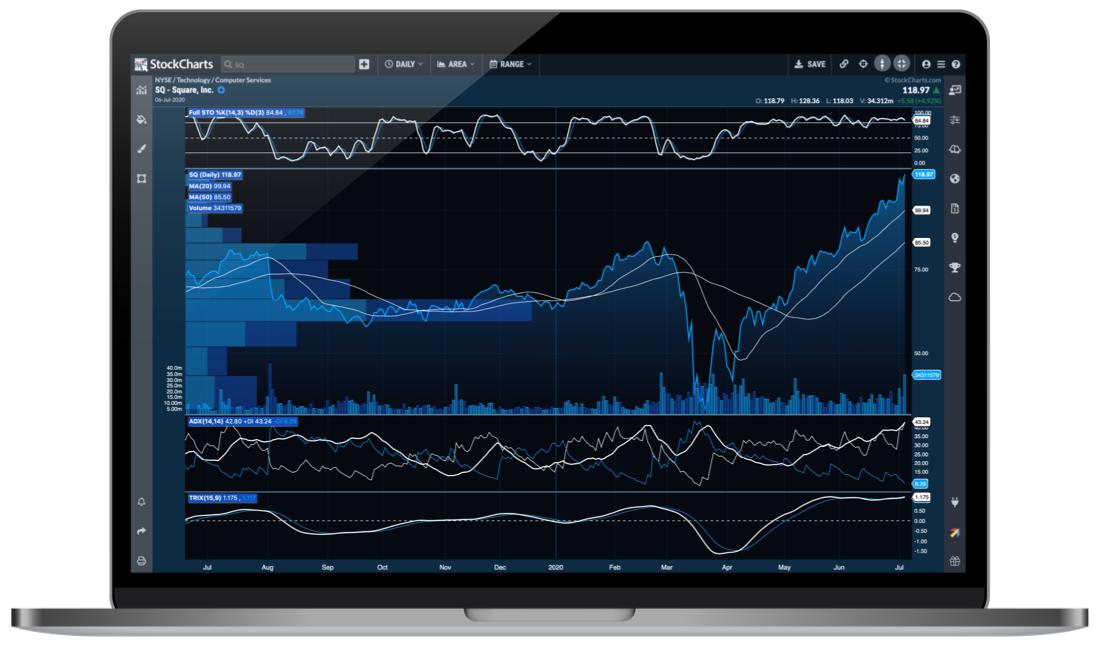
Striking, unique color schemes to electrify your analysis
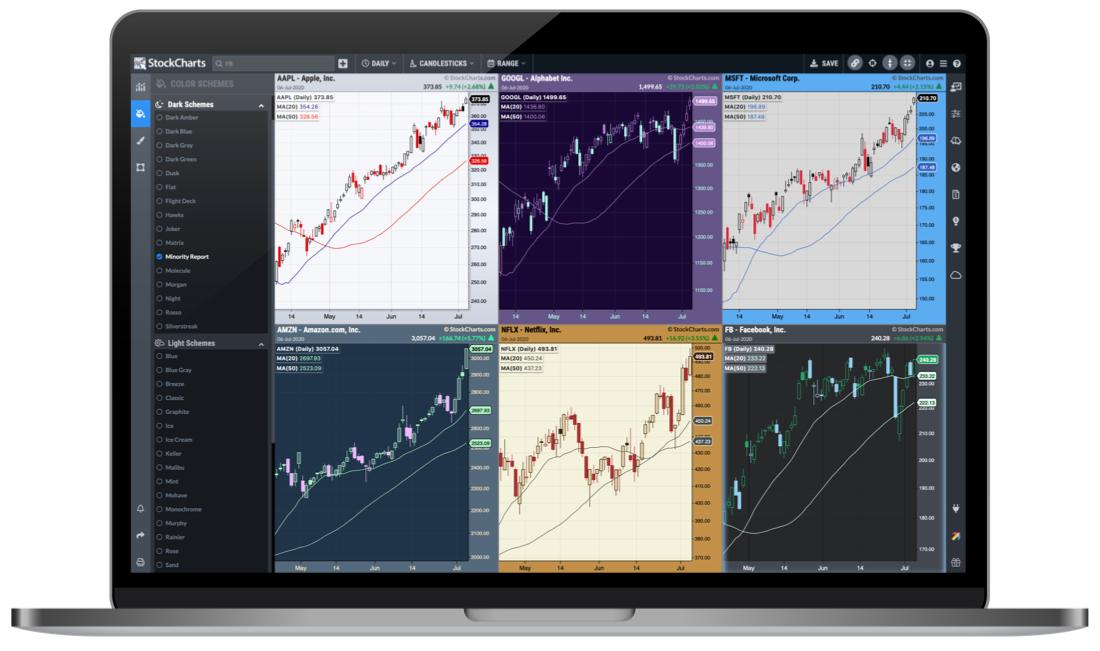 We feel that the web's most advanced charting platform deserves a look to match. On that front, ACP delivers with an extensive collection of crisp, stunning color schemes for you to choose from. Explore all of the unique looks in ACP, find your favorites and create elegant charts unmatched by any other charting tool out there.
Personally, I find that using different color schemes for charts of different asset classes can really help organize your analysis. For example, use a dark theme like "Flight Deck" on your market index charts, use a light theme like "Breeze" for your ETF charts, and use another one like "Sea Green" for your individual stock charts. Or, in a similar vein, try using different color schemes for different time periods. Get creative!
Access exclusive "Plug-Ins" from industry-leading chartists and renowned indicator creators
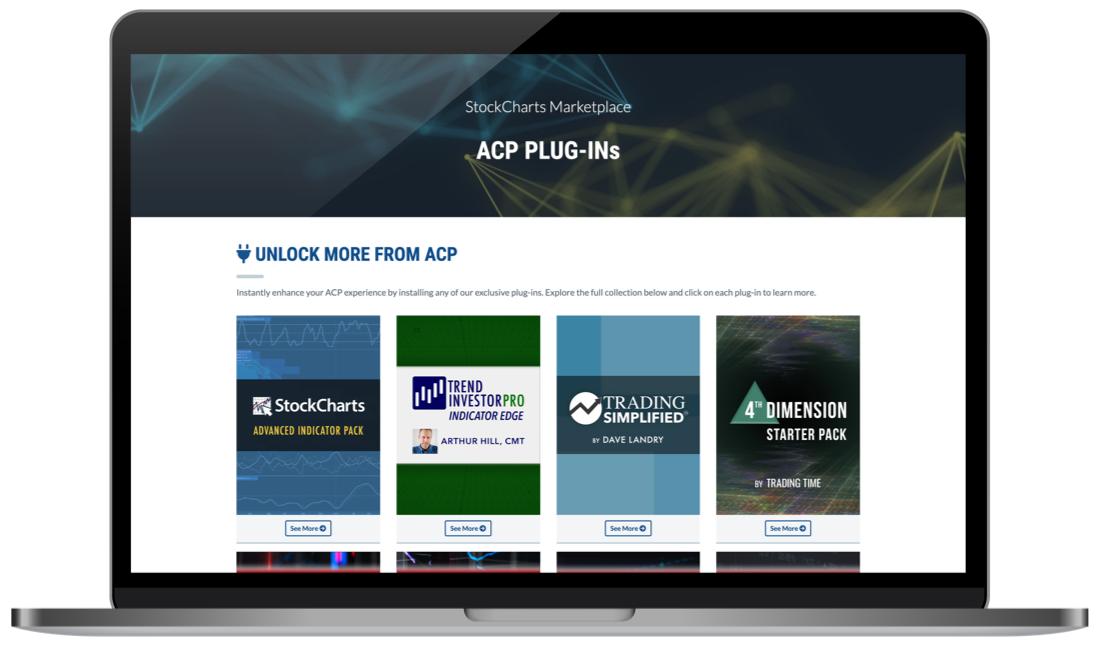 The v1.0 release also includes the first round of our unique ACP plug-ins from some of the industry's top technicians and leading indicator creators. Installed in just one click, you can instantly enhance your charting experience with additional indicators, overlays and other advanced technical capabilities.
You can now browse our full collection of ACP plug-ins here. The first round of plug-ins that we've included in this new release are Arthur Hill's "Trend Investor PRO Indicator Edge", Dave Landry's "Trading Simplified" and Shaun Downey's "4th Dimension Starter Pack".
We've also created our very own "StockCharts Advanced Indicator Pack", which you can install for FREE as a StockCharts Member. Our Advanced Indicator Pack plug-in will instantly add the following seven indicators to your account for use in StockChartsACP:
1. Double Exponential Moving Average (DEMA): A faster moving average calculation that places more weight on recent values in order to remove the traditional lag in Moving Averages
2. Triple Exponential Moving Average (TEMA): An even faster moving average calculation that creates a significantly more responsive Moving Average indicator
3. Distance from Moving Average: The percentage difference between price and a Moving Average of your choice, displayed above or below a zero line
4. ConnorsRSI: A momentum oscillator created from the composite of RSI, ROC and Up/Down Length, developed by Larry Connors
5. Hull Moving Average: A more responsive Moving Average calculation developed by Alan Hull that weights recent prices more heavily than those earlier in the period
6. Balance of Power: A measurement of buying and selling pressures designed to indicate which side is in greater control and driving price action
7. TTM Squeeze: A momentum indicator used to identify periods of consolidation and indicate the likely direction of the resulting move
I strongly recommend installing the free "Advanced Indicator Pack" plug-in to see how this important new feature of ACP works. In addition to the seven bonus indicators themselves, installing the plug-in will give you a great sense of what plug-ins are, how they can be used and what to expect from our many other plug-ins, now and in the future.
In the coming months, we'll be rolling out additional plug-ins from Larry Williams, Martin Pring, Mish Schneider's MarketGauge team, Chaikin Analytics and many others, so stay tuned for much more on this very cool ACP feature!
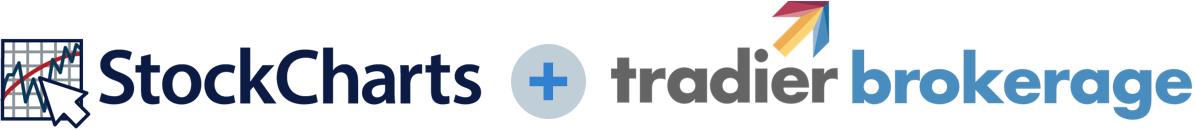
Unlimited commission-free equities trading, right from ACP
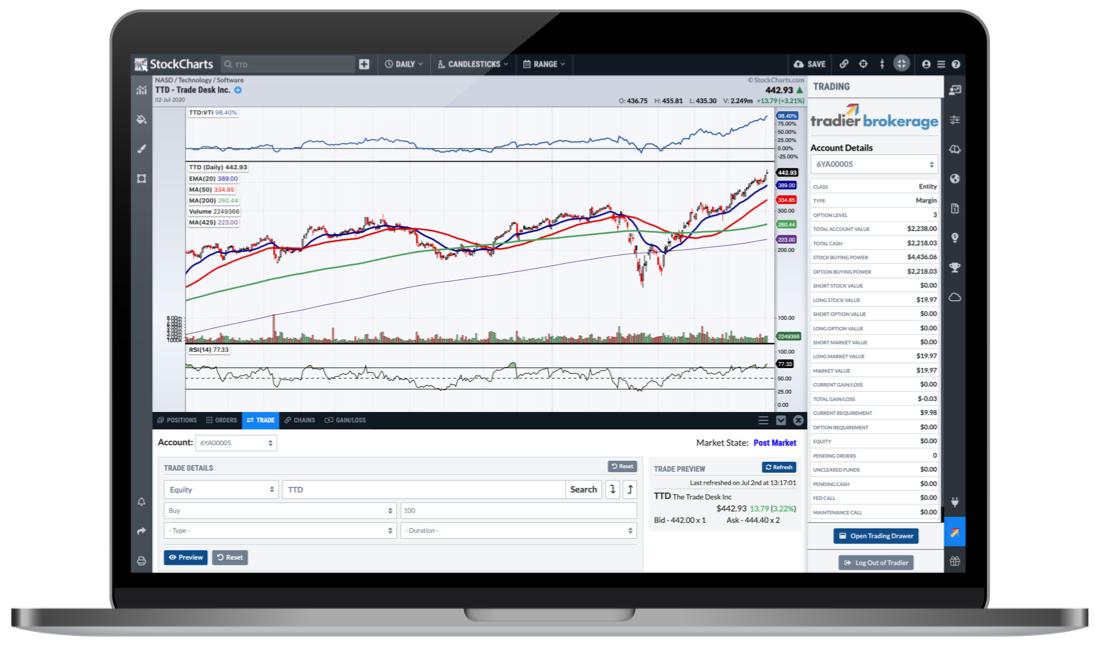 This is a big one... We've partnered with Tradier Brokerage to bring you unlimited, commission-free trading for US equities – directly from StockChartsACP.
As a StockCharts Member, you automatically qualify for FREE unlimited equities trading through Tradier. All you have to do is open a new account with Tradier and you'll be able to start trading directly from ACP.
You can choose between Individual, Joint, Traditional IRA, and Roth IRA accounts through Tradier. Plus, their world-class team of knowledgeable support staff are always there to help answer even your toughest questions.
To open your free Tradier Brokerage account now, CLICK HERE. Combined with the ability to trade directly from StockChartsACP, opening a Tradier Brokerage account today will bring you a seamless experience between analysis and action.
Now, there's a chance that you many have a question or two about ACP. We've heard some roll in already, so allow me to answer a few of the more common ones in case you're wondering the same thing.
"StockChartsACP sounds fantastic, but how can I start using it? Where should I go?"
Simple! All you've got to do is head over to StockCharts.com/acp to start charting with the web's most interactive, Advanced Charting Platform.
You can also select "ACP" from the create-a-chart bar at the top of any StockCharts page across the site. Look for the little grey button to the left of the search bar that says "SharpChart", click that, select "ACP" and enter any symbol you'd like to see.
"How much does ACP cost? It must be some sort of add-on, right?"
Nope! You can use our new StockChartsACP tool for FREE on StockCharts.com. However, just like SharpCharts and the rest of the site, the most powerful features of ACP are reserved for StockCharts Members.
As a member, you can create more advanced charts with more indicators, overlays, datasets and customizations. Plus, you have the ability to save charts, ChartStyles and other settings, create multi-panel layouts, install exclusive "plug-ins", access unlimited commission-free trading for US equities through Tradier Brokerage and more.
To get the most out of ACP, you want to be a StockCharts Member. Sign up for a free trial today!
"Will ACP replace SharpCharts? Are my current charts going to disappear?"
I want to be crystal clear here – SharpCharts are not going anywhere! ACP is in no way replacing SharpCharts. Not now...not ever...not on my watch!
We've designed our new charting platform to complement SharpCharts, and vice versa. Here at StockCharts, we're in the business of providing charting tools – plural. The more that we can do for you, the happier we are. So SharpCharts is 100% here to stay, and in fact, we have big plans for its continued evolution this year and beyond. With StockChartsACP, we're now giving you two amazing ways to chart the market – the static SharpCharts you know and love, plus the new dynamic, interactive charts that you'll find in ACP.
By the way, if you open up the ChartLists menu on the righthand side of ACP, you'll actually notice that all of your saved SharpCharts are right there waiting for you. We wanted to make it easy to pull in your existing work, so you can now view ACP versions of your existing SharpCharts if you'd like.
"What's next for ACP? Is this the final version?"
Not by a long shot. When we say "version 1.0" we truly mean "version 1.0". We've packed a ton into this new release, but it really does represent the very beginning of ACP. We're already mapping out the next major release for the late summer / early fall, which will include an entirely revamped annotation tool (with the ability to save your drawings), more flexibility for multi-chart layouts, the ability to save the layouts you create, additional plug-ins, more trading capabilities, more data, more ChartLists views, alerts and scans right from ACP – this list just keeps on going. Our new Advanced Charting Platform has no finish line, and we can't wait to continue evolving and improving this ever-growing platform this year and for many more to come!
Watch today's "Your Daily Five" episode to see ACP in action
If you'd like to see a demo of ACP in action, be sure to watch today's episode of "Your Daily Five" on StockCharts TV. I hosted the show in our first-ever all-ACP edition, with five of the top charts I'm watching right now, all created using our new ACP tool. In addition to some current market analysis, it's be a great opportunity to see the new platform, get a sense of what can be done with the new charts and learn more about how you can start using ACP.
As always, if you have any other questions, comments, concerns or feedback for us, you can always contact our Support Team here on the site or via email at support@stockcharts.com. Also, you can click here to read some of the new documentation for ACP. As the platform grows, we will to continue to expand those resources with additional articles and helpful videos.
Now, what are you waiting for? You've got some advanced charting to do!
Chart on, my friends.
- Grayson Roze
VP of Operations, StockCharts.com
Author, Trading For Dummies (Wiley, 2017)
Author, Tensile Trading: The 10 Essential Stages of Stock Market Mastery (Wiley, 2016)
Chart on, my friends.
Grayson Roze
- Director of Operations, StockCharts.com
- Author, Trading For Dummies (Wiley, 2023)
- Author, Tensile Trading: The 10 Essential Stages of Stock Market Mastery (Wiley, 2016)
- Co-Founder, StockMarketMastery.com
- Twitter: @GraysonRoze