Strong Bull Market Indications
We are all aware of the Shakespearian saying "Beware of the Ides of March," which didn't go so well for Julius Caesar. In market folklore, October is the season for crashes and September is the worst-performing month. Welcome to the bearish season!
Right now, there are eight charts I am watching closely. Some are long-term, to remind me we are in a bull market. Others are short-term, to alert me to the fact that bull markets are never straight lines up, but usually interrupted from time-to time by unexpected sharp and believable shakeouts. Let's start with the long-term perspective.
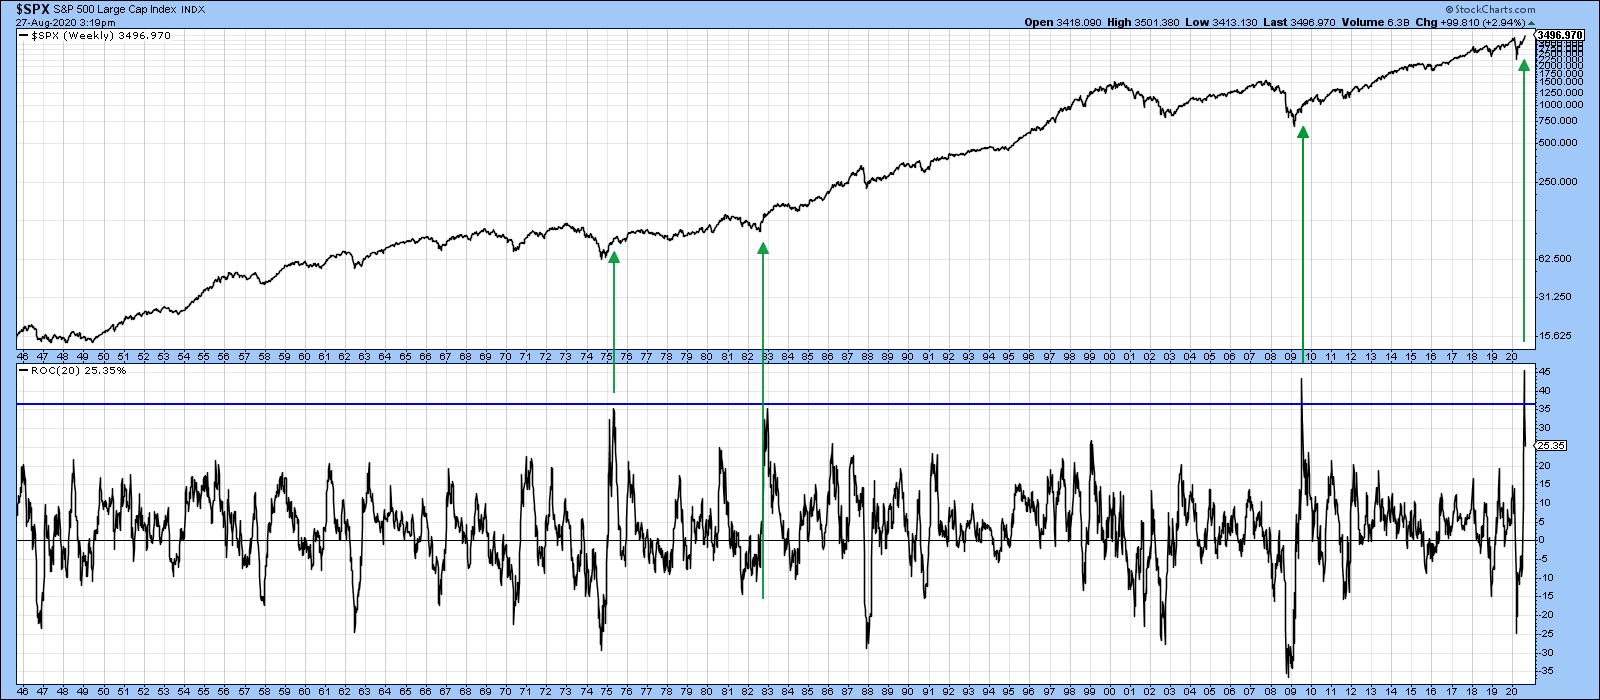 Chart 1The beginning of a powerful long-term bull market is often heralded with short or medium-term oscillators reaching an exceptionally high level. Chart 1 compares the S&P to its 20-week ROC and shows that three of the last four bull markets were signaled by the ROC reaching an extraordinary high level. Mid-July saw this indicator reach a post-1946 record. It's not the only example of a strong initial thrust, as I could have used several other breadth and price momentum series that transmit a similar message. In the three previous examples featured in the chart, it would clearly have paid to downplay the inevitable short-term correction, but instead to focus on the bigger trend.
Chart 2 features the NASDAQ, which is clearly in a strong bull market as the Index is above its 12-month MA and is experiencing a positive KST. This action is certainly reinforcing the powerful reading in the 20-week ROC for the S&P.
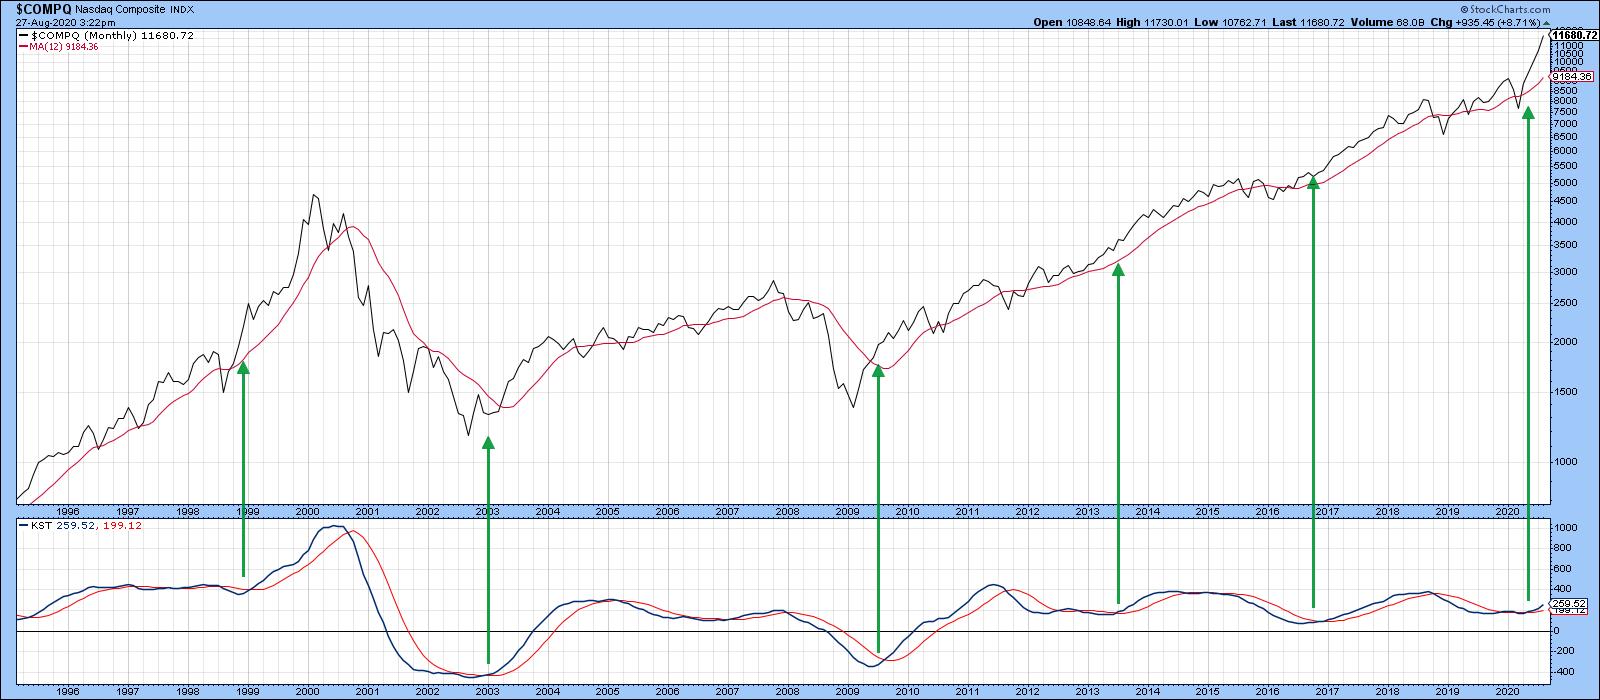 Chart 2
Chart 3 downplays the technology strength in the regular capital-weighted S&P in the form of the Invesco Equal Weight ETF (RSP). It's also been inflation-adjusted. After all, if stocks and the CPI both increase by 10%, there is no actual gain, just an illusory paper profit. Over the long-term, the adjusted series offers a more accurate picture of what's going on. The green horizontal arrow indicates that, unlike the regular S&P or NASDAQ, there has been no net gain for the average S&P stock since the end of 2017, as it has been range-bound for the last 3 years. The small arrows show that the 12-month MA has turned back numerous rallies and reactions over the last 16 years and, therefore, represents a really impressive dynamic level of support and resistance. It's not the end of the month yet, but the price appears to be punching through the average. The point I am trying to make is that, while the NASDAQ and S&P might look a bit overextended on the upside, indexes such as the unweighted S&P and NYSE Composite are poised to break out from major trading ranges and move substantially higher.
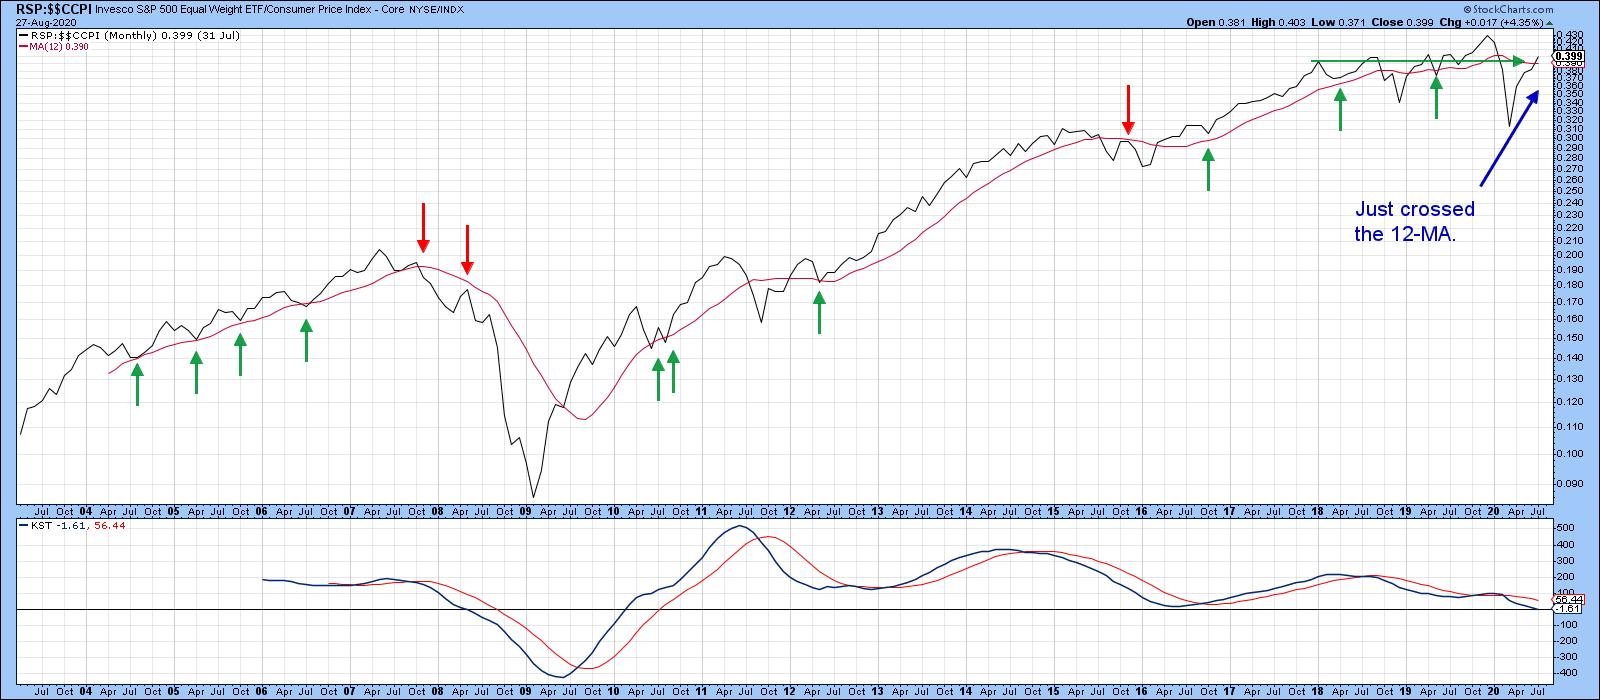 Chart 3
Short-term Vulnerability?
Chart 4 shows the long-term perspective of the monthly VIX. The red arrows indicate that all the major peaks since 1994 developed when the VIX was well below the blue horizontal line. The only exception developed in 1998, when it reversed from a position slightly above it. The indicator touched a major peak earlier in the year. Despite a substantial decline, it is still well above that sub-blue line complacent zone associated with market tops. That does not mean that the upcoming negative seasonal period will avoid an uncomfortable shakeout, after all, the VIX itself is quite volatile, but, more to the point, several short-term indicators are starting to misbehave.
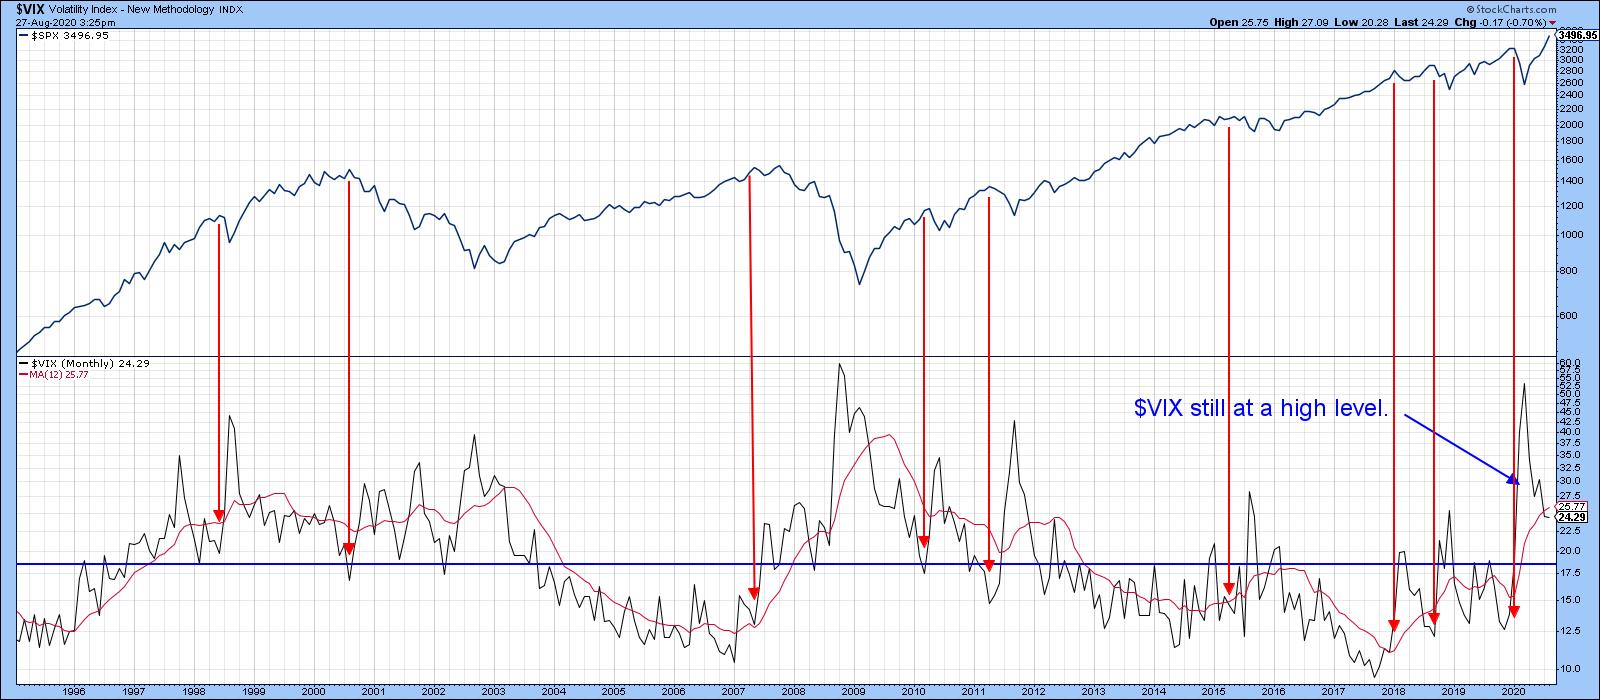 Chart 4
Take Chart 5, for instance. It shows that the Common Stock A/D line has been pretty much in gear with the S&P for the last couple of years. Just prior to the 2020 bear market, it diverged negatively, as indicated by the two dashed arrows at "1". Recently, we have seen another small divergence at "2" as the A/D line declined and the S&P exploded to the upside. There is also another, much larger, divergence that has been flagged by the solid red arrows.
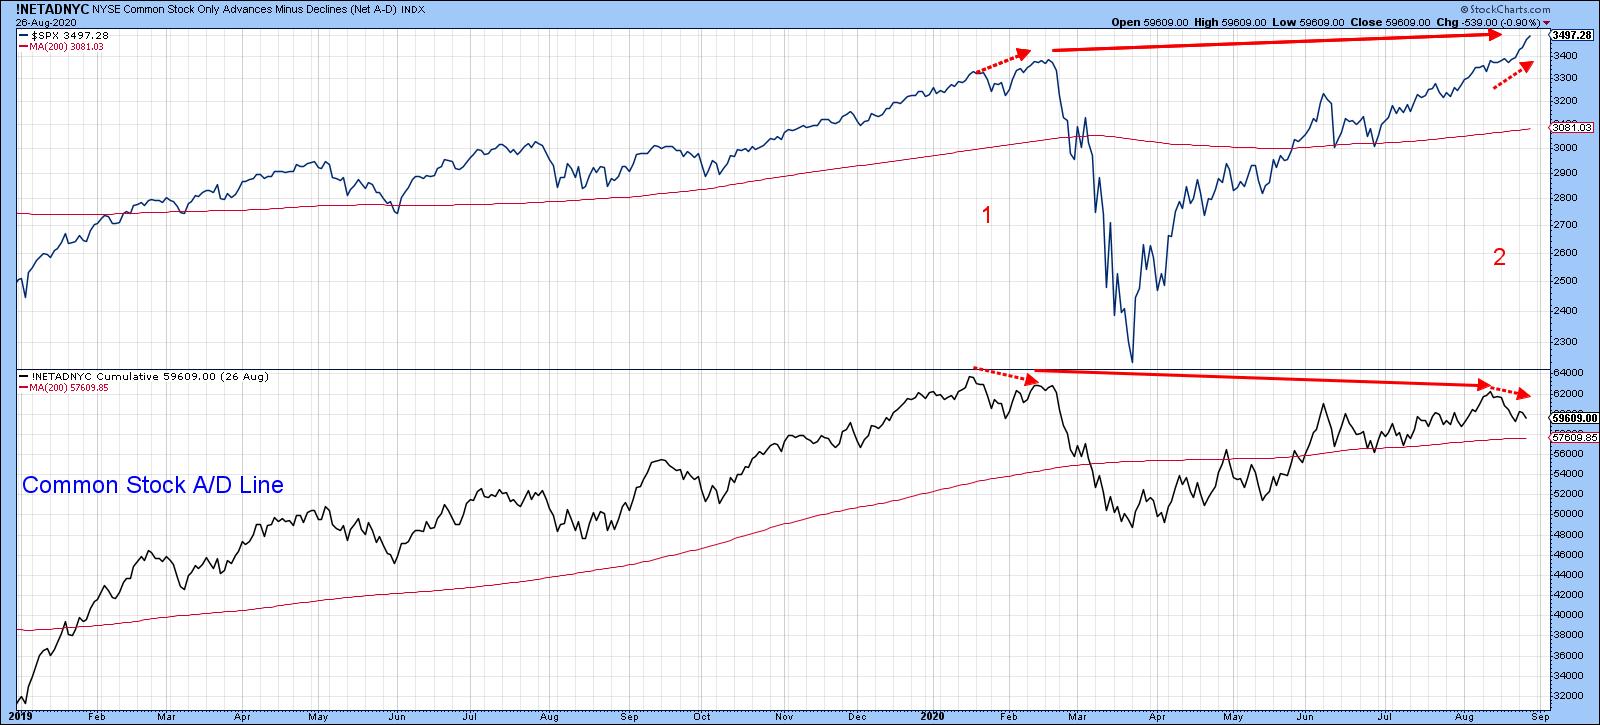 Chart 5
Chart 6 tells us that the sharp rally being experienced at the NASDAQ is starting to show some cracks, as the NASDAQ bullish percentage has diverged negatively with the Index itself. Three previous examples of negative divergences and trendline breaks, in both the indicator and the Index, were all followed by a correction of some kind. Right now, neither series has cracked its up trendline, but it's something I am watching carefully.
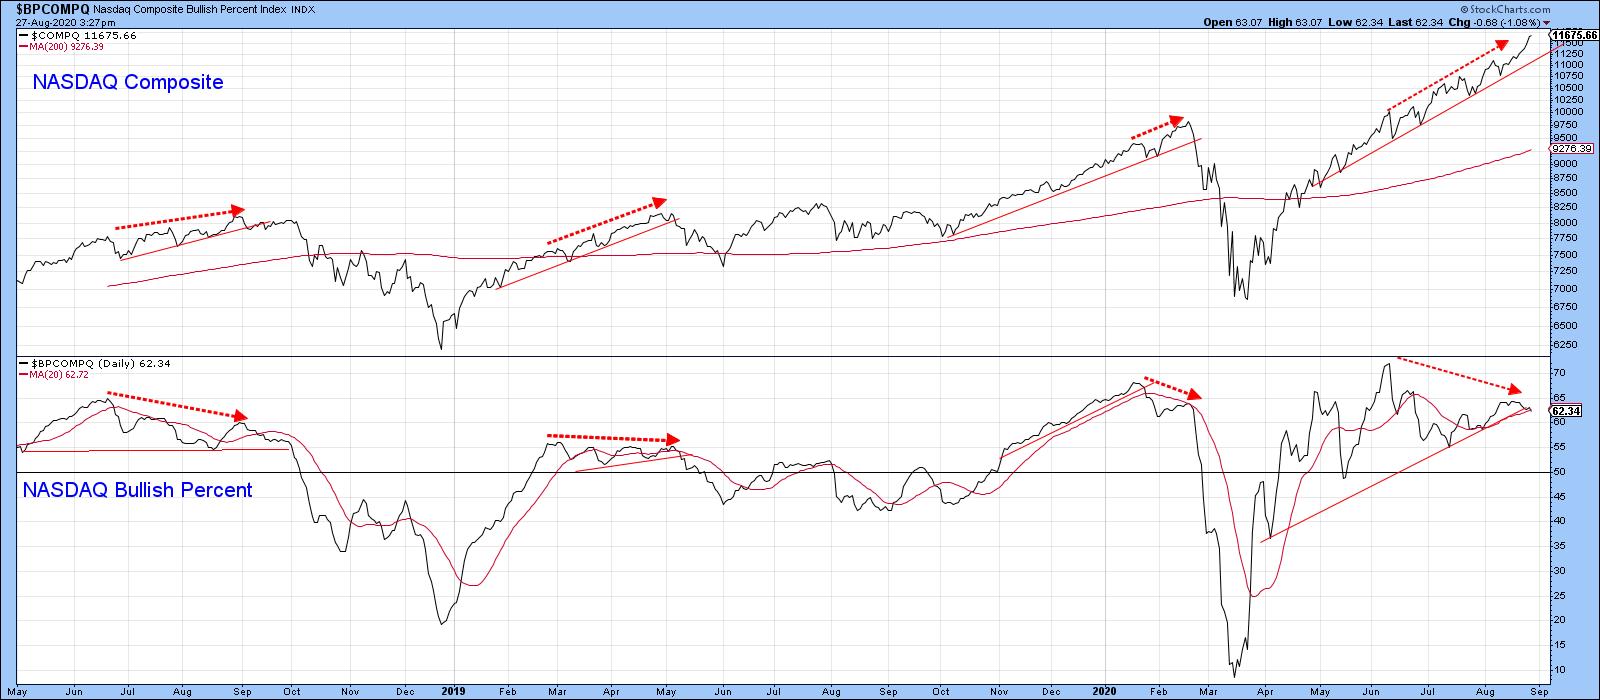 Chart 6
Elsewhere, things are starting to look a little precarious from a short-term aspect. Chart 7 shows that joint trendline breaks by the S&P and VIX have given us two timely signals this year. A third could well be in the cards. The VIX is already experiencing a sight break, but two violations are required for a signal and the S&P remains above its line.
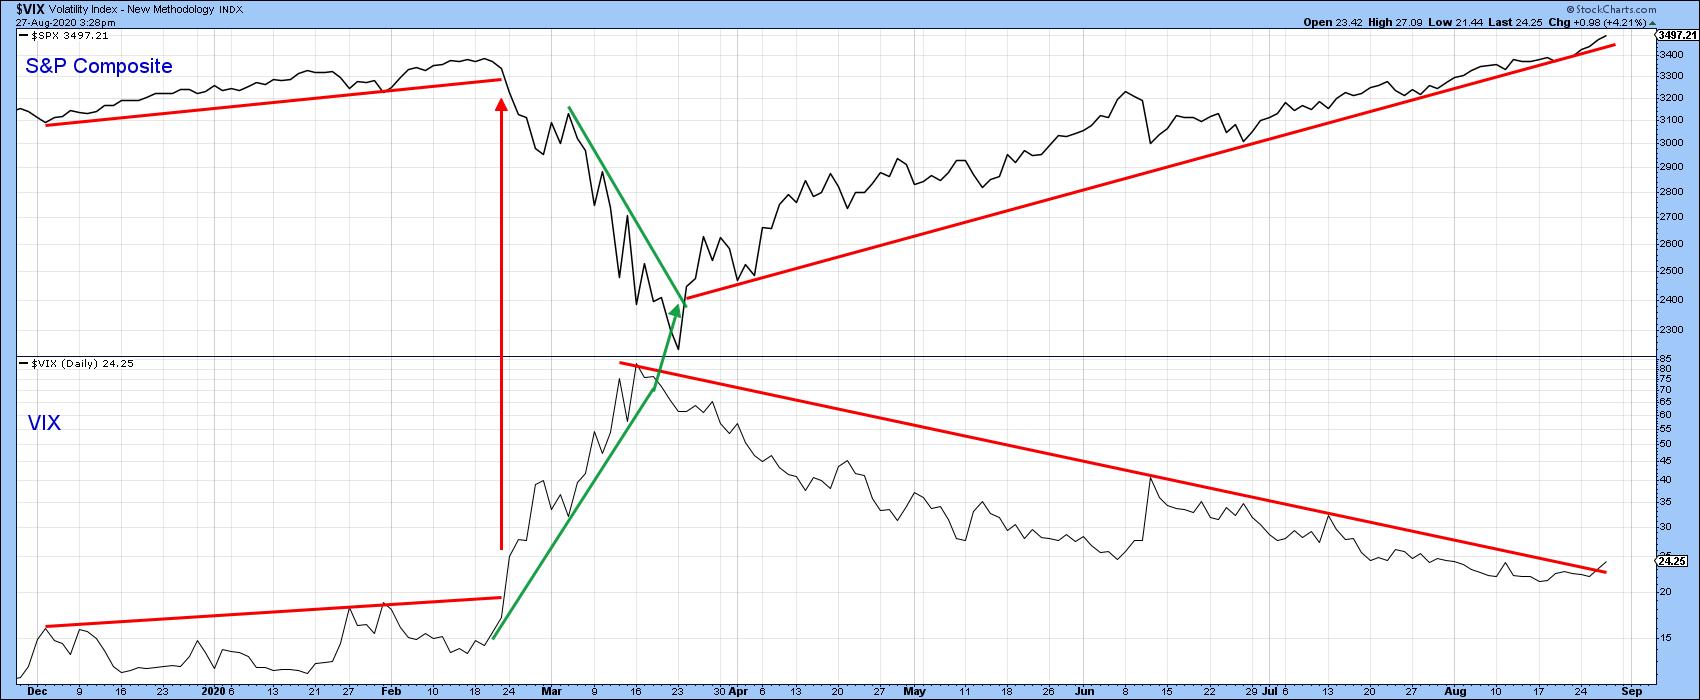 Chart 7
A similar exercise for the NASDAQ and NASDAQ VIX indicates that both trendlines are intact, but certainly close enough to justify some careful monitoring in the next few sessions.
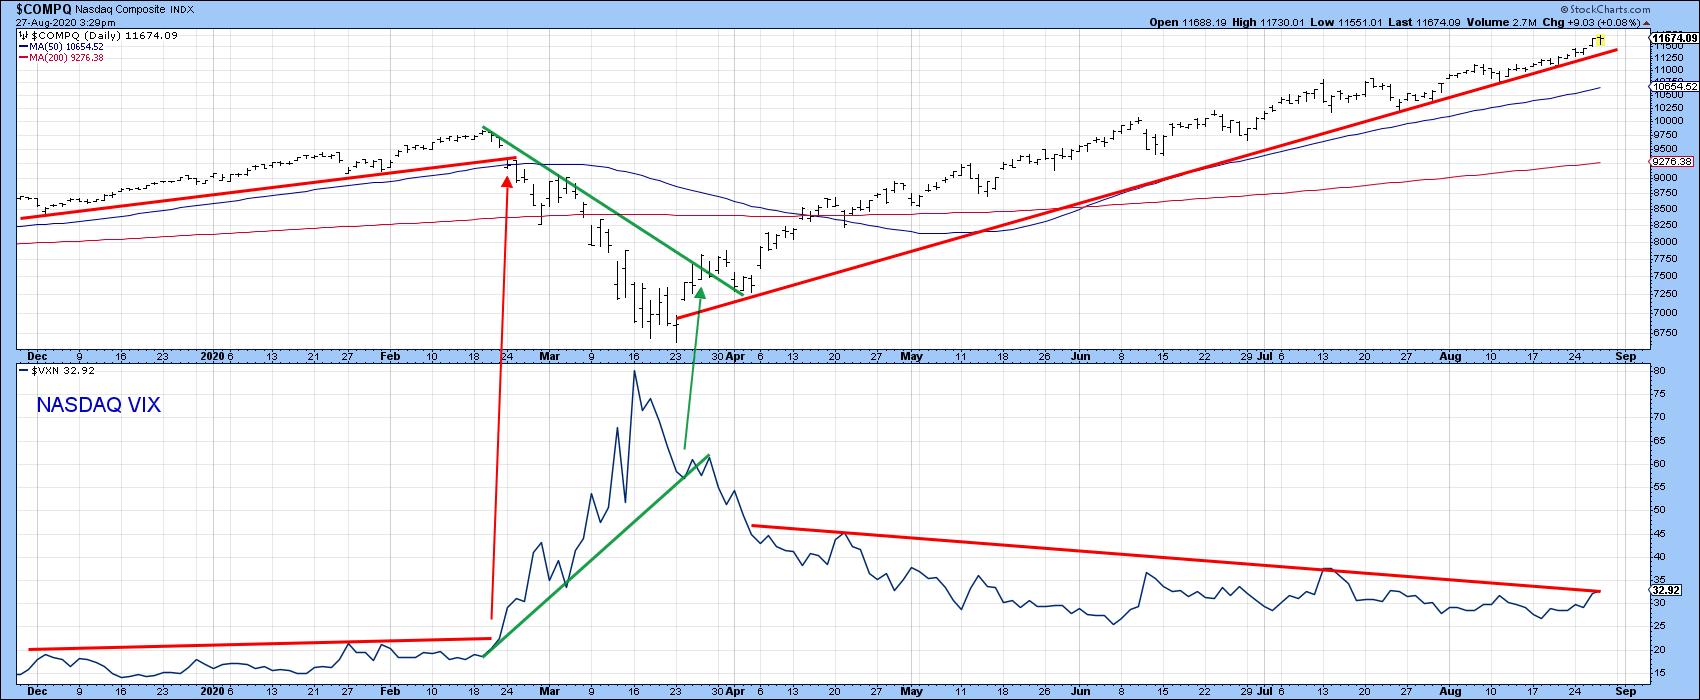 Chart 8
The bottom line: expect the bull market to continue big time, but don't be surprised if a seasonal correction comes first.
Editor's Note: This article was originally published in Martin Pring's Market Roundup on Thursday, August 27th at 5:51pm ET.
Good luck and good charting
Martin J. Pring
The views expressed in this article are those of the author and do not necessarily reflect the position or opinion of Pring Turner Capital Group of Walnut Creek or its affiliates.
