Pfizer (PFE)'s announcement about a vaccine may have triggered a sharp rally on Monday, but its real effect was to boost confidence, which improved the status of a lot of different relationships that I follow, portending further gains for stocks and commodities down the road.
Swings in sentiment can be measured in many different ways, but my favorite is to assess what investors are actually doing with their money, as opposed to what they are saying.
The byproduct of an improvement in confidence is a stronger economy. Markets anticipate that, by bidding up prices for stocks and commodities, it will eventually push up bond yields. What is impressive with the current setup is that these relationships come at the problem from different angles, but are currently offering a common theme. That theme is characterized by what is affectionately known in the trade as "risk on," as the more speculative markets are slowly getting the upper hand.
Improving Credit Spreads are Bullish for Stocks
Chart 1 reflects sentiment in the bond market, utilizing the relationship between risky high-yield bonds (iBoxx High Yield Fund), the HYG, against the iShares 7-10-year Trust, the IEF. The ratio formed an initial peak last June, well before the late summer top in the S&P. It looked at the time as if a small negative divergence between the two was starting to form, on a smaller scale to that which developed in 2019 (see the two red dashed arrows). Things right now, though, are looking much stronger, as the ratio has already cleared its 200-day MA and shrugged off a potential head-and-shoulders top.
Price patterns, such as those that do not "work," are often followed by above-average price moves to the upside. Already this relationship has broken above the resistance trendline to a post-March high. All this suggests that the S&P itself will likely register a new high. Finally, note that the short-term KST for the ratio in the bottom window has just triggered a marginal buy signal.
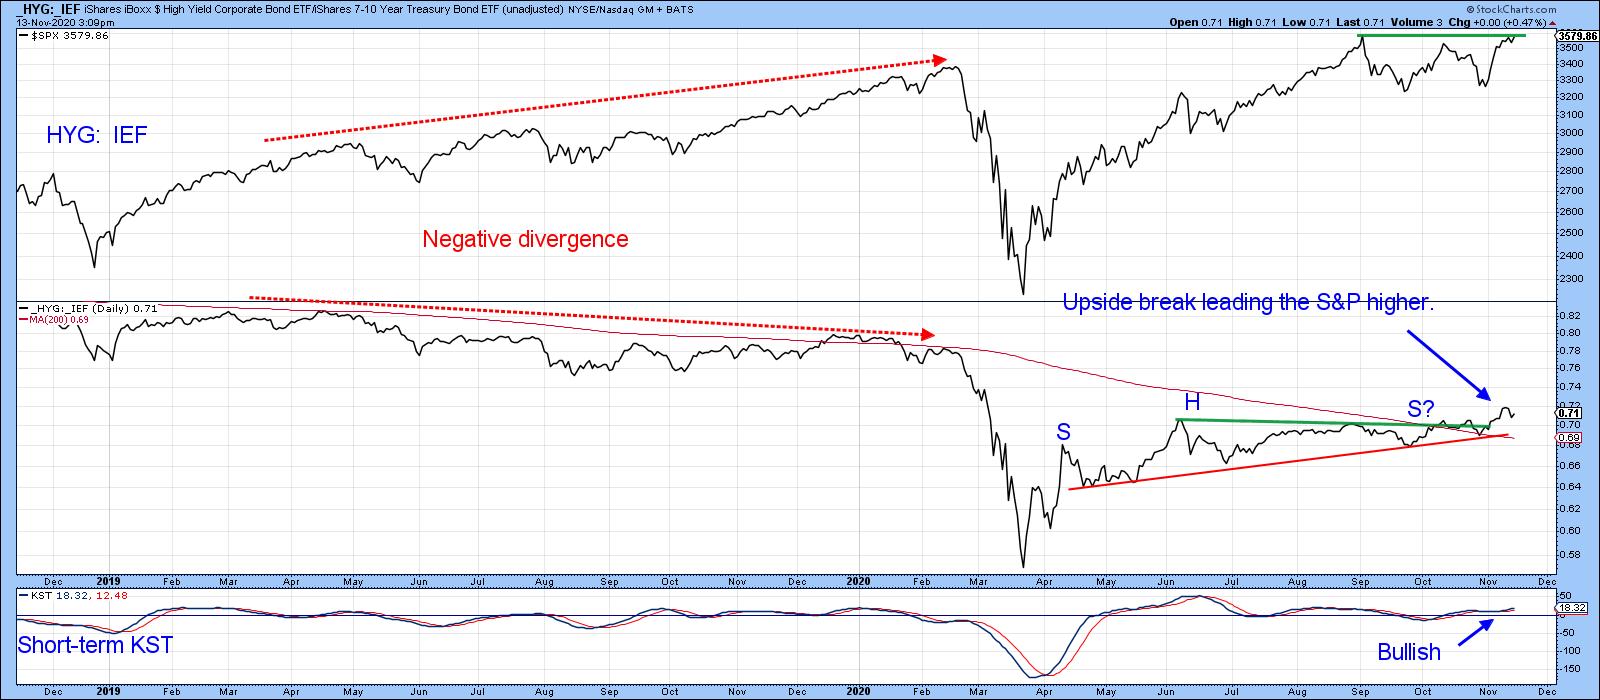 Chart 1
It's possible that any new high ground will be achieved later rather than sooner, since Monday's action represented a bearish exhaustion day (see Chart 2). However, we should not get too hung up on these very short-term negative patterns, as they have far less power in a bull market than when they develop under the context of a primary bear.
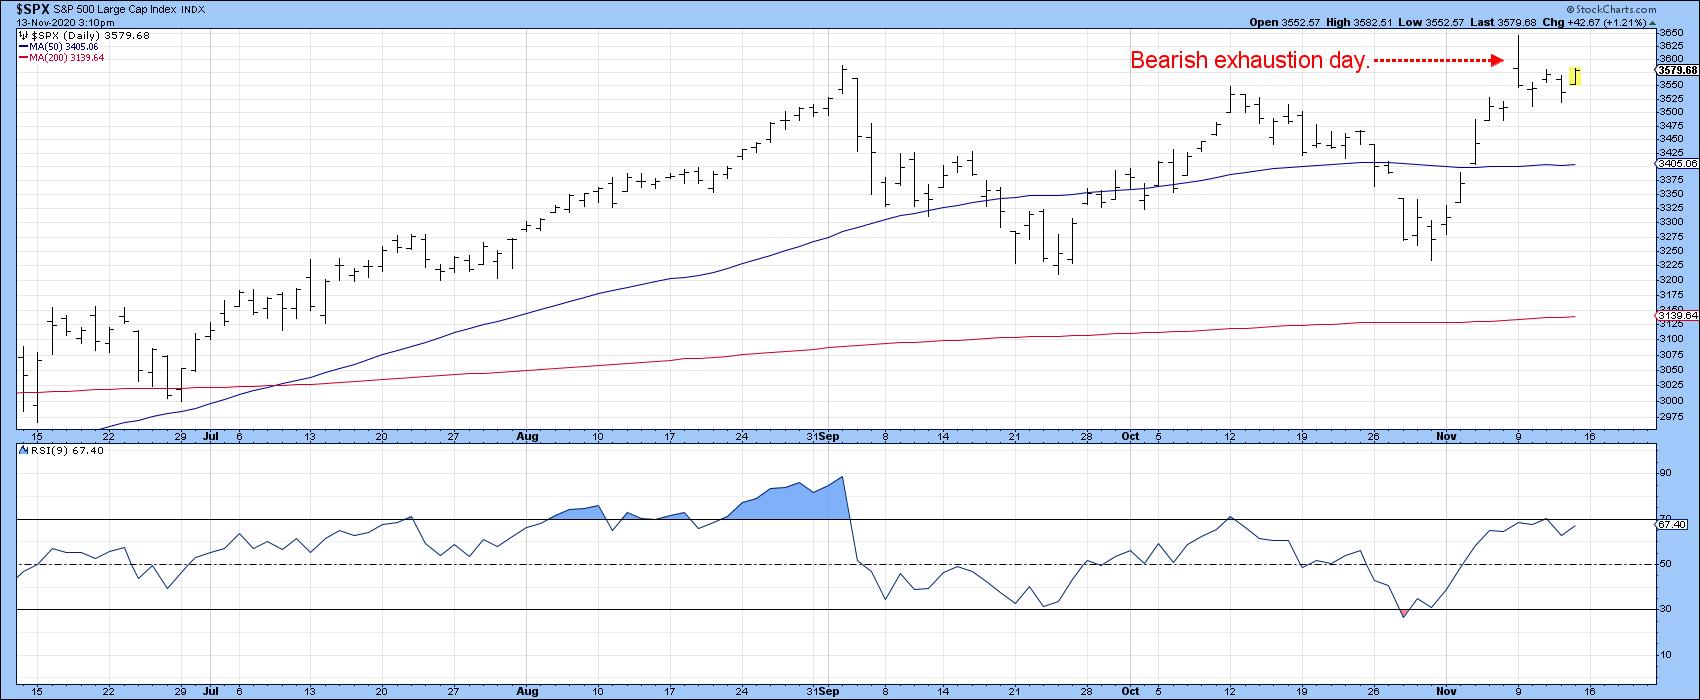 Chart 2
Chart 3 shows a couple of other confidence relationships. The first is between the Fidelity Capital and Income Fund (FAGIX) and the Vanguard Long-Term Treasury (VUSTX). The second pits the S&P High Beta (SPHB) versus the S&P High Quality ETF (SPHQ). Both reflect similar (risk-on) action from dissimilar groups of investors.
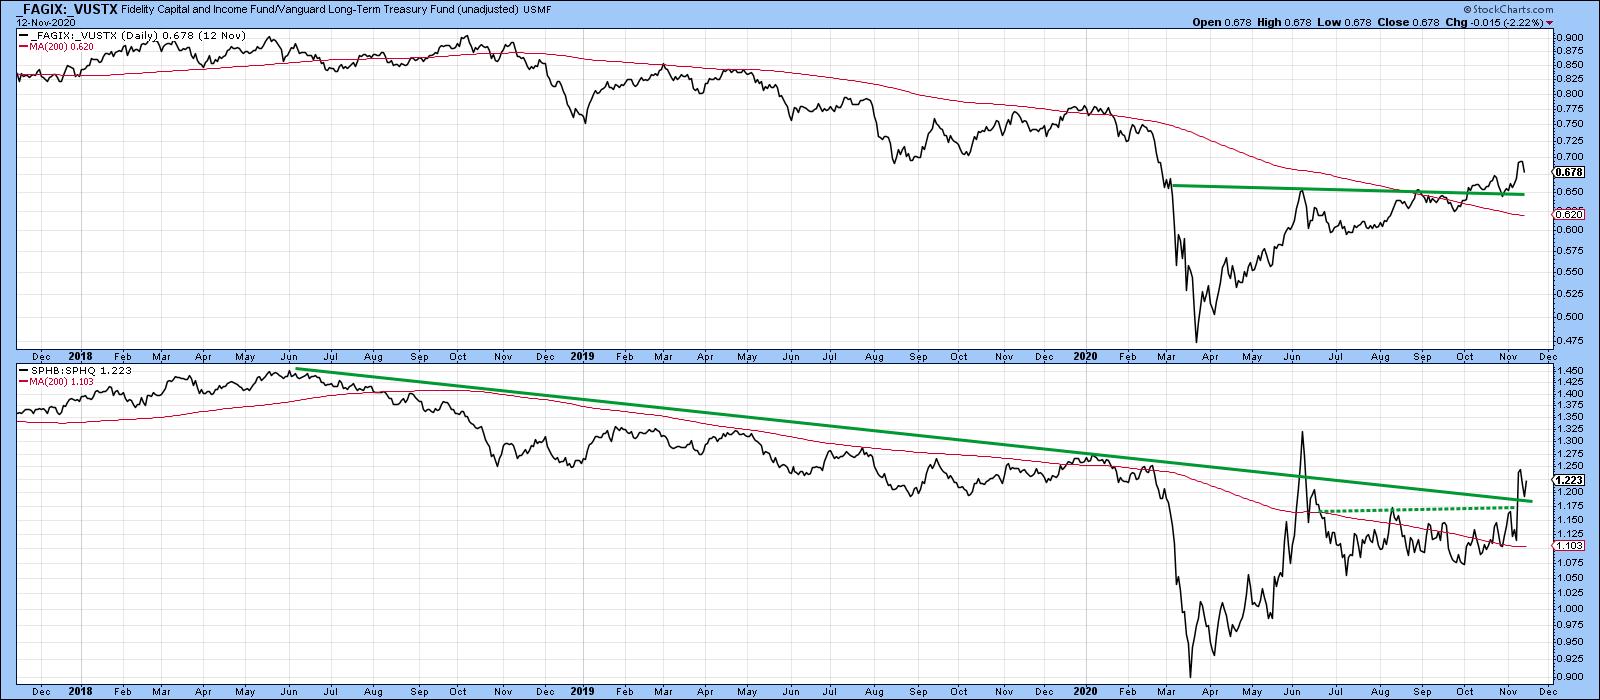 Chart 3
Internationally, Confidence is Improving
Chart 4 addresses the problem from an international point of view, but the message is the same. It features the Dow Jones World Stock Index ($DJW) and compares it to an international credit spread between the International High Yield Bond ETF (HYXU) and the Barclays International Treasury (BWX). Once again, a rising ratio reflects improving confidence and vice versa. The green arrows tell us that important lows in the Stock Index correspond to those in the ratio. Note how the $DJW has already touched a new bull market high; this is being confirmed by similar action in the ratio. Both recently experienced false downside breakouts; typically, we would expect to see an above-average advance develop from such action. Certainly, support is coming form the two KSTs for the ratio, both of which have just gone bullish.
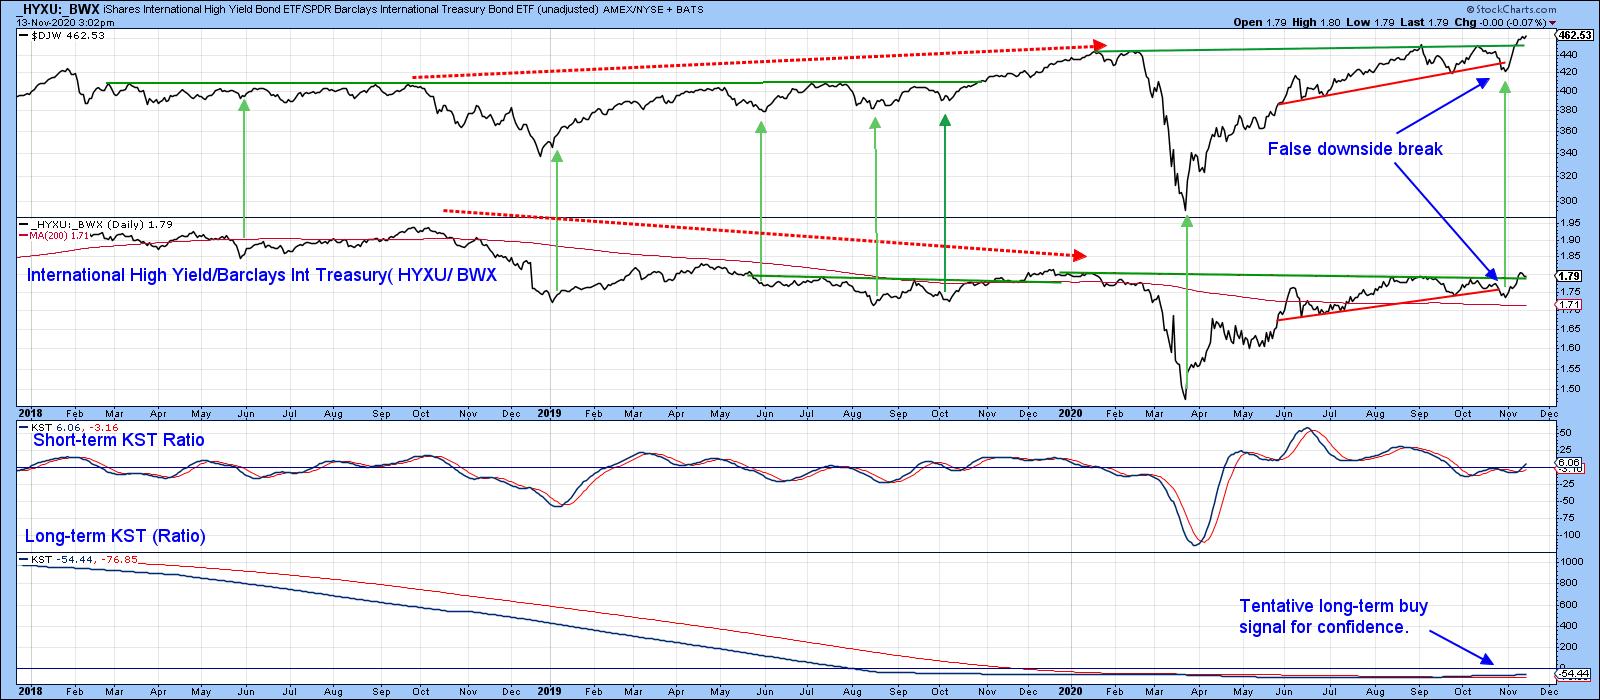 Chart 4
Gold is Forecasting Higher Commodity Prices
Chart 5 compares the Invesco DB Commodity ETF (DBC) to the ratio between it and the SPDR Gold Trust (GLD). When it's in a rising mode, Gold is outperforming commodities and vice versa. Paradoxically, a rising relationship means a more cautious (risk-off) attitude between these two classes of investors, as preference is given to the safe haven status of the yellow metal. This is demonstrated by the red and green arrows - green points to peaks in the ratio, red to the lows. The arrows, plotted against the DBC itself, demonstrate that ratio turning points roughly correspond with reversals in commodity prices.
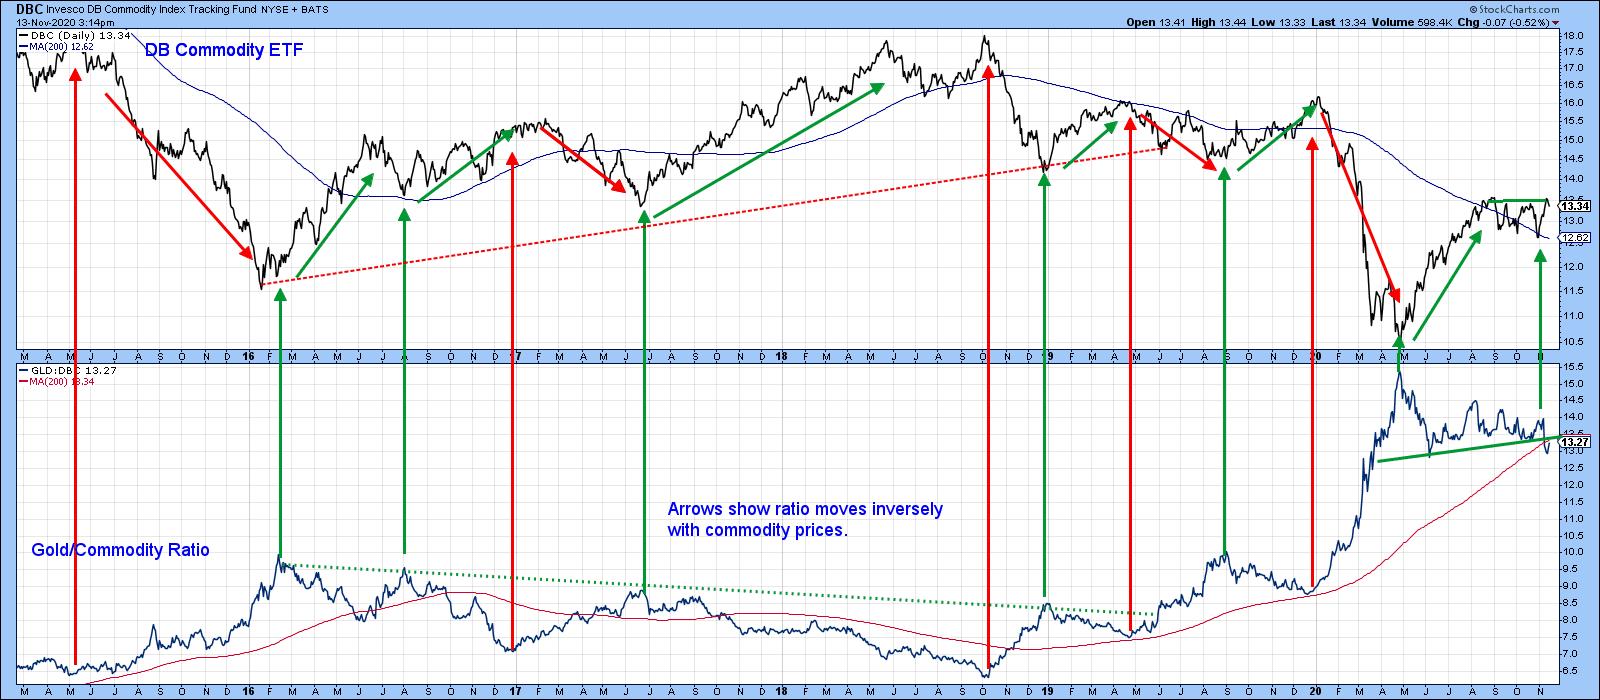 Chart 5
In 2019, a violation of the two dashed trendlines signaled a bull market in the ratio and a bear market for commodities. Fast forward to the current situation and we see that the March peak in the ratio corresponded to the commodity low. That the Gold/DBC ratio has recently completed a top and violated its 200-day MA strongly suggests that the DBC will resolve its recent trading range on the upside. Note that the break in the ratio only tells us that gold is likely to underperform commodities, not necessarily that gold will fall of its own volition.
Natural Resources vs. Staples
Our final relationship under consideration is that between the more risky Goldman Sachs Natural Resource ETF (IGE) and the defensive SPDR Consumer Staples (XLP). A rising relationship indicates a risk-on (in this case inflationary) situation, while a falling one indicates a risk-off (deflationary) situation. The ratio peaked way back in 2008. The 2019-2020 period shown in the chart is just part of that decline. However, it's possible that 2020 price action marks a double bottom, though it's far too early to definitively come to such a conclusion. Nevertheless, the recent post-summer trendline violation, combined with a positive KST, suggests that the trend of improving confidence has further to run, as this relationship moves in sympathy with the others described earlier.
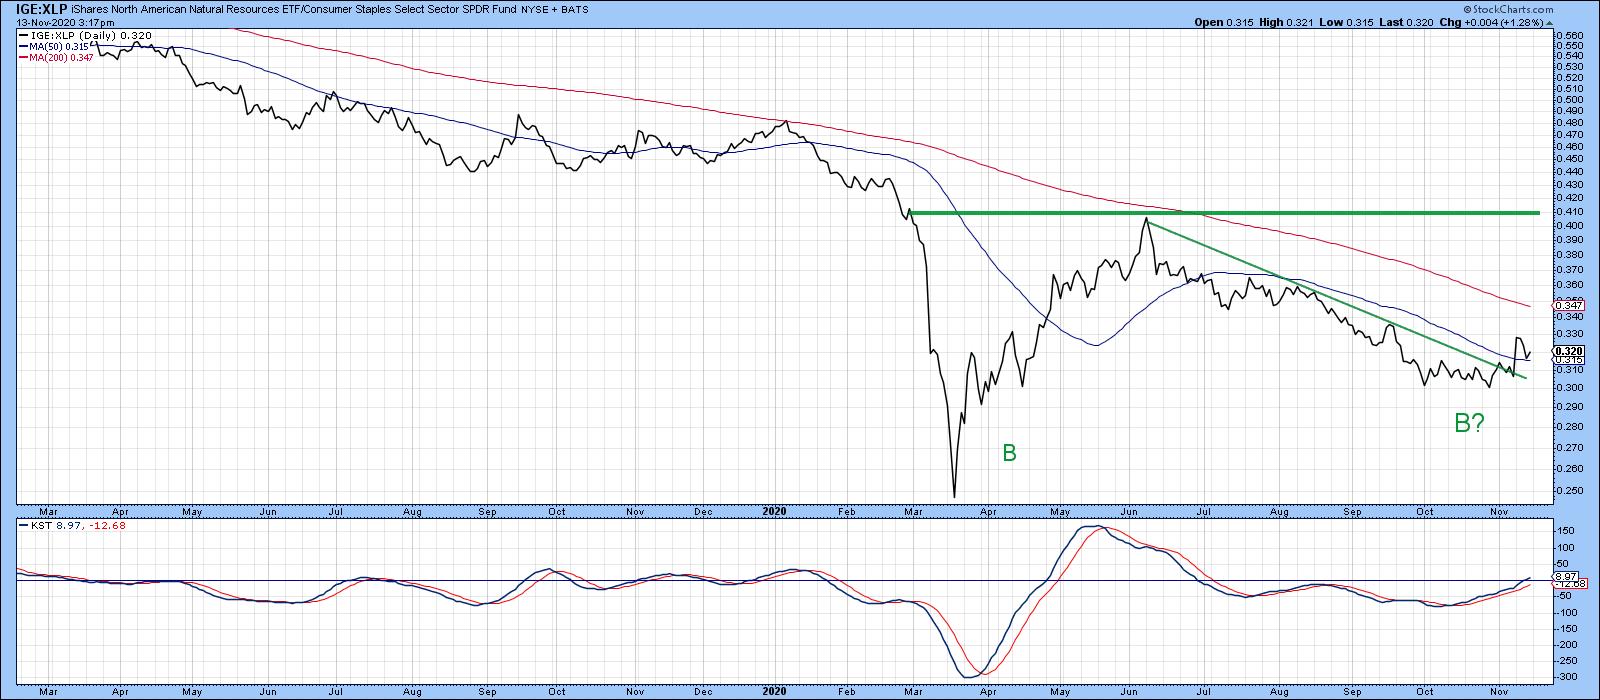 Chart 6
Editor's Note: This is an updated version of an article originally published in Martin Pring's Market Roundup on Tuesday, November 10th at 9:00pm ET.
Good luck and good charting,
Martin J. Pring
The views expressed in this article are those of the author and do not necessarily reflect the position or opinion of Pring Turner Capital Group of Walnut Creek or its affiliates.
