When I was preparing for last week's episode of Sector Spotlight and writing an article for the RRG Blog on the Growth/Value Rotation, I had to think back to an article that I wrote for this newsletter back in August.
The title for this article was "Swap from XLK to RYT to Mitigate The Increasing Risk For AAPL", which was mainly looking at the increasing risk of the dominance of AAPL in that sector. Looking back, that seems to have worked out well.
Below is the RRG showing both XLK and RYT, the equal weight variant, versus SPY.
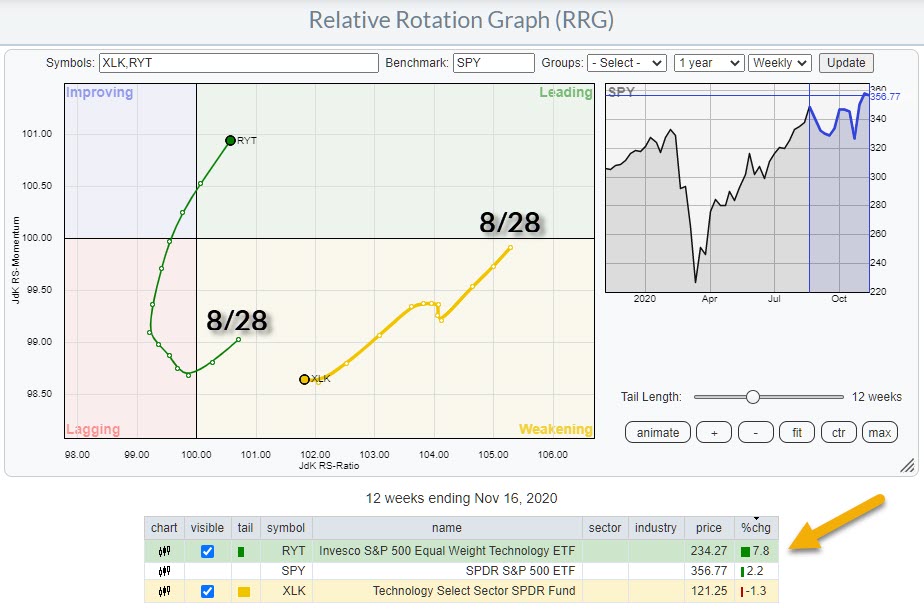
The tails are twelve weeks long, starting on 8/28 (the date of the previous article). Initially, the tails both continued in the same direction, lower on both axes, but, after two weeks, RYT started to curl up, just after it had entered the lagging quadrant.
XLK had a similar attempt, but failed and continued to rotate further towards the lagging quadrant, while RYT continued higher on the JdK RS-Momentum scale and eventually crossed over. XLK is still inside weakening.
Over the last twelve weeks, RYT outperformed XLK by 9.1% (+7.8% vs -1.3%).
Where are we now?
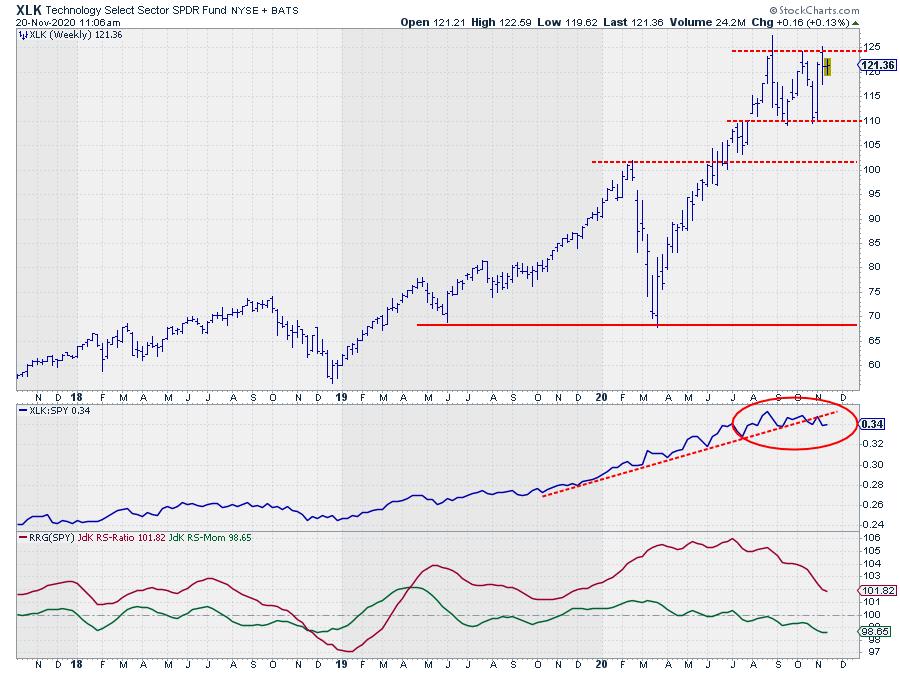
XLK recently failed to break higher and take out its previous highs. This caused the relative strength line against SPY to roll over and break its rising support line.
The JdK RS-Momentum line sank below 100 in July and has since been dragging the JdK RS-Ratio lower, which positions the sector still inside the weakening quadrant and heading towards lagging.
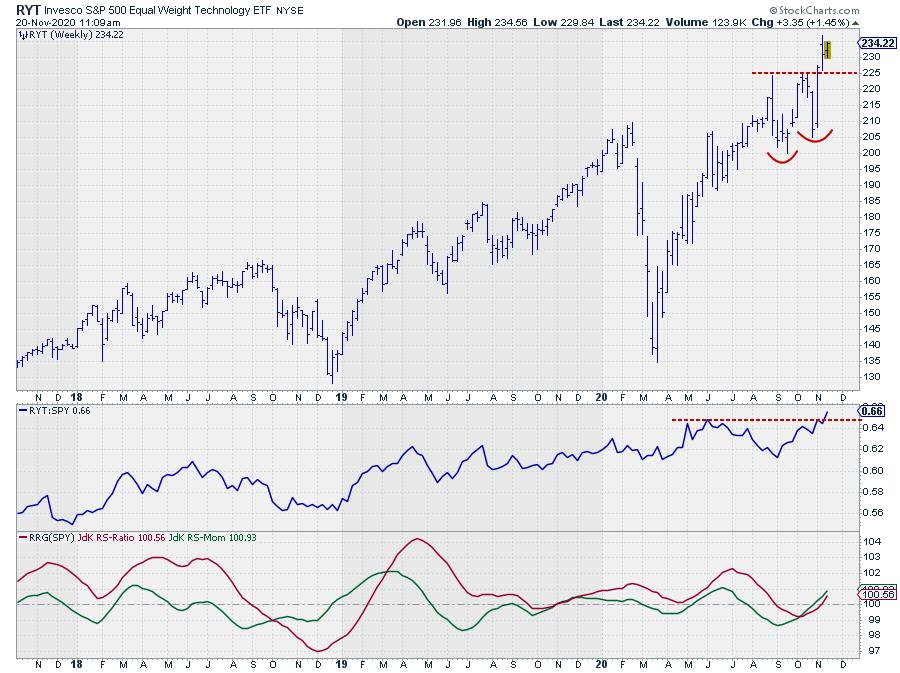
RYT, on the other hand, did manage to take out its previous highs, which freed up renewed upside potential while protecting the downside at the level of the previous highs around $225.
The relative strength line against SPY also broke to new highs, confirming the current relative strength. And this is pushing both RRG-lines higher above 100 and further into the leading quadrant at a strong RRG-heading.
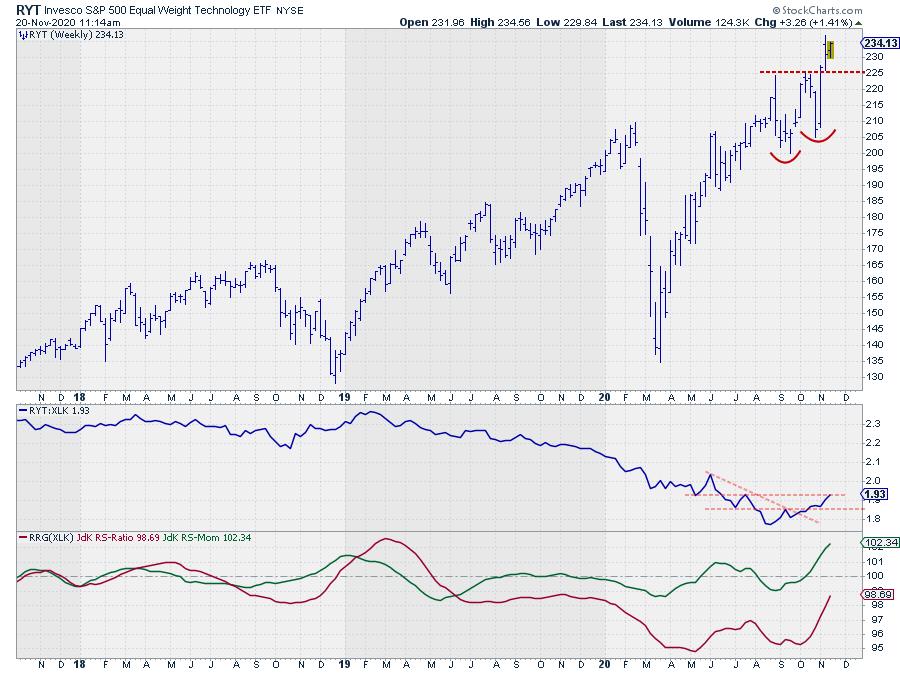
The chart above again shows the RYT price chart, but now with relative strength and RRG-Lines against XLK. This relationship had been strongly in favor of XLK since early 2019, but has now started to turn around, with the RS-Line coming out of a low and breaking the first short-term resistance levels while RRG-Lines are rapidly improving.
All in all, it looks as if the improvement for RYT vs XLK has only just begun, and it proves that sometimes you need to change lanes in order to stay on the right track.
#StaySafe, --Julius
My regular blog is the RRG Charts blog. If you would like to receive a notification when a new article is published there, simply "Subscribe" with your email address.
Julius de Kempenaer
Senior Technical Analyst, StockCharts.com
Creator, Relative Rotation Graphs
Founder, RRG Research
Host of: Sector Spotlight
Please find my handles for social media channels under the Bio below.
Feedback, comments or questions are welcome at Juliusdk@stockcharts.com. I cannot promise to respond to each and every message, but I will certainly read them and, where reasonably possible, use the feedback and comments or answer questions.
To discuss RRG with me on S.C.A.N., tag me using the handle Julius_RRG.
RRG, Relative Rotation Graphs, JdK RS-Ratio, and JdK RS-Momentum are registered trademarks of RRG Research.
