TAKEAWAYS
- Broader stock market indexes fall sharply on Fed minutes
- Treasury yields continue to rise
- S&P 500 index closes below its 50-day moving average

Better-than-expected earnings from Target (ticker symbol: TGT) and TJX Cos (ticker symbol: TJX), as well as better-than-expected US industrial output, threw some optimism into a market that was looking grim. But the Fed minutes didn't do much to help. Investor sentiment turned more pessimistic as the Fed indicated that inflation was still a concern.
Technical Perspective of the S&P 500 Index
When the S&P 500 index ($SPX) falls below its 50-day simple moving average (SMA) after it has been trading above it for about five months, investors get concerned and are left wondering if the index will fall further, whether they should sell their stocks, or if they should just hold on to them and hope this is just temporary.
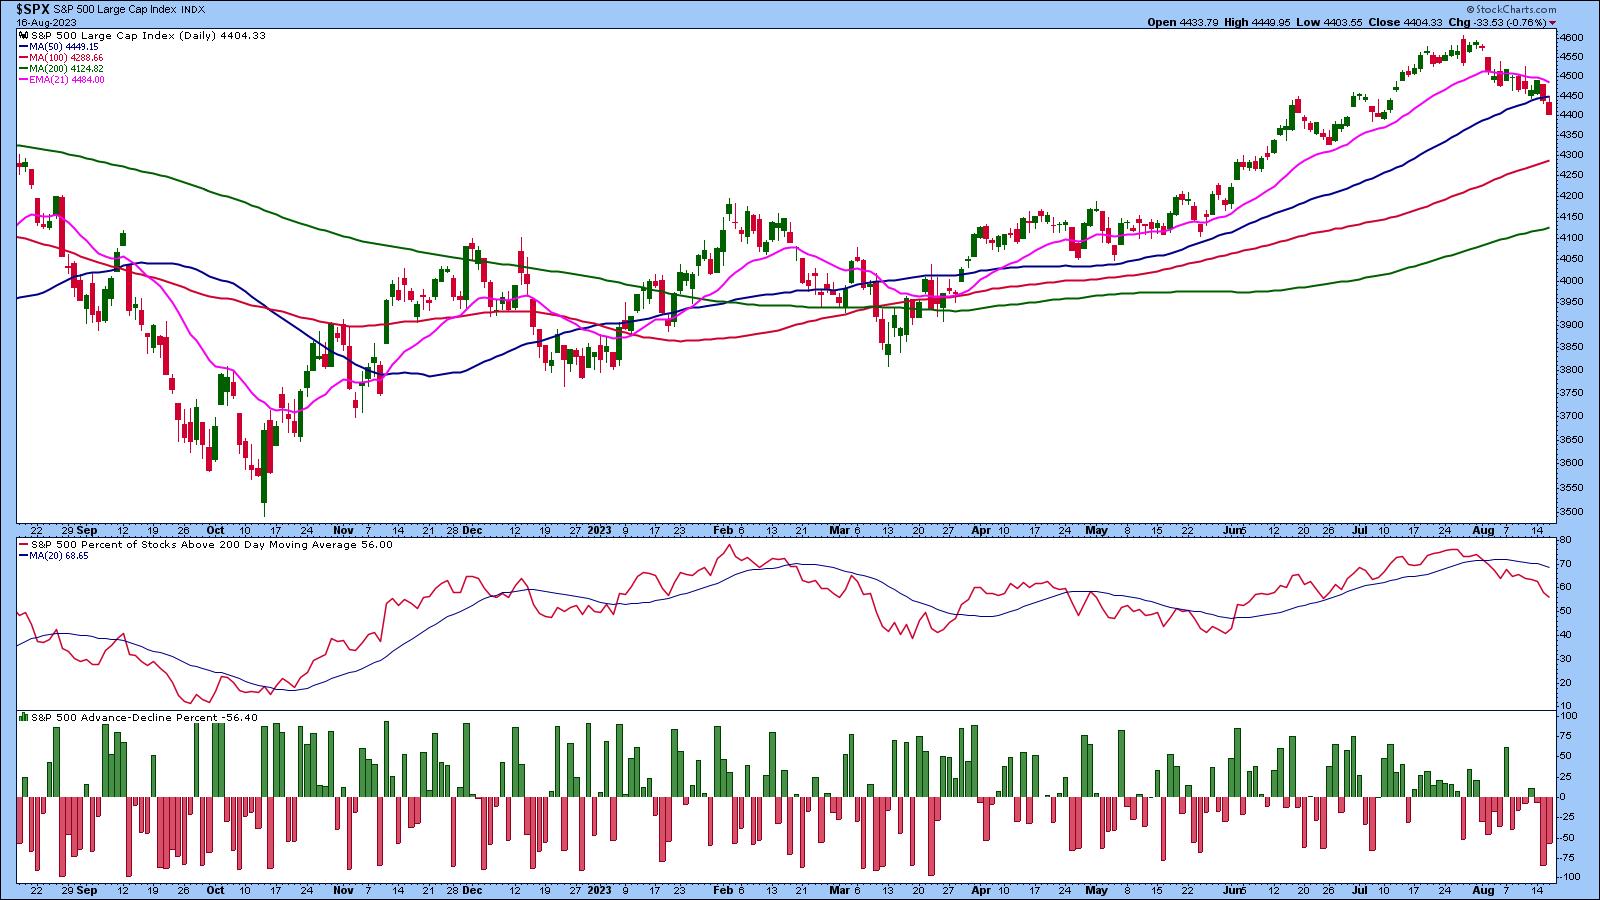
CHART 1: S&P 500 INDEX CLOSES BELOW ITS 50-DAY SIMPLE MOVING AVERAGE. Market internals are also indicating weakness, which could mean equities could fall further.Chart source: StockCharts.com (click chart for live version). For educational purposes.
In addition to the S&P 500 index trading below its 50-day SMA, the percentage of stocks in the index trading below the 200-day moving average is just above 50%. And the S&P 500 Advance-Decline Percent is in negative territory. That Wednesday's high was below the 50-day SMA suggests a greater probability of the S&P 500 index closing lower for the week.
Treasury Yields Rise
When the broader equity indexes fall, it's worth paying attention to Treasury yields. If you pull up the chart of the 10-Year US Treasury Yield Index ($TNX), you'll notice it's been trending higher; it's at its November 2022 levels and has the potential to rise to its October 2022 levels. The $TNX closed near its high on Wednesday, showing a good probability of a continued move higher. If yields continue to rise, investors will hesitate to invest in stocks.
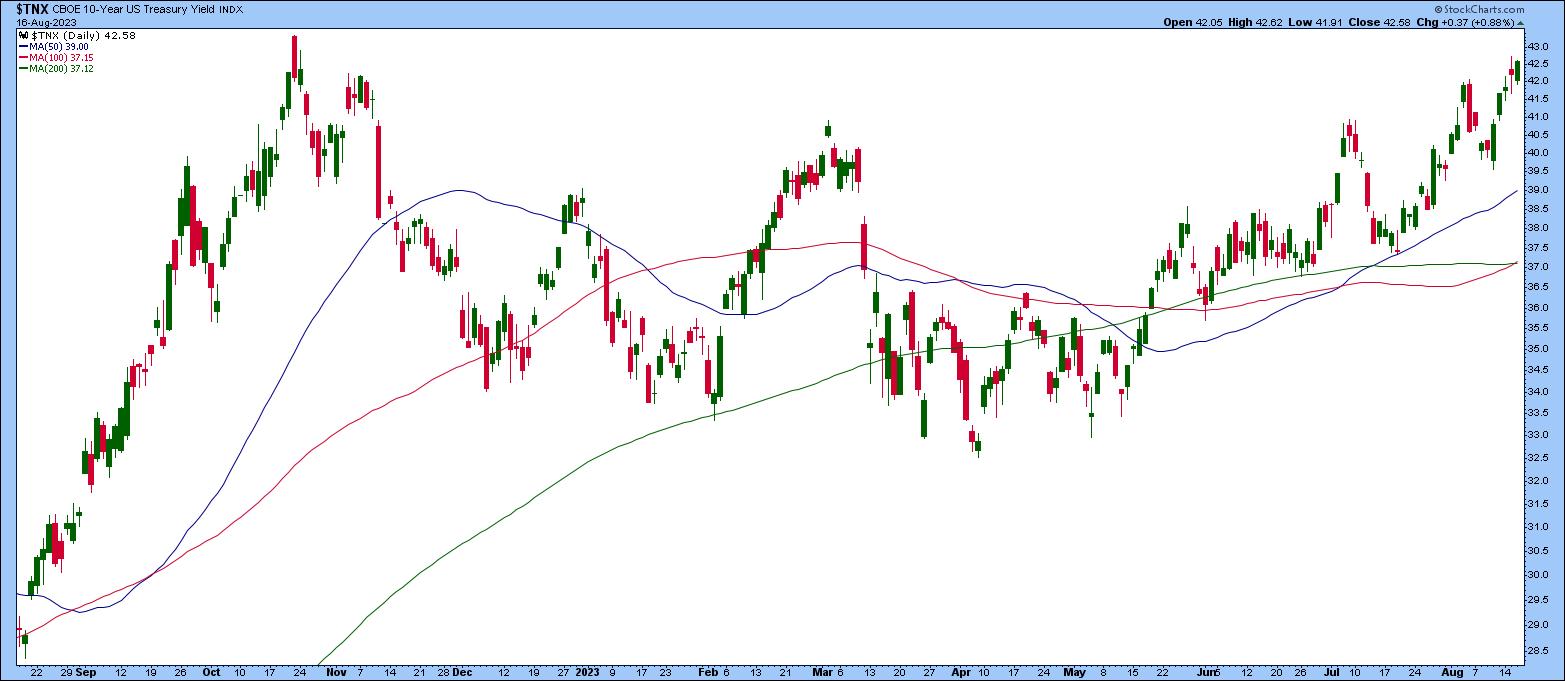
CHART 2: 10-YEAR US TREASURY YIELD INDEX TRENDS HIGHER. As yields rise, investors will shy away from investing in growth stocks.Chart source: StockCharts (click chart for live version). For educational purposes.
Strong retail numbers and better-than-expected industrial production indicate the US economy is still strong, and inflation is coming down. At least, that's what more recent economic data is suggesting.
This isn't necessarily a negative scenario, given that other countries are still facing higher inflation and are likely to raise interest rates further. During a conversation between Raphael Bostic, President & CEO of the Federal Reserve Bank of Atlanta, and Ed Bastian, CEO of Delta Airlines, Bostic mentioned that the Fed's job is to ensure that monetary policy sets the economy on an even trajectory. And if the Fed does it well, there will be more economic prosperity. It's no wonder investors pay attention to what the Fed says.
The Fed minutes on Wednesday indicated that inflation is still a concern and there could be further monetary policy tightening in the future. This wasn't exactly music to the market's ears. Equity indexes fell slightly on the news, and Treasury yields rose—pretty much the same as pre-Fed minutes, as the Fed takes a "wait and see" approach. The broader equity indexes moved up and down without directional commitment, but closed sharply lower.
As long as the trend in Treasury yields remains as is, growth stocks may gain less attention than they have in the more recent past. But that doesn't necessarily mean you should shy away from equities. There are so many different asset groups, after all.
Where Should You Invest?
If you've invested in the market for a while, you know that, when the overall equity market moves lower, it doesn't necessarily mean every market segment is heading lower. There are always opportunities in the market. This is why checking Your Dashboard should be a part of your trading routine.
Scrolling through the Market Summary gives you a quick overview of the overall market. Identifying which areas are green in a sea of red is easy. Try to see if you can spot some anomalies. The Sector Summary is a great way to see which sectors and industries are performing better than others, and the SCTR Report shows technically strong stocks.
And at a time when just about everything looks weak, except for maybe the CBOE Volatility Index ($VIX), it may be time to take some profits off the table and wait it out. Remember, managing your risks is the key to becoming a great trader.

Disclaimer: This blog is for educational purposes only and should not be construed as financial advice. The ideas and strategies should never be used without first assessing your own personal and financial situation, or without consulting a financial professional.
Happy charting!
