TAKEAWAYS
- Stock market was hit hard by China's economic woes but rebounded
- Technology and Communication Services sectors were hit hard this week
- Bitcoin shares fall to June levels

This week's stock market activity gave us an unpleasant reminder of how equities can turn on a dime. The possibility of further interest rate hikes from the Federal Reserve and China's economic woes were the main reasons for the sharp selloff we saw after the S&P 500 index ($SPX) broke below its 50-day moving average.
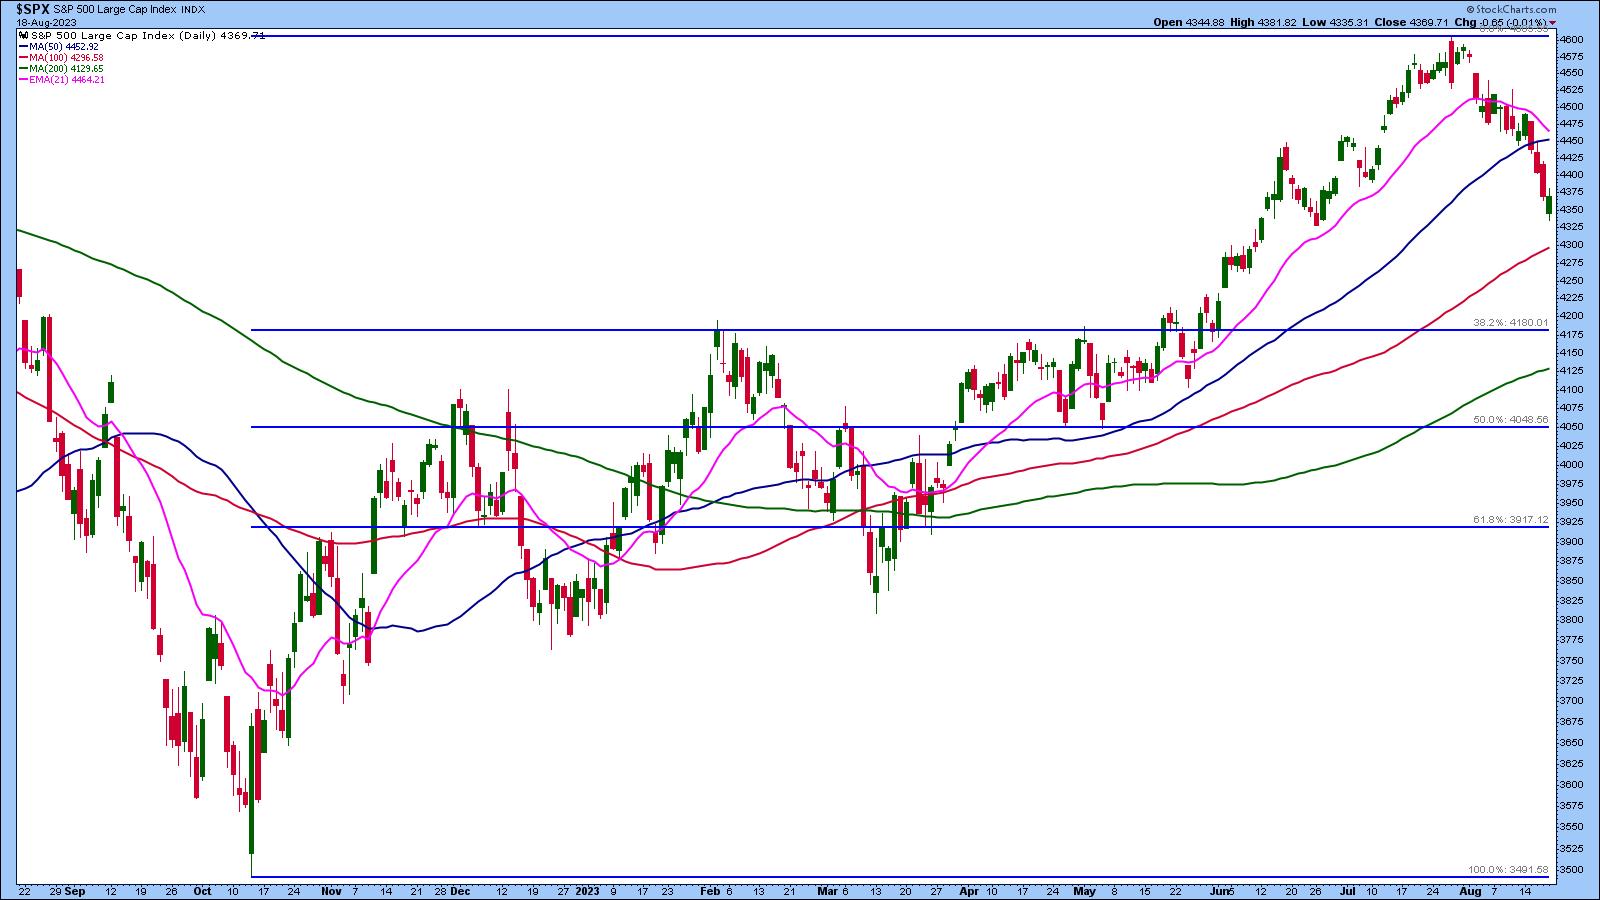
CHART 1: DAILY CHART OF S&P 500 INDEX. After falling below its 50-day moving average, $SPX has been in free fall. It remains to be seen if today's rebound will reverse the trend.Chart source: StockCharts.com (click chart for live version). For educational purposes.The US Dollar ($USD) and volatility ($VIX) have shown signs of life after a relatively long hibernation. VIX went as high as its 200-day moving average before retreating.
The ripple effects were felt in Asian and European markets. Evergrande's filing for bankruptcy protection in the US hurt China's real estate sector. According to a Barron's report, the real estate industry makes up about 30% of China's GDP. Another real estate company, Country Garden Holdings, will no longer be listed on the Hang Seng Index after it showed signs of distress—losses and missed payments.
And it's not just the real estate sector feeling the pain. Stocks like Alibaba (BABA), JD.com (JD), and Baidu (BIDU) all slumped.
US Feels the Side Effects
The weakness in China's technology stocks spilled over into the US stock market. The Technology and Communication Services sectors were hit pretty hard this week, although Tech ended up being the best-performing sector from a weekly perspective. The weekly chart of the Technology Select Sector SPDR (XLK) below shows three straight lower weeks. The 20-week moving average could be a support level for XLK.
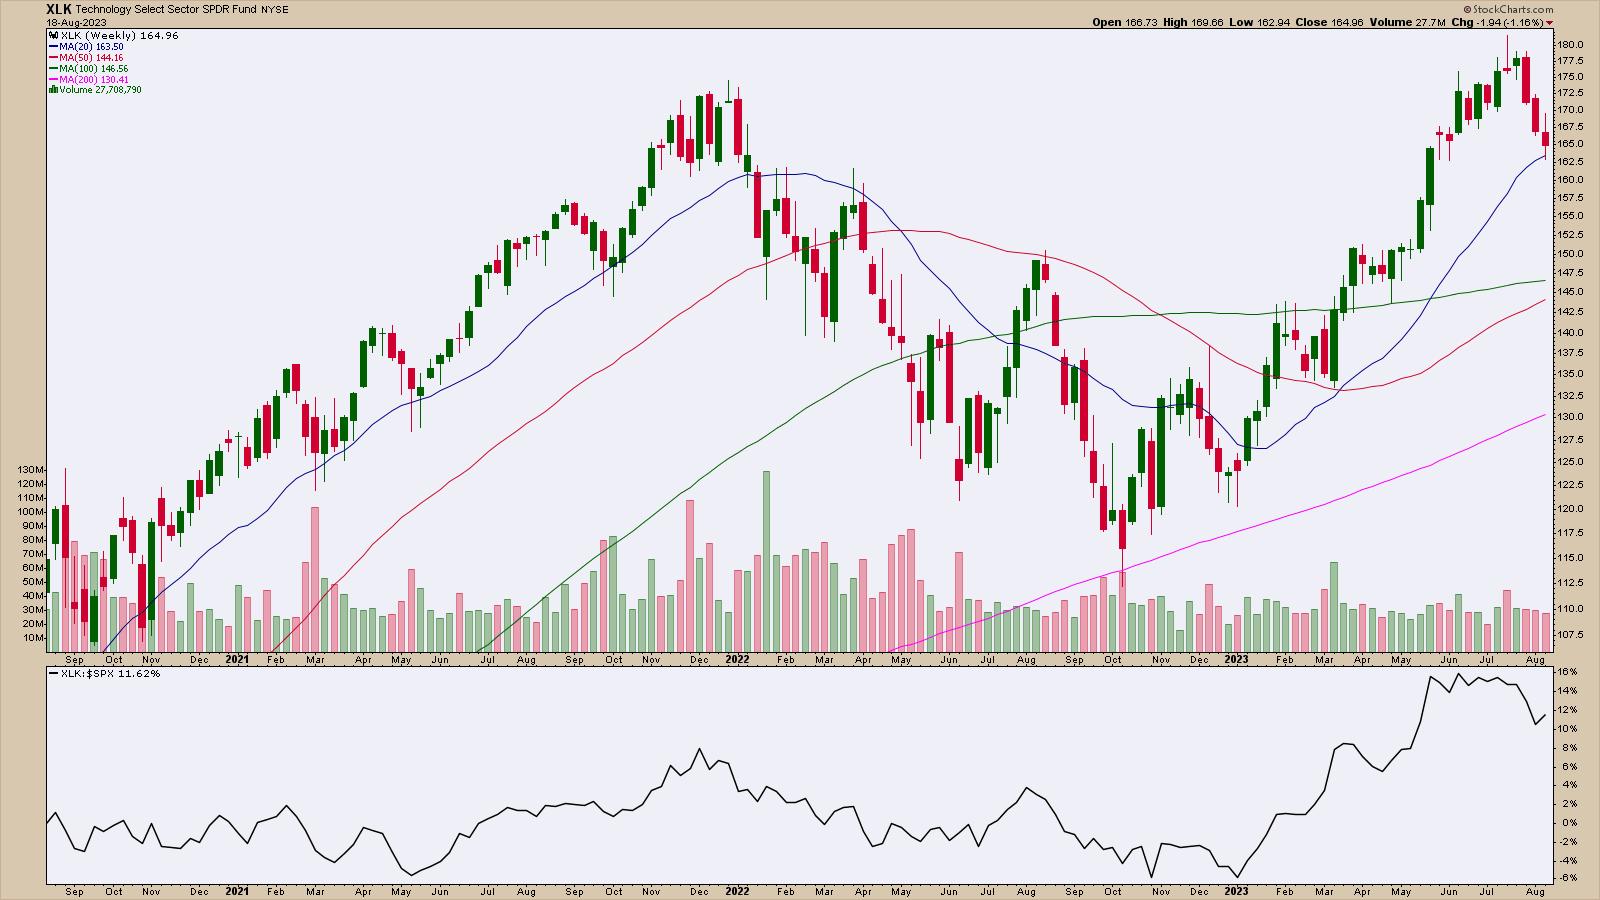
CHART 2: TECHNOLOGY SELECT SECTOR SPDR (XLK) FALLS FOR THREE STRAIGHT WEEKS. Will XLK bounce off its 20-week moving average or will the ETF's value decline further? It all depends on investor expectations next week. Chart source: StockCharts.com (click on chart for live version). For educational purposes.
The Magnificent Seven Stocks—Tesla (TSLA), Apple (AAPL), Amazon (AMZN), NVIDIA (NVDA), Microsoft (MSFT), Alphabet (GOOGL), and Meta (META)—may be losing their status symbol. They are all lower for the week.
It almost seems like yesterday when these seven stocks propelled the S&P 500 to its 52-week highs. Investors were looking for the index to reach its October 2022 all-time high. That's the reality—anything can happen in the market when you least expect it.
On the flip side, energy stocks are on the rise. The Energy Select Sector SPDR (XLE) is bouncing off its 20-day simple moving average. XLE has a high StockCharts Technical Rank (SCTR) score, and its relative strength against the S&P 500 index is trending higher.
Things Ain't Great in Cryptoland Either
Did Elon Musk's decision to sell Bitcoin ($BTC) spur the massive selloff? It may have something to do with it, but since Bitcoin's price took a hard hit, there may be other reasons for the selloff in the crypto market. Looking at the chart of $BTCUSD, it looks like price may stay within the $25,000–$30,000 range, but if price falls below $25,000, it could go as low as $20,000, its next support level.
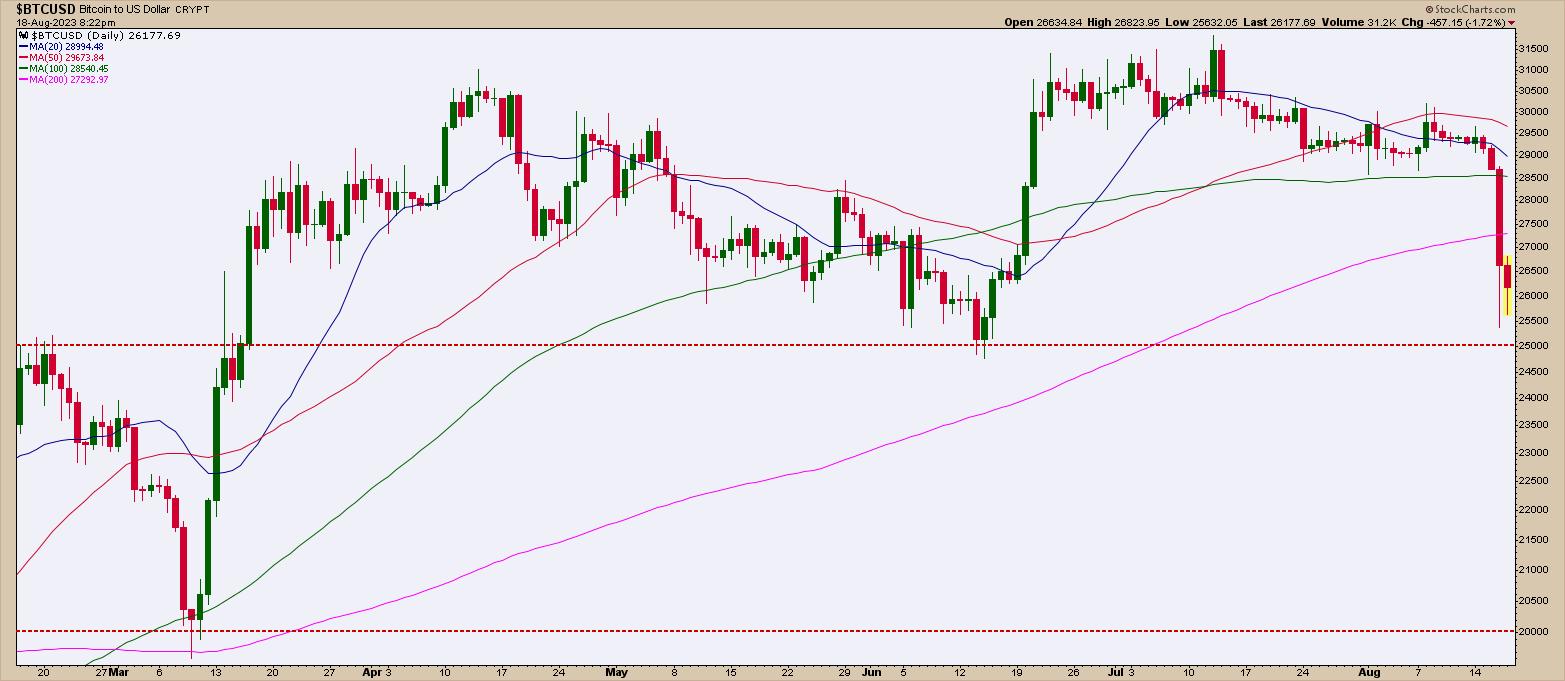
CHART 3: BITCOIN GETS CRUSHED AND APPROACHES SUPPORT LEVEL. After a massive price fall, Bitcoin could stay within a trading range between $25000 and $30,000. A break below $25,000 could be bearish, bringing Bitcoin's value to $20,000. Chart source: StockCharts.com (click chart for live version). For educational purposes.
The Perfect Storm

US Treasury yields trending higher, the possibility of further interest rate hikes by the Fed, China's economic troubles, and Bitcoin's selloff—it's enough to chew on before the market opens on Monday. After a rough week, seeing if buyers will enter the stage next week is worth watching. After what seemed as though it could be a horrifying end to the trading week, the major indexes closed well off their lows, and started moving higher during the last 15 minutes of the trading day. The return of the buyers could be a bullish sign at the end of a pretty grim trading week. The rebound off the lows suggests that the optimism could bring a little zip on Monday.
There's not much in economic data next week that investors are anxiously awaiting. So be sure to watch any support levels carefully and determine if there's enough momentum to make it worth buying the dip. It may also be worth putting the market aside for a couple days. Monday could bring surprises.
End of Week Wrap Up
US equity indexes mixed; volatility down
- $SPX down 0.01% at 4370.03, $INDU up 0.08% at 34501.88; $COMPQ down 0.2% at 13290.78
- $VIX down 3.52% at 17.26
- Best performing sector for the week: Technology
- Worst performing sector for the week: Consumer Discretionary
- Top 5 Large Cap SCTR stocks: Super Micro Computer (SMCI); Celsius Holdings (CELH); NVIDIA (NVDA); Eli Lilly (LLY); XP Inc. (XP)
On the Radar Next Week
- July existing home sales
- July new home sales
- July Durable Goods Orders
- Fed speeches
- Jackson Hole symposium kicks off
Disclaimer: This blog is for educational purposes only and should not be construed as financial advice. The ideas and strategies should never be used without first assessing your own personal and financial situation, or without consulting a financial professional.
Happy charting!
