TAKEAWAYS
- Large pools of "informed money" have a significant impact on price movements in the market
- The Williams Money Flow Index is designed to reveal "institutional" buying and selling activity that may sway the longer-term price direction
- The Williams Money Flow Index can be applied to daily or weekly charts with values indicated by two horizontal lines

When stocks embark on a strong and sustained uptrend or downtrend, you can attribute a large portion of that momentum to the actions of the big institutional players, or what Larry Williams calls the "informed money."
The Advantage of "Informed Money"
It's a good idea to keep an eye on what the "informed money" traders are doing, if only for two advantages they hold over the crowd: one, a sizable store of capital that's capable of moving stock prices over time, and, two, more access to information and analysis that's generally beyond the public's capacity.
Ok, I Get It. But How Can You Track Institutional Trades?
Trying to do this on your own might require more research time than you've got, especially regarding stocks. In the commodity futures market, you can at least look at the weekly Commitment of Traders (COT) report released by the Commodity Futures Trading Commission (CFTC).
The COT report is a weekly publication that shows the net positions of commercial traders, hedge funds, and retail investors in the futures markets. Larry Williams has been using this report for decades, interpreting the data and transforming it into a tradable algorithm. Fortunately, he found a correlative method to transfer this analysis into the stock market, making it useful for anyone who trades stocks rather than commodities.
Enter the Williams Money Flow Index.
What Does the Williams Money Flow Index Tell Us?
The Williams Money Flow Index visually illustrates institutional buying and selling. Williams often emphasizes that institutional players don't buy like the public. They have their reasons and methods to buy and sell. Sometimes, this can work contrary to popular thinking. And it's these periods that you'll want to pay attention to.
Take a look at the chart below.
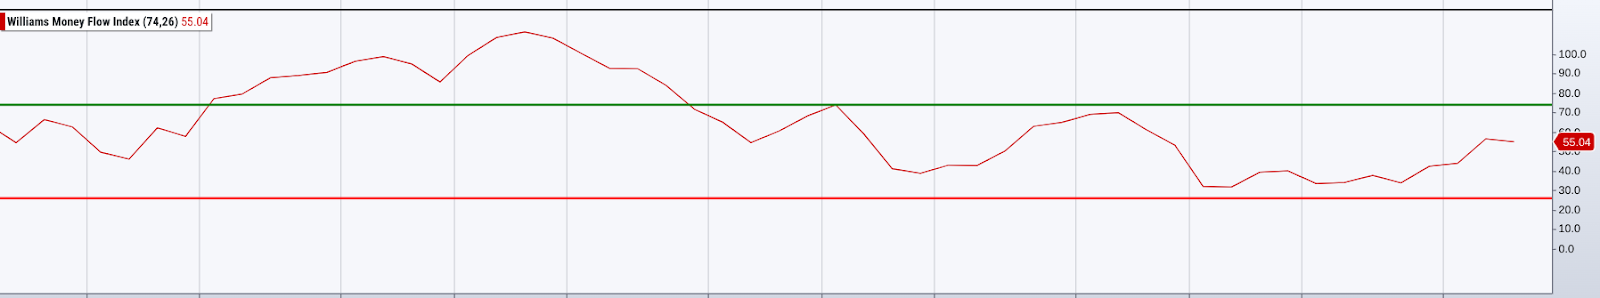
CHART 1: THE WILLIAMS MONEY FLOW INDEX OSCILLATES WITHIN A RANGE. Generally, the indicator oscillates between zero and 100, although sometimes it can exceed the 100 level.Chart source: StockChartsACP. For educational purposes.
The Williams Money Flow Index looks like a typical oscillator ranging from 0–100 (though the index can exceed the 100 level, unlike some oscillators). There are two lines: a green line situated at 74 and a red line situated at 26.
- When the index exceeds the green line, it indicates strong institutional buying, which, in turn, hints at a potential rally. This signals a potential "buy."
- Conversely, when the index falls below the red line, it indicates strong institutional selling, suggesting a potential price dip. This signals a potential "sell."
What does this look like in action? Let's look at a weekly chart of Tesla, Inc. (TSLA) below.
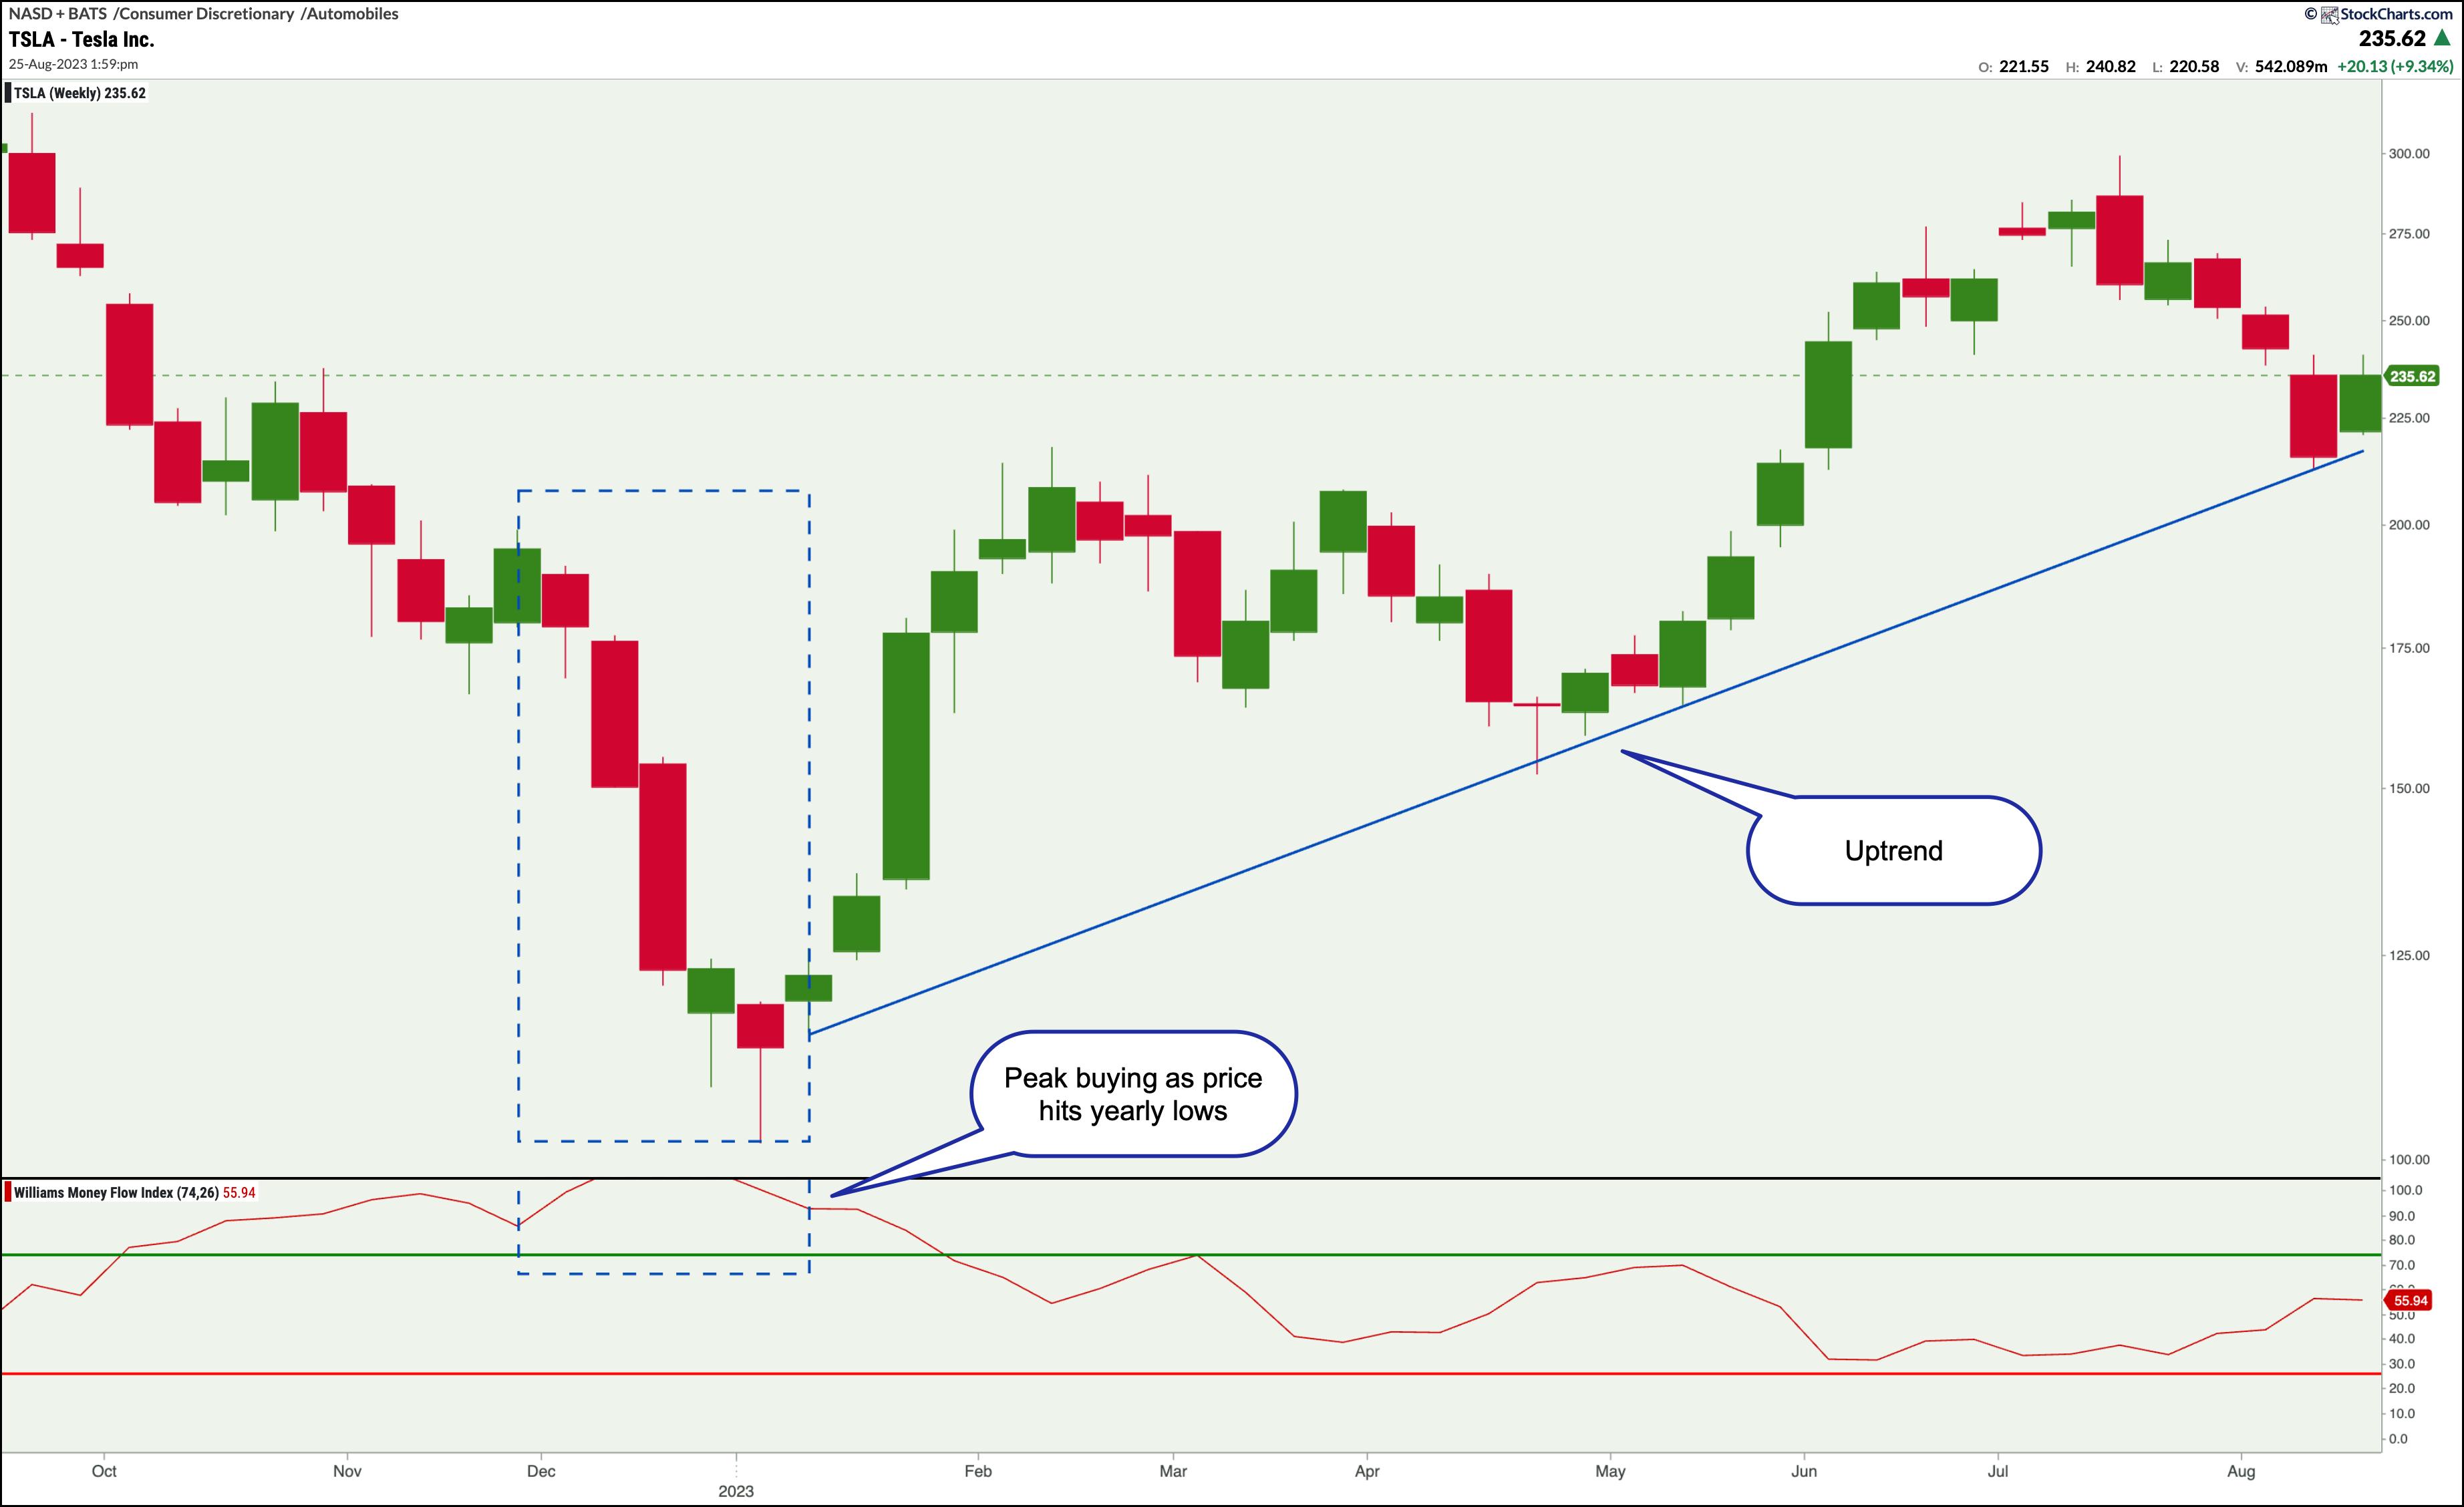
CHART 2: WILLIAMS MONEY FLOW INDEX IN ACTION. A sharp downtrend in price coincides with institutional buying. After this contrarian move, an uptrend ensued.Chart source: StockChartsACP. For educational purposes.
The chart shows a sharp downtrend coinciding with massive institutional buying, as illustrated in the LW Money Flow Index (two blue rectangles). This indicates that, while the public may have been selling TSLA stock, the "informed money" was buying it up. The outcome of this contrarian move is evident in the strong six-month uptrend that followed.
Can the LW Money Flow Index Work on Daily Charts?
If you've been following Larry Williams for some time, you know his penchant for longer timeframes. The reason is simple: the shorter the time frame, the more "market noise" (meaning insignificant fluctuations) you'll get. This is why many of his presentations feature weekly charts. He's after the "big move," which is, as you can guess, where the big profits are made.
With that said, Williams' Money Flow Index works for daily charts as well. Let's look at a daily chart for Microsoft (MSFT).
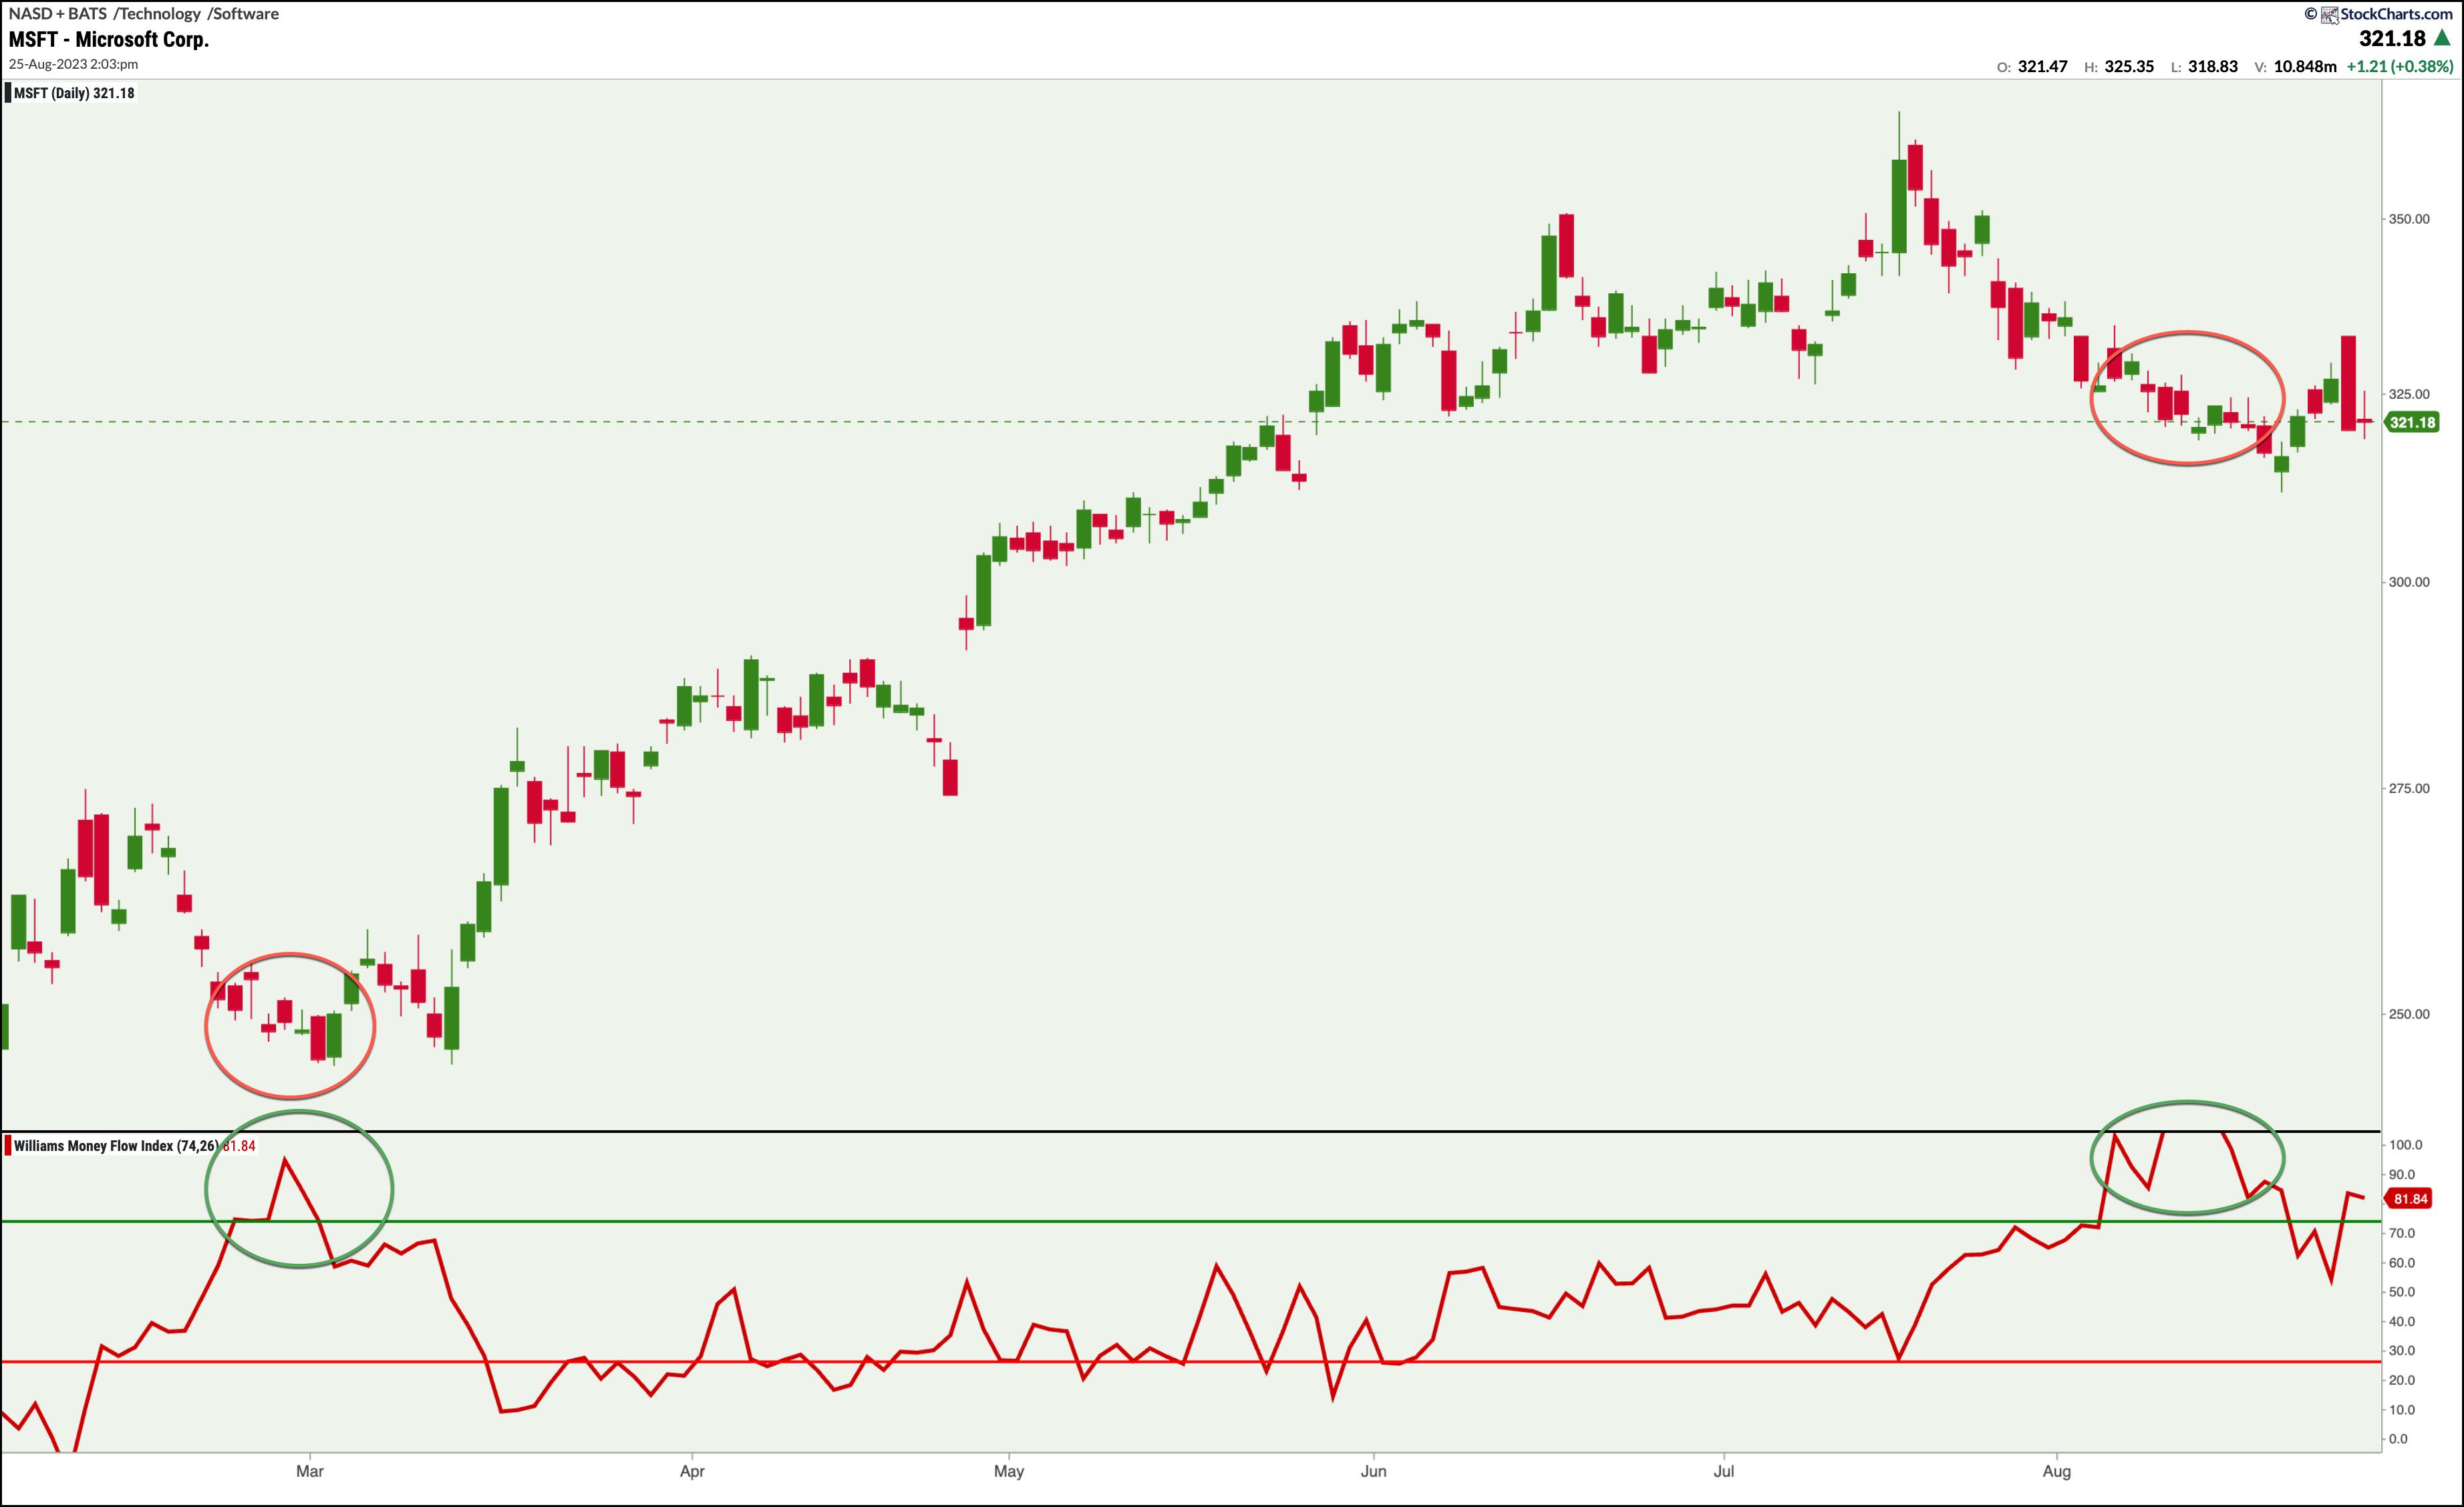
CHART 3: APPLYING THE WILLIAMS MONEY FLOW INDEX TO A DAILY CHART. A rise in the Williams Money Flow Index when price appears to be bottoming out is usually followed by an uptrend. Will this happen to MSFT?Chart source: StockChartsACP. For educational purposes.
The MSFT chart exhibits a dynamic similar to what took place in the weekly chart—a rise in the Williams Money Flow Index when price appears to be bottoming out (green and red circles illustrating the index and price action). In the MSFT example above, the institutional accumulation resulted in a four-month rally.
The second point of accumulation, toward the right of the chart, signals an even higher accumulation level as the index exceeds 100. This brings us to the present day (or the time of this writing). Will there be another multi-month rally?
A Few Caveats
So far, there's been no mention of the index line falling below the 26 level (red horizontal line), and it did a few times. If the above-mentioned scenarios are true—that the index line above 74 signals institutional accumulation and below 26 signals institutional distribution—then why didn't we address the instances wherein the line fell below 26?
Larry Williams is insistent about following the big moves, like extended price swings or longer-term trends. Big moves are where the "big money" is. You generally want to be on the right side of the market. In the MSFT example above, price was in a clear uptrend; because of this, there's no point in looking at bearish signals.
 Are there any other Larry Williams indicators you can use to enhance the Williams Money Flow Index? There are several, and you can check them out by visiting this page.
The Bottom Line
When it comes to catching large money moves in the market, it helps to observe what the "big players" are doing, since they play a heavy hand in moving prices. By keeping tabs on their activities, you can gain timely insights that the average trader will likely miss. The Williams Money Flow Index is one of the few tools that helps you observe what the institutional money is doing. And whether you decide to trade with or against the "informed money," you can at least see where they are, so to speak, and what they're doing. Happy trading!

Disclaimer: This blog is for educational purposes only and should not be construed as financial advice. The ideas and strategies should never be used without first assessing your own personal and financial situation, or without consulting a financial professional.