
What if you had access to a forecasting tool capable of predicting the most likely path prices may take roughly in the next three months? The caveat here is that it can't accurately pinpoint the peaks and troughs, but it can approximate them with relative accuracy.
This is essentially what market cycle methods or indicators attempt to do. Markets move in cycles; they have highs and lows. We also know that these cycles are consistent, though not always symmetrical. That last part is what makes their predictability aspect frustrating and unreliable.
As part of his suite of indicators designed to help you time market entries, Larry Williams developed the Williams Cycle Forecast, partly out of the same frustration many traders experience when adopting cyclical analysis to time the markets. Williams' indicator was designed differently.
Introducing the Williams Cycle Forecast
The Williams Cycle Forecast is a technical analysis indicator designed to anticipate and predict an asset's peak-and-trough cycles. On the daily chart, the forecast goes as far as three months into the future.
As its name suggests, the indicator homes in on the repetitive cyclical patterns that a stock (or any other financial asset) exhibits over time. The point of the indicator is to harness these cyclical patterns and predict probable price peaks (tops) and troughs (bottoms).
How does the Williams Cycle Forecast achieve this? Larry Williams took what he saw as the three most consistent short-term cycles and amalgamated them into a single cycle. This approach, he believes, ensures a balanced interplay between the three, offering a more reliable price projection over the subsequent three months.
How Do You Interpret the Williams Cycle Forecast?
First, look at the peaks and troughs. Note how the price aligns (sometimes roughly, other times more accurately). Note that the peaks, troughs, and movements to and fro were forecasted up to three months in advance.
After you identify these alignments, be sure to look ahead on the chart. Are there any particular patterns, trend continuations, or reversals that can help you anticipate buy or sell points in the weeks ahead? Let's look at a few examples.
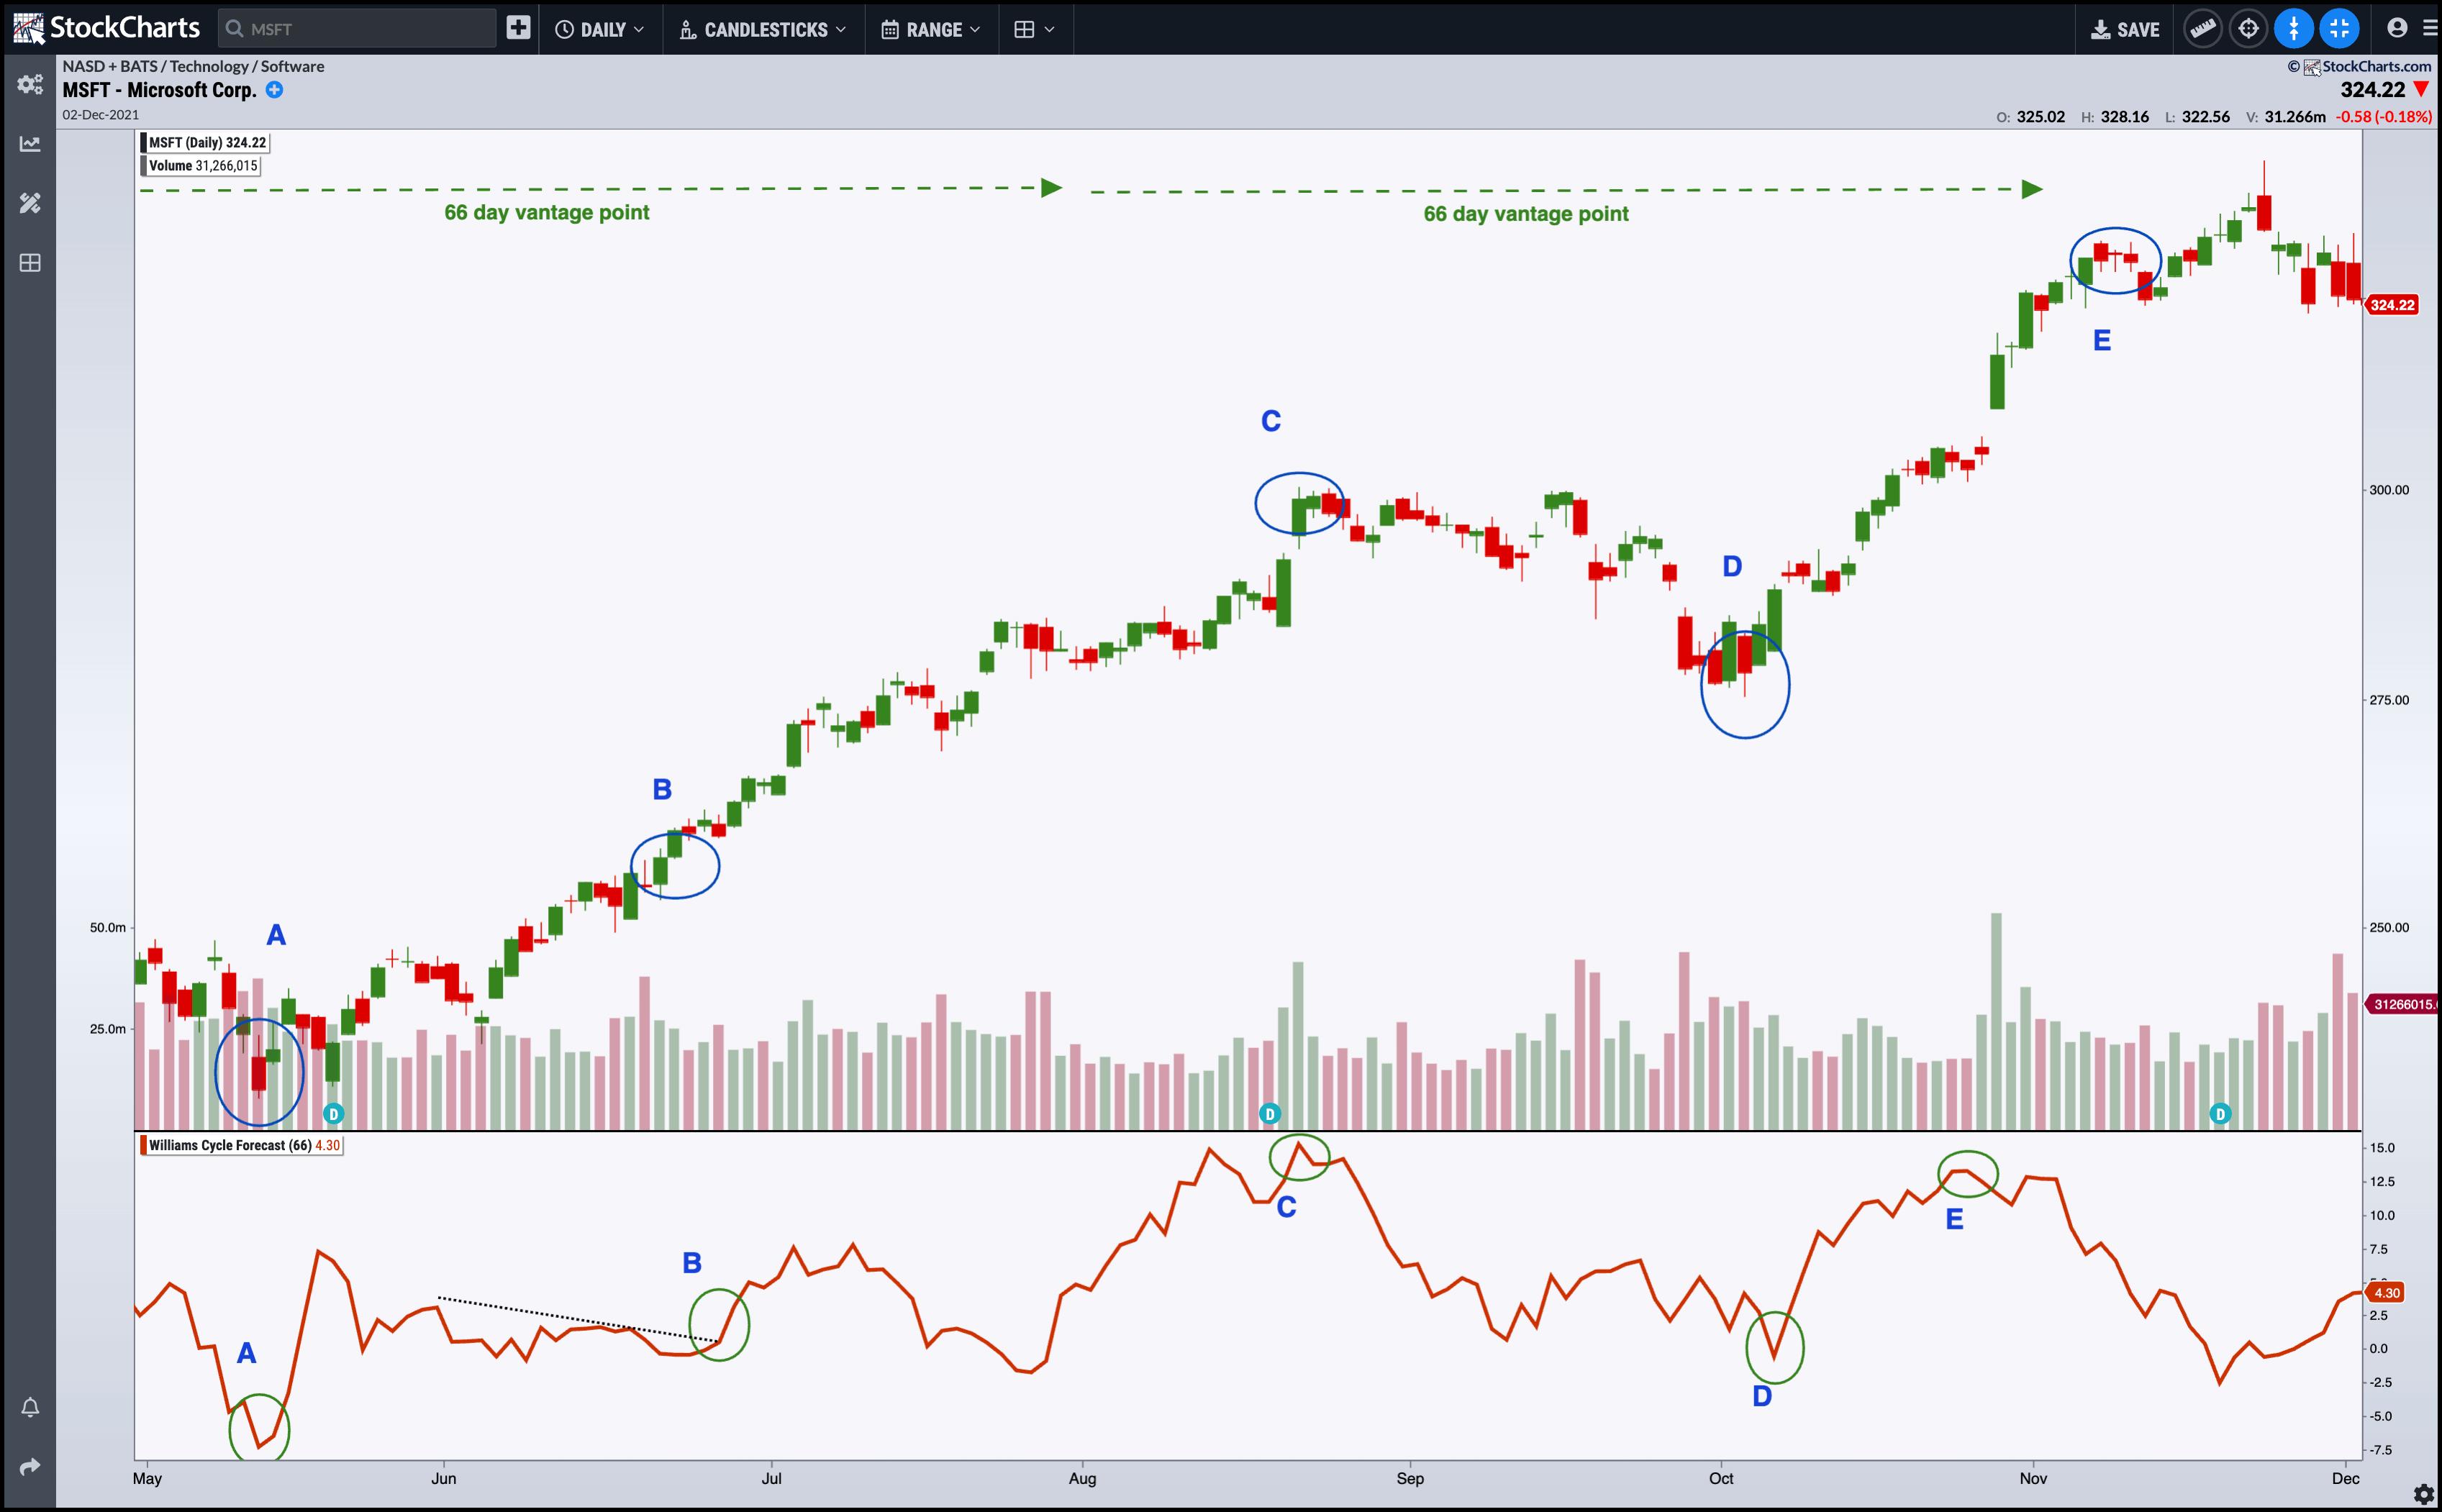
CHART 1: MICROSOFT (MSFT) DAILY CHART SHOWING CORRELATION BETWEEN PRICE AND FORECAST. Chart source: StockChartsACP. For educational purposes.
Note the Vantage Points
First, look at the top green arrows marking the "vantage points" of each observation period in May and August. At each point, all you could see were the price predictions generated by the Williams Cycle Forecast.
Look at the Forecasts
Remember that market cycles are more "art" than "science." They're not always accurate. But, in this case, they approximate the price movements quite closely.
A— Back in May, the Williams Cycle Forecast called the bottom accurately. Remember, at this time, the forecast would have preceded the actual prices (which hadn't yet unfolded).
B— This marked a buy point based on a trend breakout in the Williams Cycle Forecast. It was a little late (as you could have entered earlier upon a price breakout), but still, not a bad approximation.
C— By the beginning of June, you would have seen a peak in a trend projected toward the end of August, after which a decline toward a periodic trough was soon to be projected.
D— The trough occurred, as predicted, right at the beginning of October. By then, another peak was projected by the end of the month.
E— The forecast approximated the peak in prices a little early, but still, that's what to expect when using market cycles to forecast prices. Again, it's about approximating market turns, not pinpointing them.
Still, cycles can be way off in trend direction, but relatively accurate in approximating the peaks and troughs that mark potential turns in the market.
Let's now look at an intraday chart, as the Williams Cycle Forecast also works well with intraday charts. The chart below is a 15-minute chart of Amazon (AMZN).
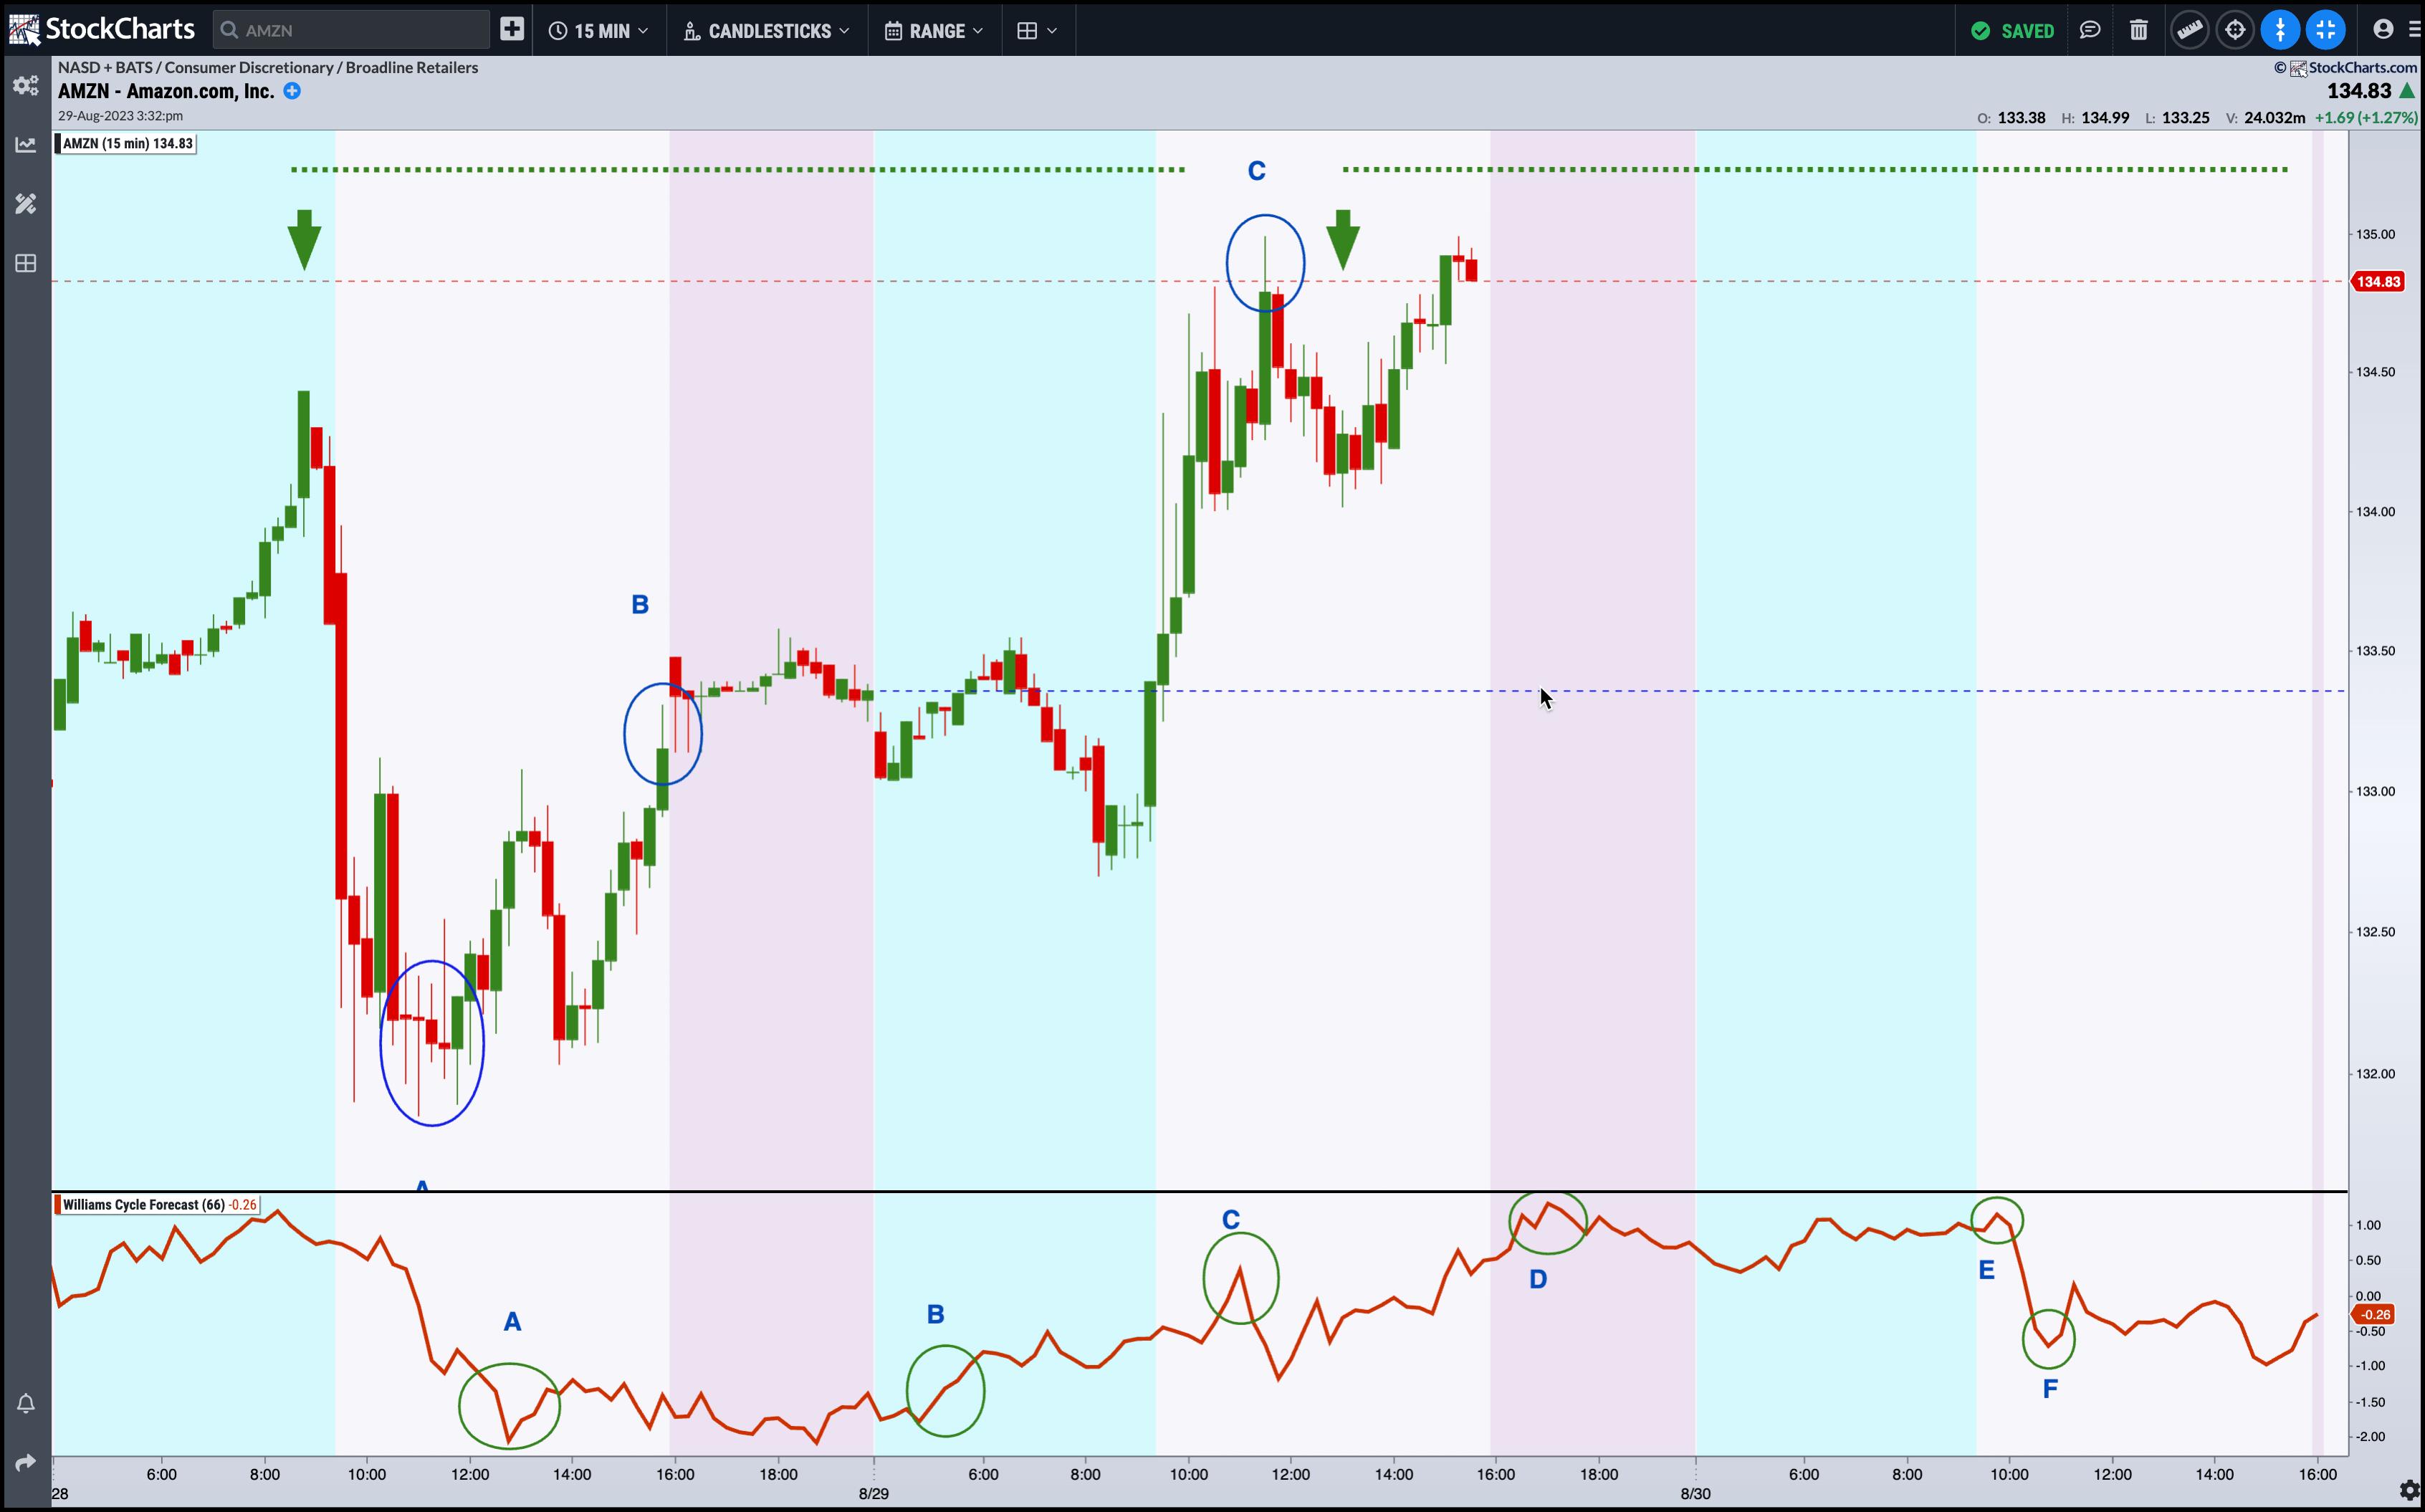
CHART 2: AMZN 15-MINUTE CHART. The chart displays the Williams Cycle Forecast 66 candles ahead of prevailing prices.Chart source: StockChartsACP. For educational purposes.
Note the two vantage points marked by the green arrows. The line following each arrow shows the 66-candle projection you would have seen during each vantage point. The last vantage point is current to the time of writing, and we can see the forecast ahead of prices.
Look at the Forecasts
A— The forecast called the bottom quite accurately.
B— This shows a buy point based on a breakout of the Williams Cycle Forecast trend. An earlier breakout in price (see the price chart above the indicator) would have been more effective; yet again, the cycle forecasts were not designed to pinpoint these triggers (there are other methods and tools to help you pinpoint market entries and exits).
C— From the first vantage point on the left, you would have seen a projection of an uptrend culminating in a peak. Would this have been helpful beforehand? Arguably, yes, it would have been, especially as prices began to decline a few candles after the initial starting point.
D, E, and F— Will we see a continued uptrend and a decline in the next 66 candles?
The Williams Cycle Forecast is a versatile tool if you apply it correctly. As you can see, it's suitable for daily and intraday charts, making it adaptable for different types of trading. By default, it operates on a time frame of 66 trading days, roughly three months. Note, however, that this default setting isn't rigid. You can modify this "displacement value" to find a cycle duration that best matches the particular stock you're examining.
The Bottom Line
The Williams Cycle Forecast is a unique tool you can use to anticipate potential peaks and troughs in the market. It's designed to provide a predictive framework that extends up to three months (or 66 candles). And it works for short-term to intermediate-term timeframes, making it versatile for various trading styles. While the tool doesn't guarantee precise market turn timings, it often does a decent job of approximating these shifts.
Some traders feel that's enough of an edge to aid their strategies. You'll have to decide for yourself whether that rings true for you as well. Remember that all market cycles lean more toward art than exact science. This means that it helps to use it in conjunction with other tools and methods. But if gaining access to an effective forecast indicator can help enhance your trading, as it does for Larry Williams, then it might be worth the cost to gain that extra edge. Happy trading!
Disclaimer: This blog is for educational purposes only and should not be construed as financial advice. The ideas and strategies should never be used without first assessing your own personal and financial situation, or without consulting a financial professional.