TAKEAWAYS
- Get a macro view of the market by analyzing the broader indexes
- Identify stocks which show a divergence between price and the Williams Insider Accumulation Index
- If accumulation is increasing and the stock price starts moving higher, it could be an ideal entry point

Whether you're bungee jumping or investing in the stock market, fear, uncertainty, and doubt can cause anxiety. The fear that inflation is still high and interest rates could rise, for example, makes investors further hesitant to invest in equities.
But have you considered looking at the macro view of the market? If you were to pull up a chart of any broad market index, you would find no signs of massive selling pressure. Even AI stocks, which pushed the market higher, have had a relatively modest pullback.
August may have been a disappointing month for the stock market, but the S&P 500 index ($SPX) remained above its 100-day simple moving average. The JOLTS report, which indicated that the number of job openings lowered, helped ease some investor anxiety and lifted the broader market higher.
But now we are approaching September, which, historically, has been one of the worst months as far as stocks go. Will there be a further pullback, or will the market continue rallying higher?
Hear What Larry Williams Has To Say
If you've been watching the StockCharts.com Larry Williams' "Family Gathering" webinars, you would have heard Larry saying that the bull market signal is still in play and the broader market is moving higher. So far, there are no indications of a bear market.
So, in a bull market, you want to get in when the market pulls back. We may have just had a pullback, or maybe not yet.
The Index Trifecta
Before deciding to enter a position (long or short), it's a good idea to get a macro view of the market.
The three broader market indexes—the Dow Jones Industrial Average ($INDU), S&P 500 ($SPX), and the Nasdaq Composite ($COMP)—are showing a similar pattern, rallying until July–August, then pulling back. Since mid-to-late August, the three indexes have been moving higher.
Going back to Larry Williams' cycle analysis, it's possible that the pullback will continue till mid-September and, from there, rally to the end of the year. Remember, September tends to be a weak month for stocks, so this scenario is possible. When and if it happens, it's good to be prepared to enter positions.
The Williams Insider Accumulation Index
There are many tools you can use to strategize when to enter positions. A great way is to keep tabs on what the insiders are doing. If you're considering buying stocks, the Williams Insider Accumulation Index can be helpful. You'll want to look for divergences between price action and the indicator. If the stock price is falling, but the indicator is rising, it's a good idea to pay attention to the stock.
How To Add the Williams Insider Accumulation Index to Your Charts
- In the StockChartsACP platform, enter a stock symbol in the symbol box.
- Scroll down the indicator list to the Larry Williams plug-in.
- Select Williams Accumulation Index.
For example, in the weekly chart of Meta Platforms (ticker symbol: META) below, when META's stock price was falling from April to October, the Williams Accumulation Index was trending higher. This would have indicated that institutional investors were accumulating the stock.
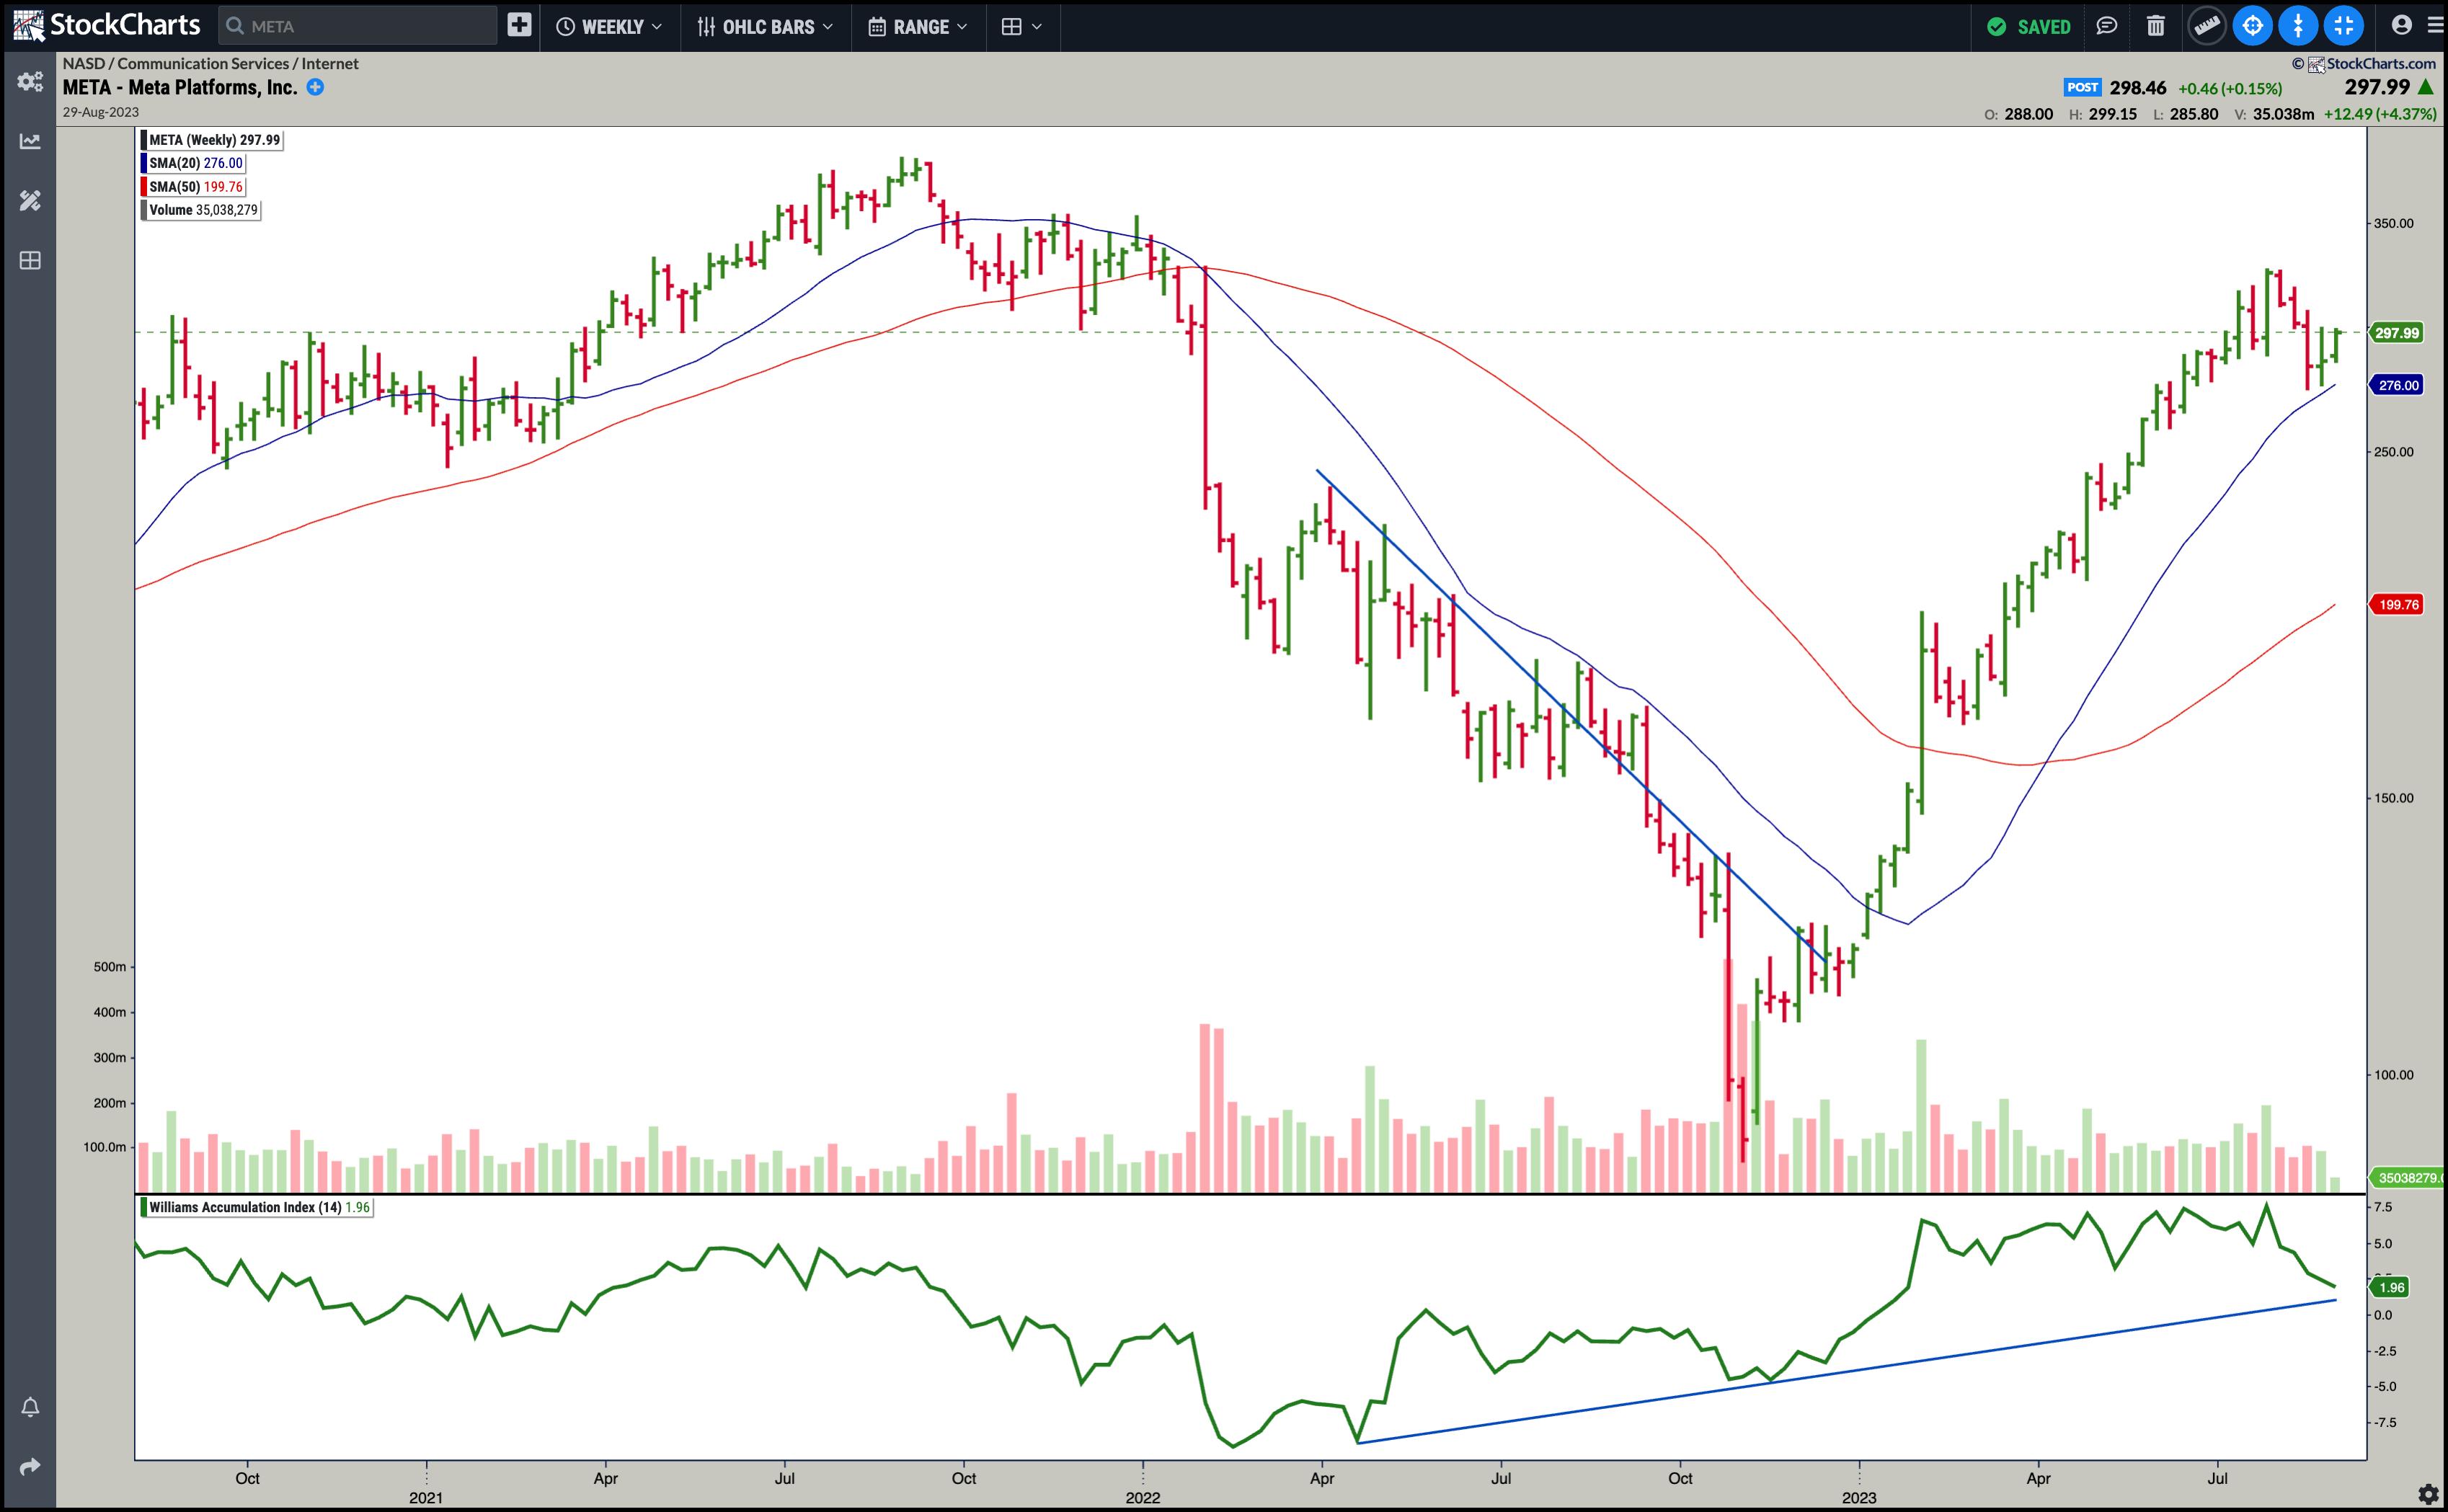
CHART 1: DIVERGENCE BETWEEN PRICE AND INDICATOR IN META. While META's stock price declined from April to October, the Williams Accumulation Index trended higher.Chart source: StockChartsACP. For educational purposes.
So, after the recent pullback, would it be a good time to jump into META? On the weekly chart, it's hard to say, since it looks like the accumulation is lessening. To make an entry or exit decision, it may be worth switching to the daily chart (see chart below).
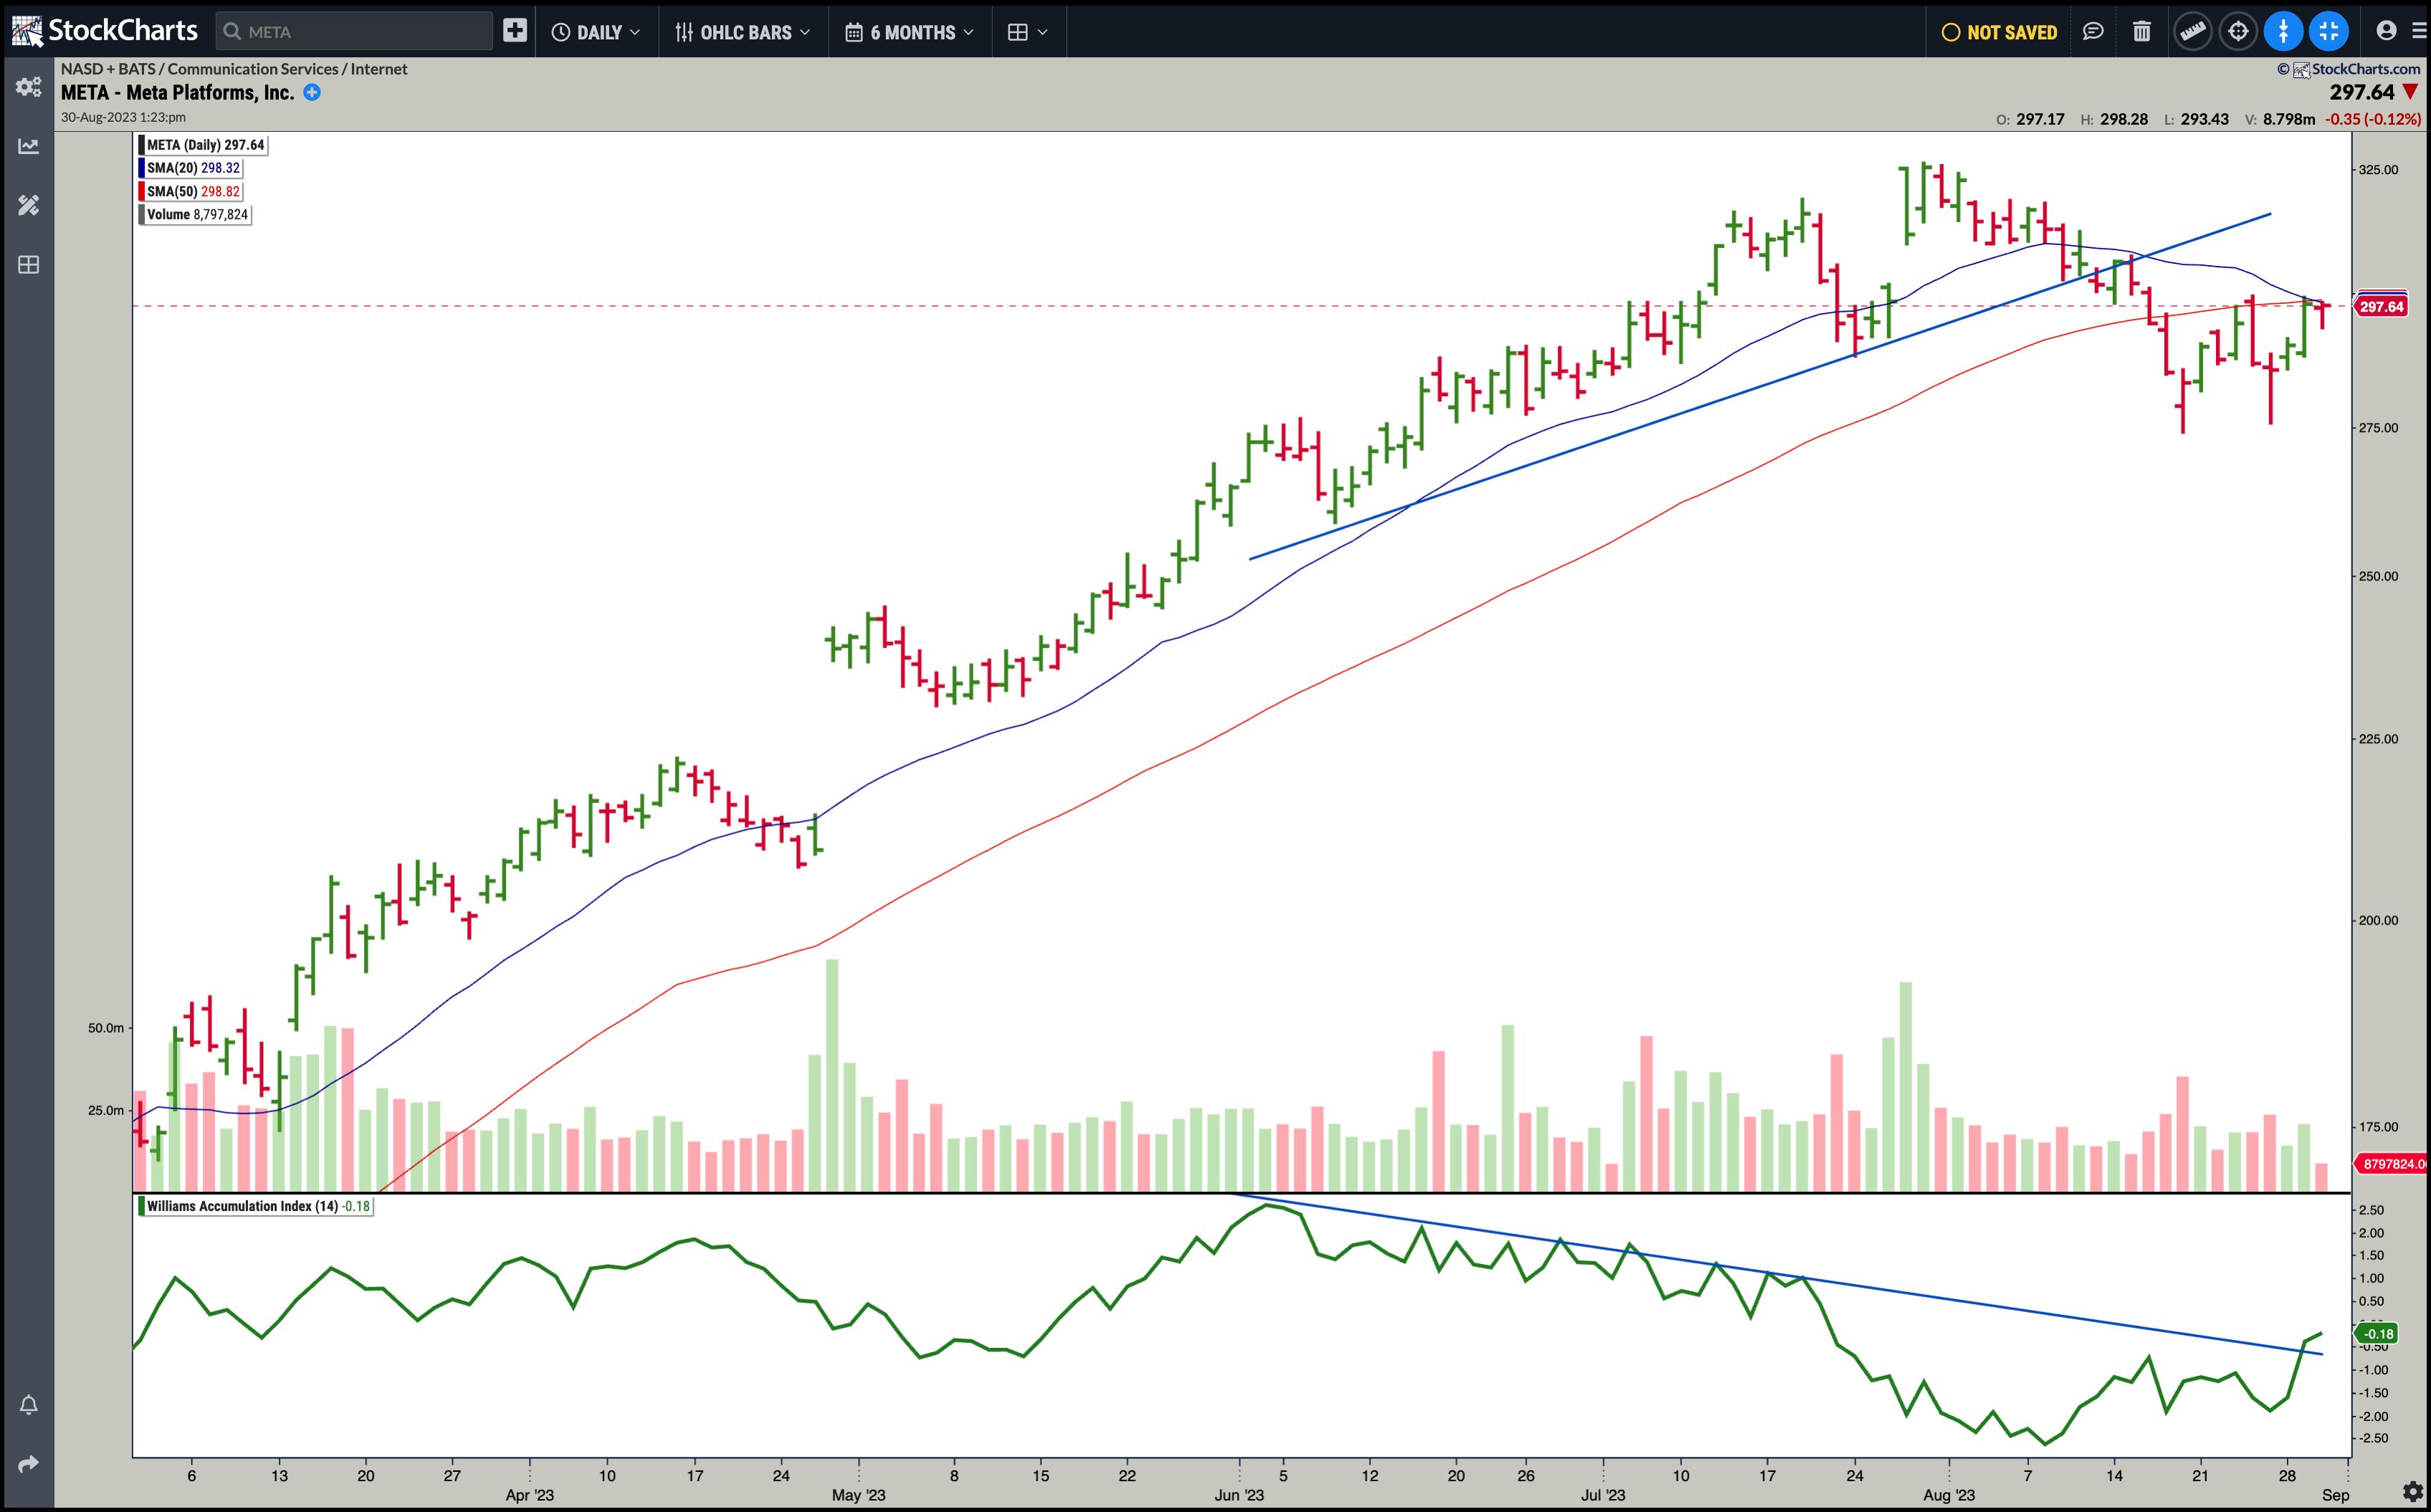
CHART 2: DAILY PRICE CHART OF META STOCK. The divergence between the price and Williams Accumulation Index would have indicated that the uptrend may weaken. After META broke below its upward-sloping trendline, the Williams Accumulation Index started moving higher. A potential trading opportunity?Chart source: StockChartsACP. For educational purposes.
The daily chart tells a different story. Between June and August, while the stock price was rising, the Williams Accumulation Index was trending lower. But since the stock price broke below its upward-sloping trendline, accumulation picked up slightly. The stock is now trading sideways. If the price breaks out above its 20- and 50-day moving averages and shows signs of trending higher, accompanied by an uptrend in the Williams Accumulation Index, it could present a viable long trading opportunity. It's something to watch for and, if you haven't done so yet, a stock to add to your ChartLists.
Let's look at another example. The weekly chart of AT&T (ticker symbol: T) shows that, in the last few months, the stock was in a relatively steep down move. However, after reaching a low in mid-July, the Williams Accumulation Index started rising. The last bar on the chart has a pretty wide range, but the volume is low.
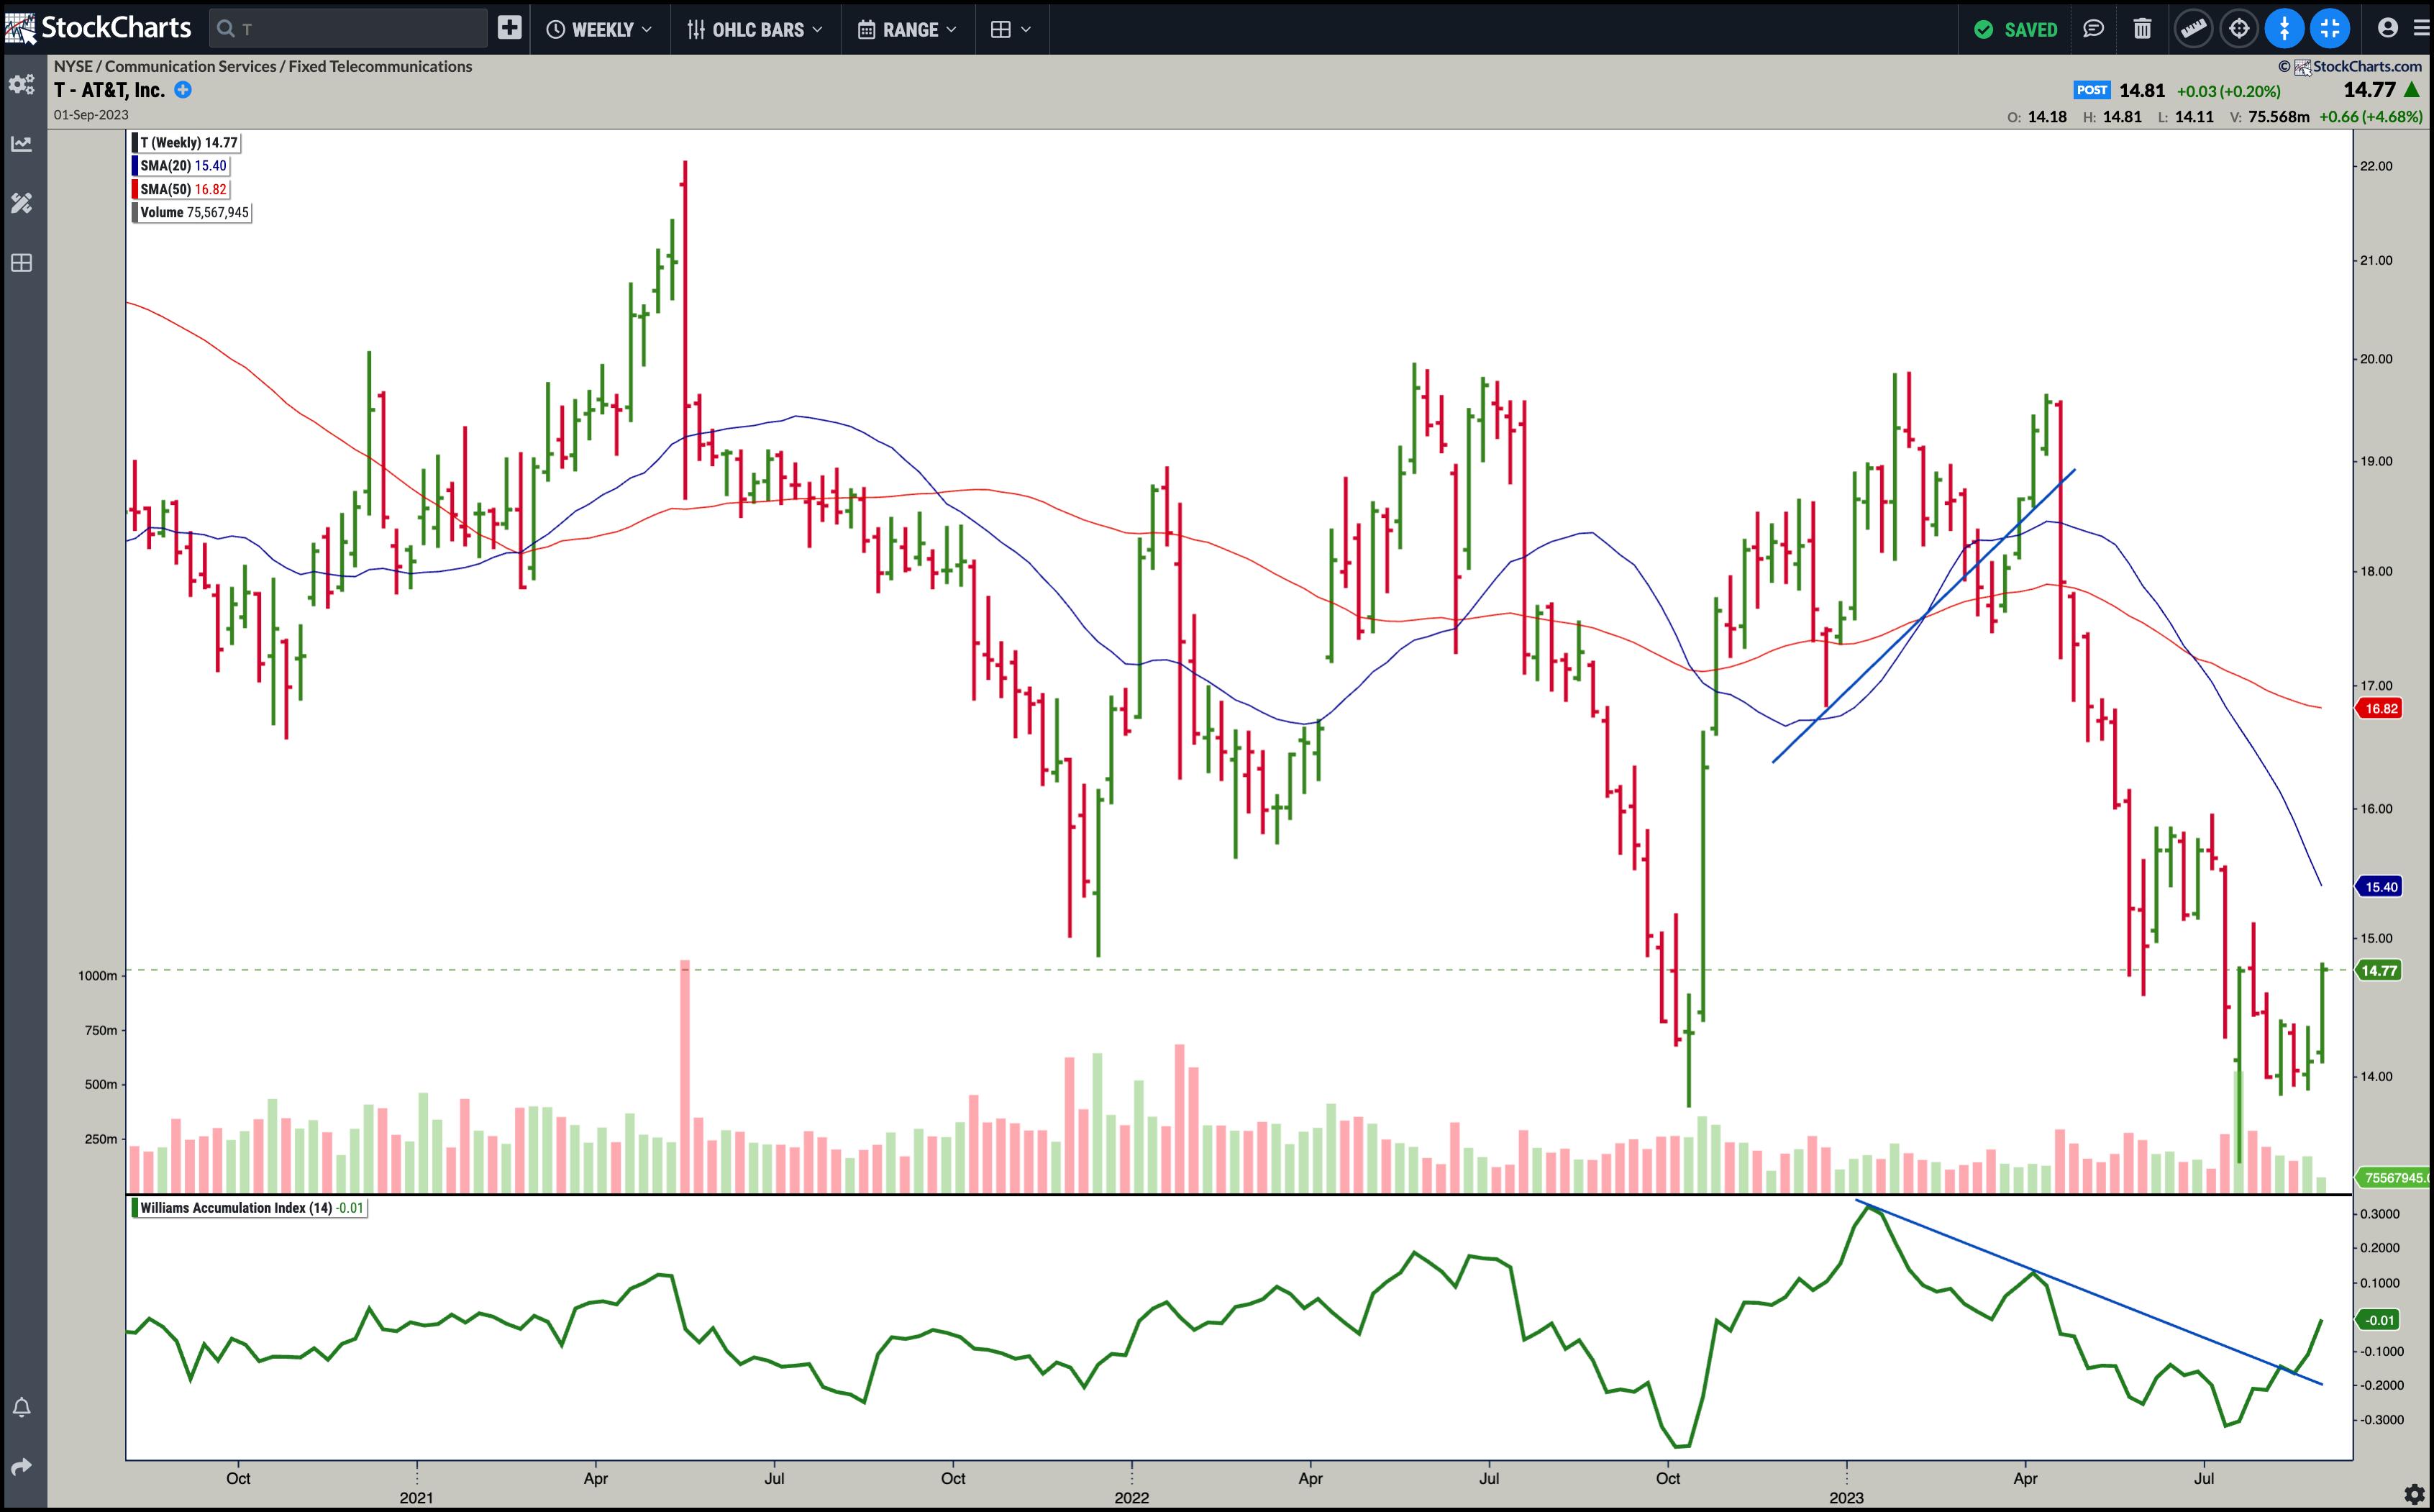
CHART 3: COULD THIS BE A TURNING POINT? After a steep fall, AT&T stock may be showing signs of recovery. Keep an eye on the Williams Accumulation Index to see if accumulation continues.Chart source: StockChartsACP. For educational purposes.
Switching to the daily chart, you can see that the Williams Accumulation Index has been rising in August, while the stock price was trading sideways.
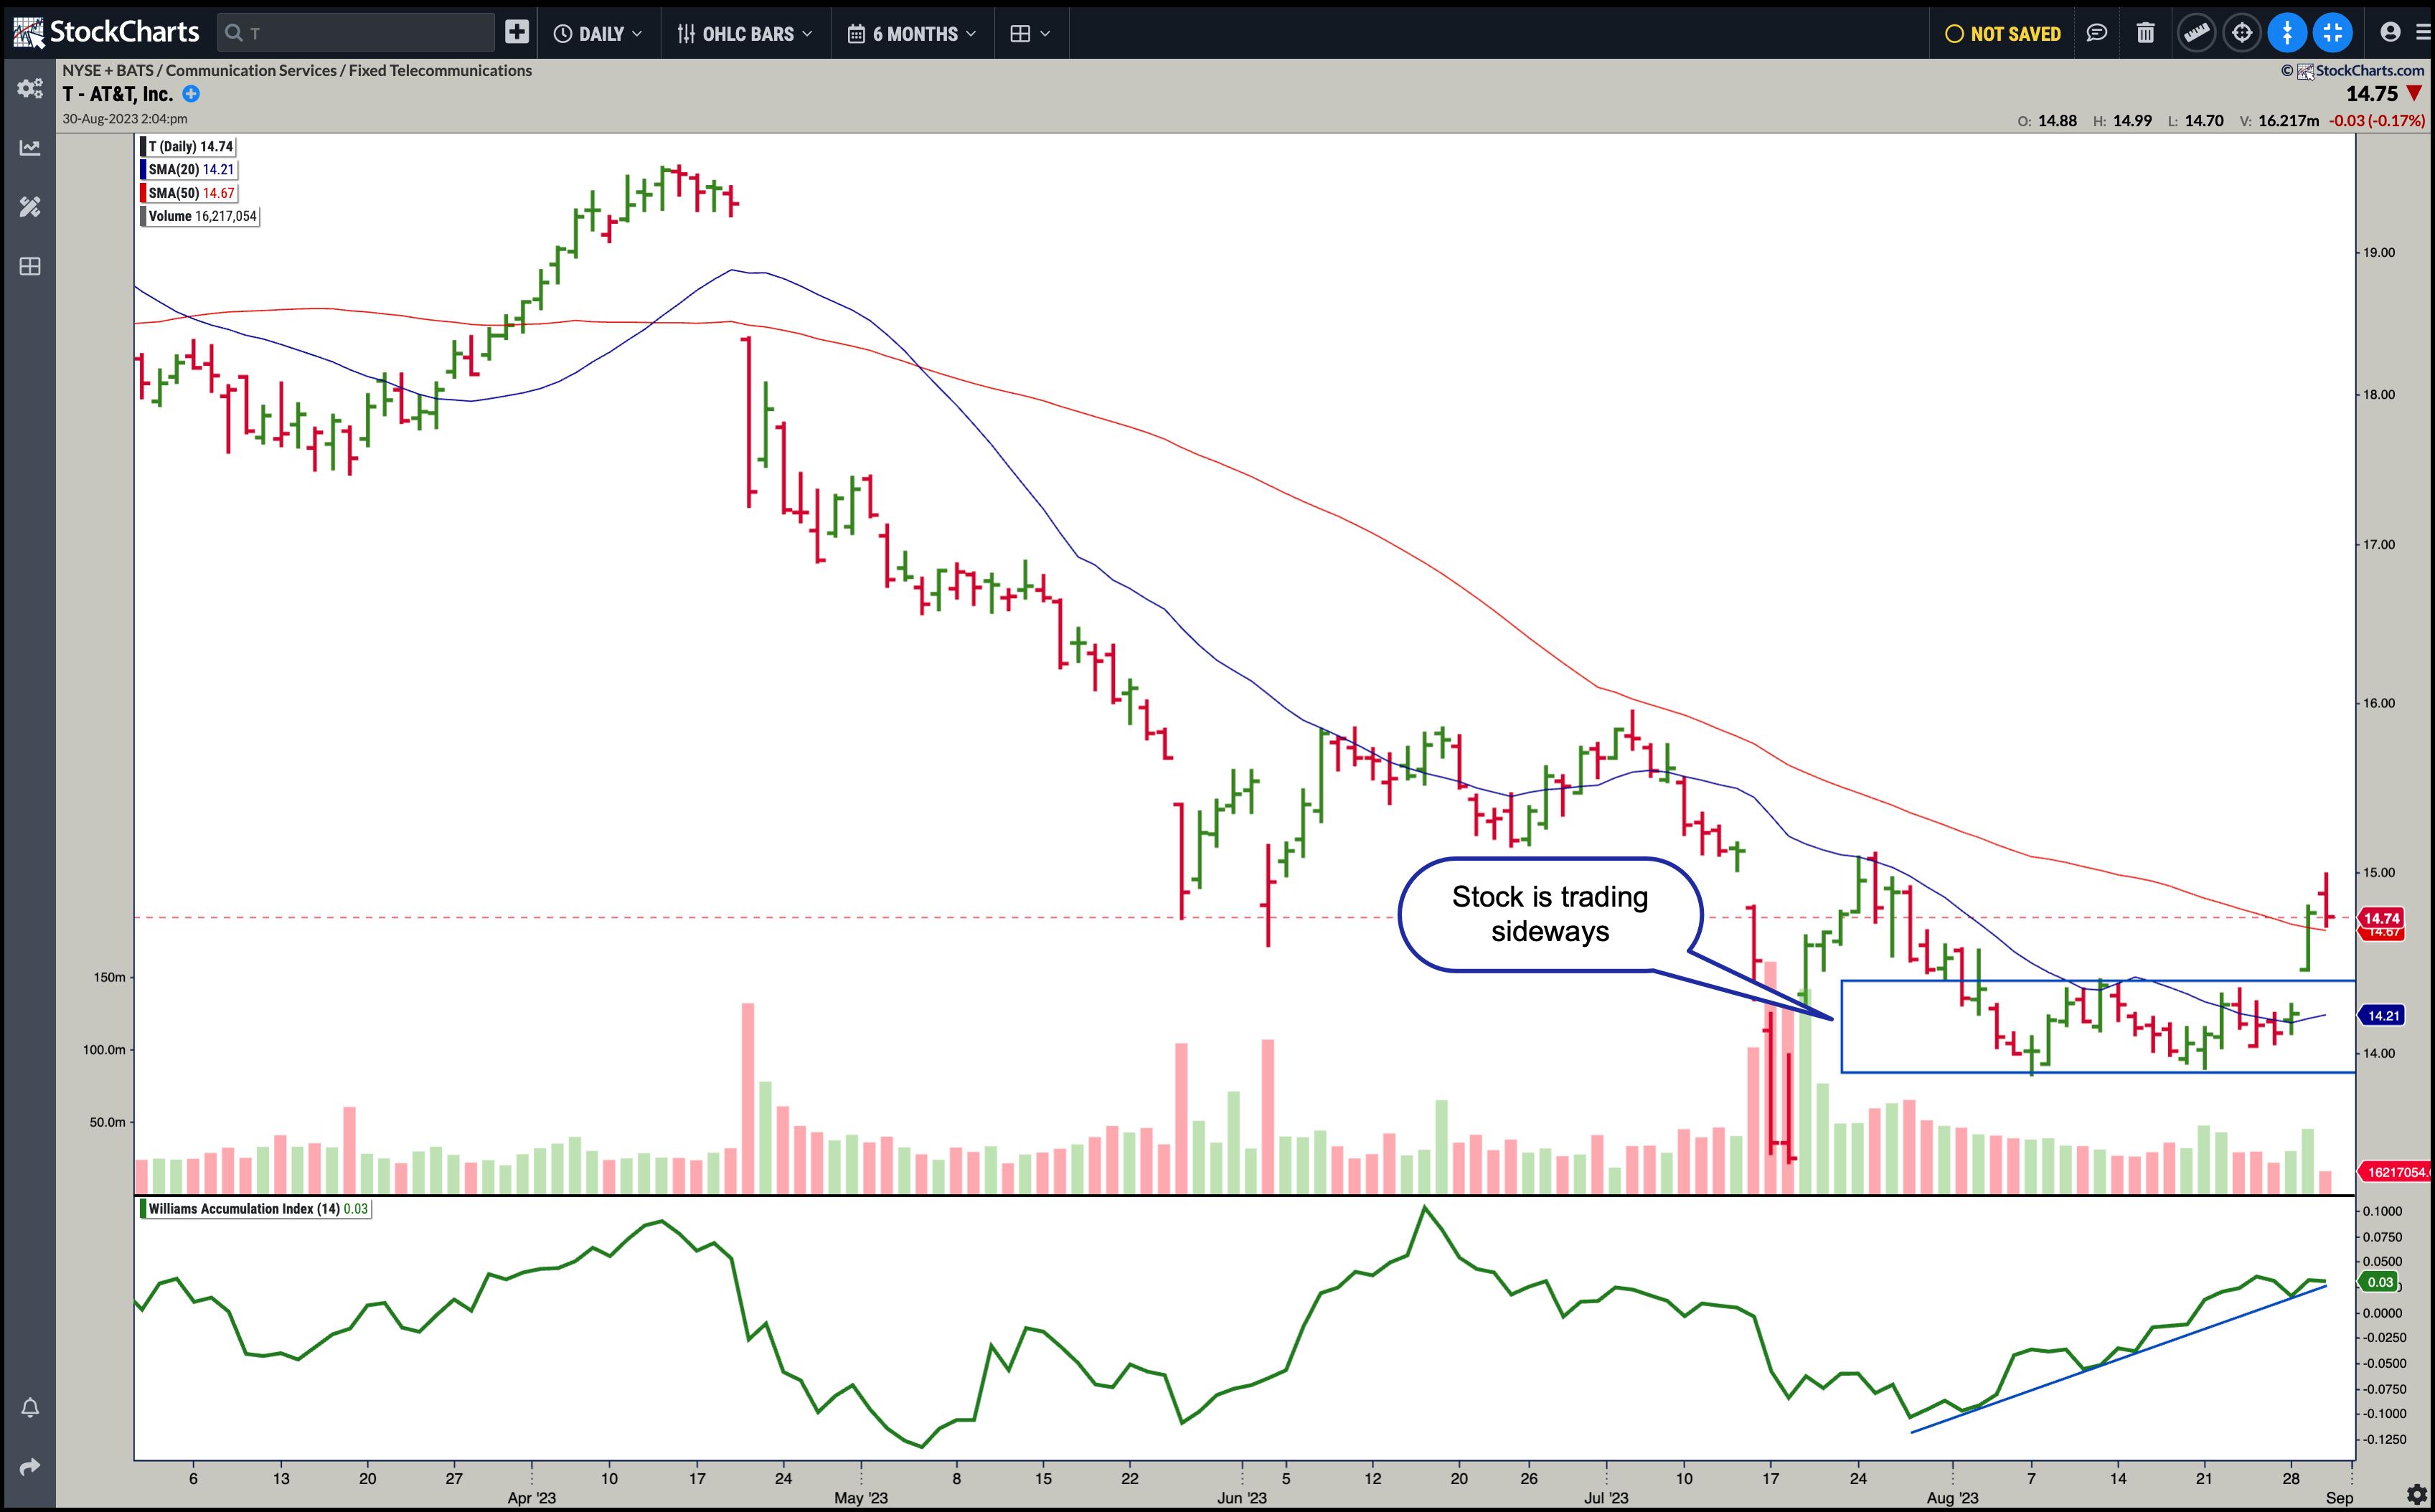
CHART 4: DAILY CHART OF AT&T. The stock may trend higher, but there could be room for further pullback. Watch to see if the 50-day moving average acts as a support level.Chart source: StockChartsACP. For educational purposes.
The Bottom Line
Regardless of which stocks you identify as potential long candidates, it's always worth going back to the macro view of the market. Know how the overall market is doing and determine if the bull market is still in play. The last thing you want to do is buy long positions when there's a chance the entire market might move lower. September is coming up, so please be sure to tread with caution.

Disclaimer: This blog is for educational purposes only and should not be construed as financial advice. The ideas and strategies should never be used without first assessing your own personal and financial situation, or without consulting a financial professional.
Happy charting!
